. 2024 Feb 1;53(1):dyad162.
doi: 10.1093/ije/dyad162.

Clinical and biochemical associations of urinary metabolites: quantitative epidemiological approach on renal-cardiometabolic biomarkers

Affiliations

Clinical and biochemical associations of urinary metabolites: quantitative epidemiological approach on renal-cardiometabolic biomarkers

Tianqi Li et al. Int J Epidemiol. .

Abstract

Background: Urinary metabolomics has demonstrated considerable potential to assess kidney function and its metabolic corollaries in health and disease. However, applications in epidemiology remain sparse due to technical challenges.

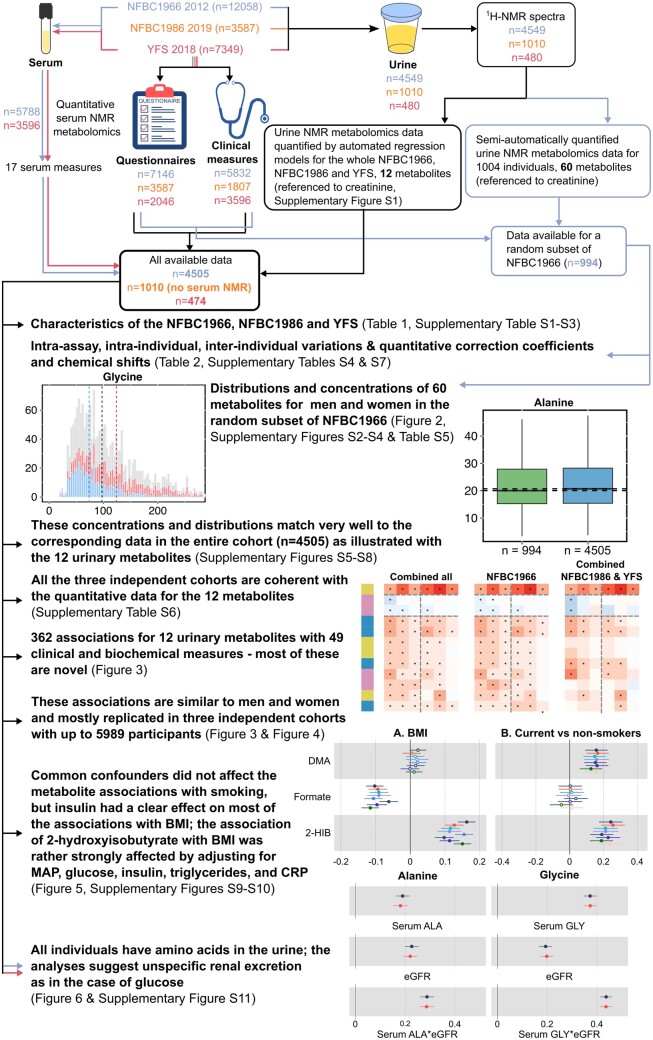
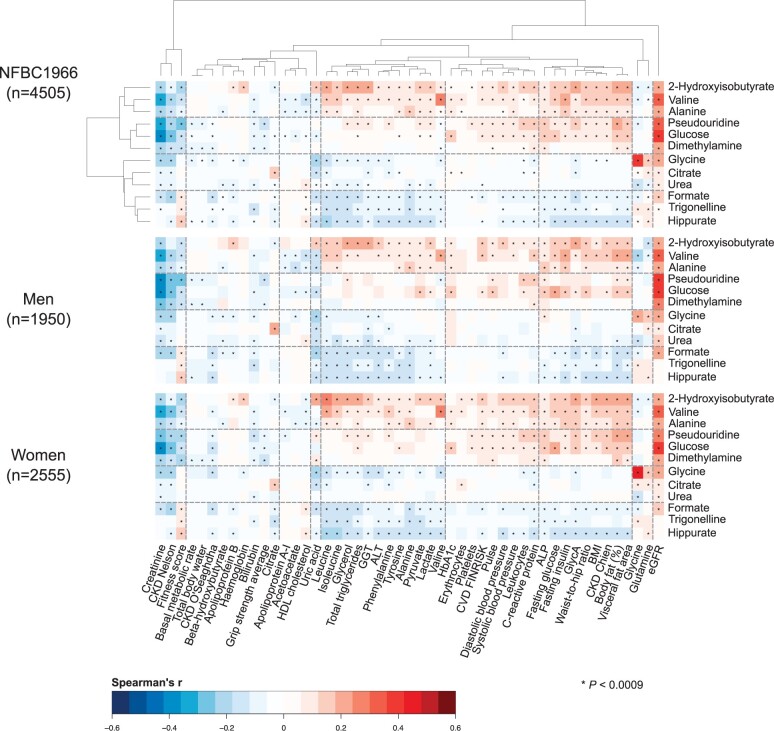
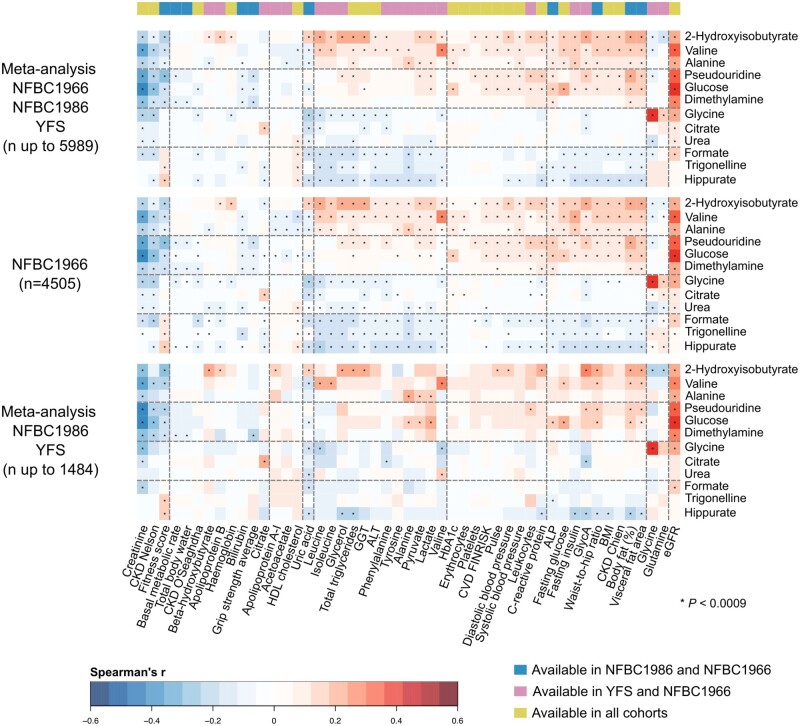
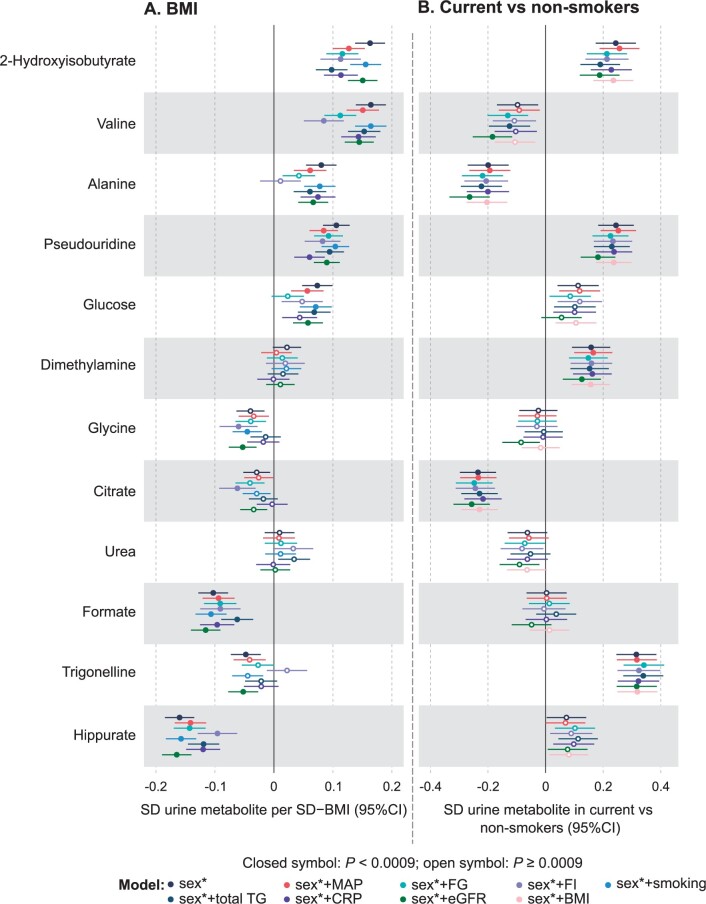
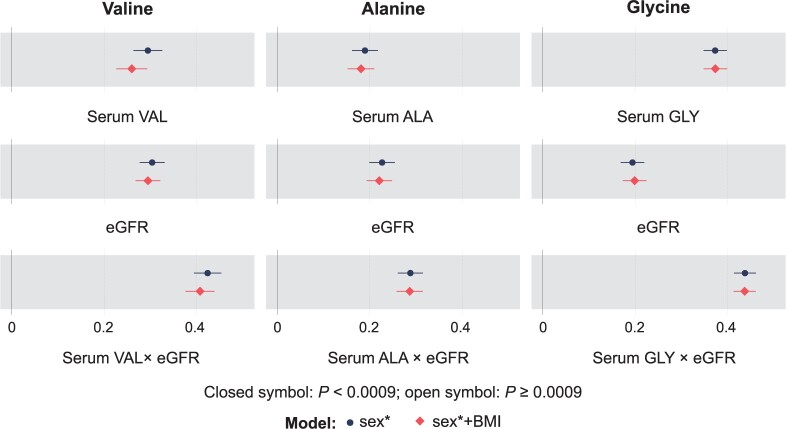
Methods: We added 17 metabolites to an open-access urinary nuclear magnetic resonance metabolomics platform, extending the panel to 61 metabolites (n = 994). We also introduced automated quantification for 11 metabolites, extending the panel to 12 metabolites (+creatinine). Epidemiological associations between these 12 metabolites and 49 clinical measures were studied in three independent cohorts (up to 5989 participants). Detailed regression analyses with various confounding factors are presented for body mass index (BMI) and smoking.

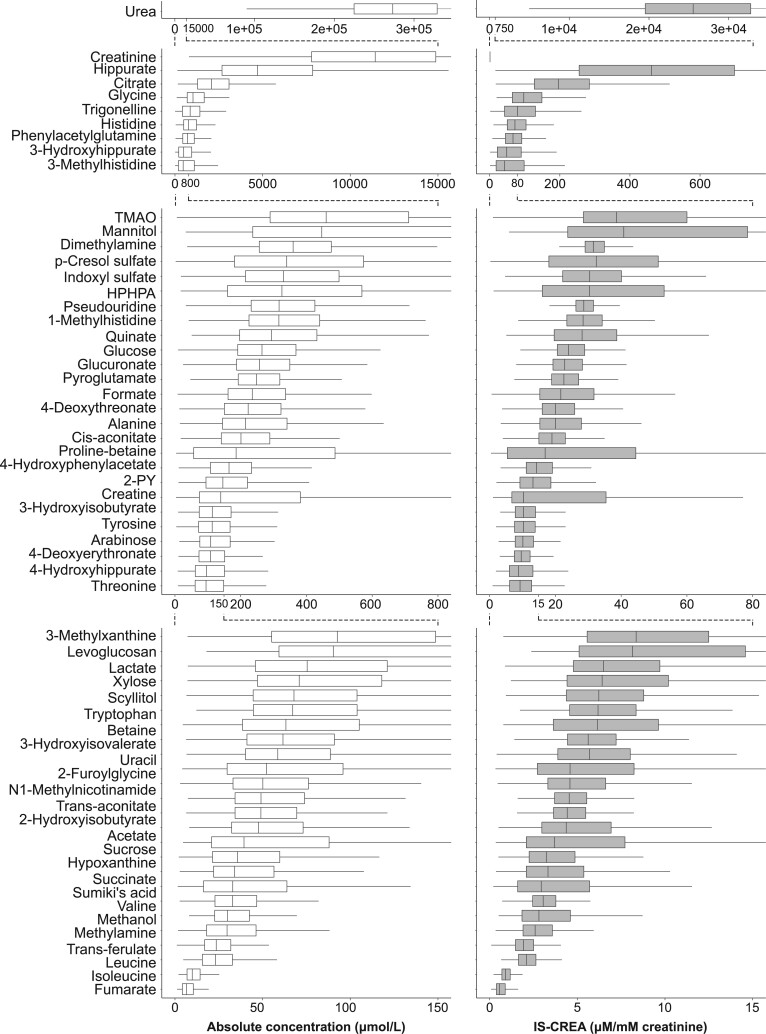
Results: Sex-specific population reference concentrations and distributions are provided for 61 urinary metabolites (419 men and 575 women), together with methodological intra-assay metabolite variations as well as the biological intra-individual and epidemiological population variations. For the 12 metabolites, 362 associations were found. These are mostly novel and reflect potential molecular proxies to estimate kidney function, as the associations cannot be simply explained by estimated glomerular filtration rate. Unspecific renal excretion results in leakage of amino acids (and glucose) to urine in all individuals. Seven urinary metabolites associated with smoking, providing questionnaire-independent proxy measures of smoking status in epidemiological studies. Common confounders did not affect metabolite associations with smoking, but insulin had a clear effect on most associations with BMI, including strong effects on 2-hydroxyisobutyrate, valine, alanine, trigonelline and hippurate.

Conclusions: Urinary metabolomics provides new insight on kidney function and related biomarkers on the renal-cardiometabolic system, supporting large-scale applications in epidemiology.

Keywords: Metabolomics; biomarkers; kidney function; metabolism; urine.


Conflict of interest statement

None declared.

Figures

Figure 1.
Figure 1.
A flowchart illustrating the study design, statistical analyses and key findings. The data from NFBC1966, NFBC1986 and YFS are indicated by colour-coded arrows: blue, orange and red, respectively. The black arrows represent analyses for all the cohorts. NFBC, Northern Finland Birth Cohort; YFS, Cardiovascular Risk in Young Finns Study; NMR, nuclear magnetic resonance; 1H-NMR, proton nuclear magnetic resonance; BMI, body mass index; MAP, mean arterial pressure; CRP, C-reactive protein; eGFR, estimated glomerular filtration rate
Figure 2.
Figure 2.
Absolute (left) and creatinine-referenced (right) concentrations of 61 quantified urinary metabolites in a random subset (n = 994) of morning spot urine samples in the Northern Finland Birth Cohort 1966. The metabolites are presented in the descending order of median absolute concentrations. Several different scales are used for the x-axes to provide a clear visualization for the large concentration ranges. TMAO, trimethylamine N-oxide; HPHPA, 3-(3-hydroxyphenyl)-3-hydroxypropanoate; 2-PY, N1-methyl-2-pyridone-5-carboxamide; IS-CREA, use the creatinine concentration as the internal standard
Figure 3.
Figure 3.
The associations between the 12 automatically quantified urinary metabolites (referenced to urinary creatinine) and 49 customary clinical and biochemical measures as indicated by Spearman’s rank correlations (adjusted for sex) for the entire Northern Finland Birth Cohort 1966 (n = 4505) as well as for men (n = 1950) and women (n = 2555). The two-dimensional hierarchical clustering is based on the results for the entire cohort, and the resulting ordering is preserved in all the following heat maps. Four three-metabolite clusters were rendered that reflect the clinical and biochemical associations of the urinary metabolites. P-value <0.0009 is marked with an asterisk in the map to indicate a multiple testing corrected association. ALP, alkaline phosphatase; ALT, alanine aminotransferase; GGT, gamma-glutamyl transferase; eGFR, estimated glomerular filtration rate; CKD, chronic kidney disease; HbA1c, glycated haemoglobin; BMI, body mass index; GlycA, glycoprotein acetyls; FINRISK, a large Finnish population survey of risk factors for chronic, noncommunicable diseases
Figure 4.
Figure 4.
Meta-analyses of the associations (Spearman’s rank correlations adjusted for sex) between the 12 automatically quantified urinary metabolites (referenced to urinary creatinine) and 49 customary clinical and biochemical measures, to illustrate the replication of the findings in all the three independent population cohorts. The uppermost heat map shows the full meta-analyses for all the available data (n up to 5989). The heat map in the middle is for the entire NFBC1966 (the same heat map as in Figure 3, to facilitate visual comparison). The lowermost heat map shows the meta-analysis for NFBC1986 and YFS (n up to 1484). The heat maps are presented in the same order of metabolites and clusters as in Figure 3. The colour key on the top of the figure represents the availability of clinical and biochemical measures in the three cohorts. There were 20 measures available in all three cohorts (green), 19 measures available only in NFBC1966 and YFS (pink) and 10 measures available only in NFBC1966 and NFBC1986 (blue). P-value <0.0009 is marked with an asterisk in the map to indicate a multiple testing corrected association. ALP, alkaline phosphatase; ALT, alanine aminotransferase; GGT, gamma-glutamyl transferase; eGFR, estimated glomerular filtration rate; CKD, chronic kidney disease; HbA1c, glycated haemoglobin; BMI, body mass index; GlycA, glycoprotein acetyls; FINRISK, a large Finnish population survey of risk factors for chronic, noncommunicable diseases; NFBC, Northern Finland Birth Cohort; YFS, Cardiovascular Risk in Young Finns Study
Figure 5.
Figure 5.
Meta-analyses of the regression models for body mass index (A) and smoking (B) with the 12 automatically quantified urinary metabolites (referenced to creatinine). The effects of sex (black), sex + MAP (red), sex + fasting glucose (cyan), sex + fasting insulin (lila), sex + smoking (light blue, applied to the BMI models only), sex + total triglycerides (blue), sex + CRP (violet), sex + eGFR (green) and sex + BMI (blush, applied to the smoking models only) were examined; asterisk indicates that age was also adjusted for YFS. The smoking data for the cohorts are: NFBC1966, 750 current and 3544 non-smokers; NFBC1986, 115 current and 706 non-smokers; and YFS, 85 current and 370 non-smokers. MAP, mean arterial pressure; CRP, C-reactive protein; eGFR, estimated glomerular filtration rate; YFS, Cardiovascular Risk in Young Finns Study; NFBC, Northern Finland Birth Cohort
Figure 6
Figure 6
Meta-analyses of the regression models for the three automatically quantified urinary amino acids (valine, alanine and glycine) concentrations (referenced to creatinine) and their corresponding serum concentrations, eGFR, and the multiplication of the serum concentration and eGFR in Northern Finland Birth Cohort 1966 (n = 4505) and Cardiovascular Risk in Young Finns Study (n = 474). The effects of sex (black circle) and sex + BMI (red diamond) were examined; asterisk indicates that age was also adjusted for in YFS. eGFR, estimated glomerular filtration rate; YFS, Cardiovascular Risk in Young Finns Study

References

    1. Li T, Ihanus A, Ohukainen P. et al. There is always glucose in normal urine: unspecific excretion associated with serum glucose and glomerular filtration rate. Int J Epidemiol. 2022;51:2022–25. - PMC - PubMed
    1. Holmes E, Loo RL, Stamler J. et al. Human metabolic phenotype diversity and its association with diet and blood pressure. Nature 2008;453:396–400. - PMC - PubMed
    1. Nicholson G, Rantalainen M, Maher AD. et al. Human metabolic profiles are stably controlled by genetic and environmental variation. Mol Syst Biol 2011;7:525. - PMC - PubMed
    1. Elliott P, Posma JM, Chan Q. et al. Urinary metabolic signatures of human adiposity. Sci Transl Med 2015;7:285ra62. - PMC - PubMed
    1. Emwas A-H, Roy R, McKay RT. et al. Recommendations and standardization of biomarker quantification using NMR-based metabolomics with particular focus on urinary analysis. J Proteome Res 2016;15:360–73. - PMC - PubMed