. 2023 Nov 29;14(1):7759.
doi: 10.1038/s41467-023-43519-1.

HDAC8-mediated inhibition of EP300 drives a transcriptional state that increases melanoma brain metastasis

Affiliations

HDAC8-mediated inhibition of EP300 drives a transcriptional state that increases melanoma brain metastasis

Michael F Emmons et al. Nat Commun. .

Abstract

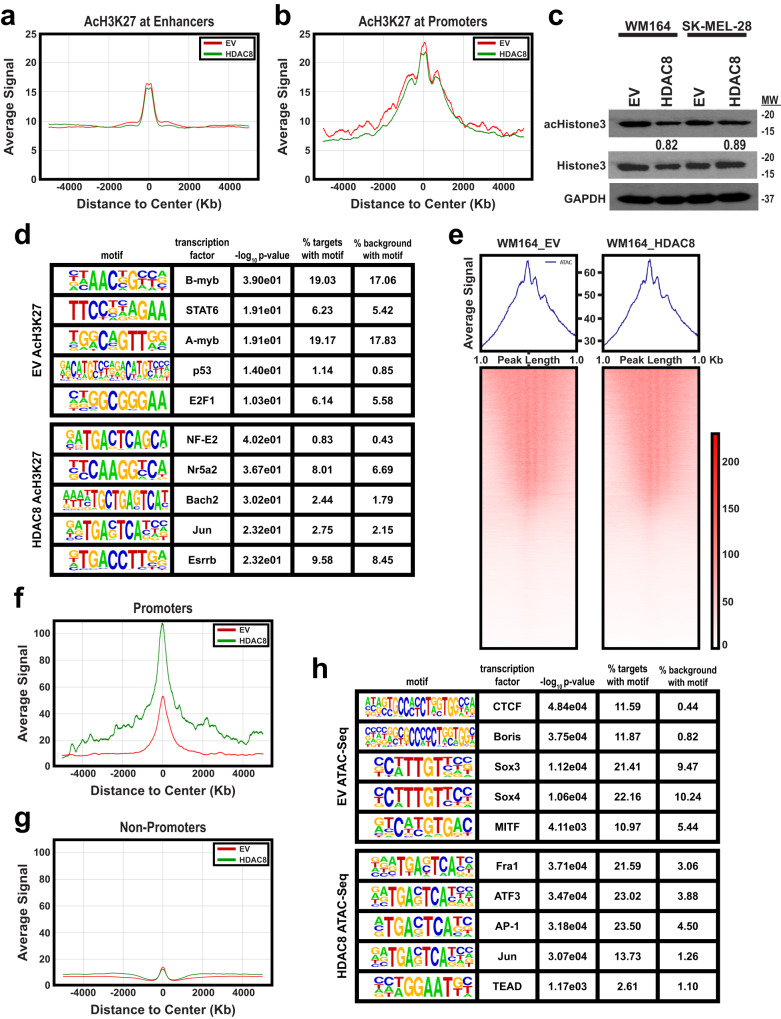
Melanomas can adopt multiple transcriptional states. Little is known about the epigenetic drivers of these cell states, limiting our ability to regulate melanoma heterogeneity. Here, we identify stress-induced HDAC8 activity as driving melanoma brain metastasis development. Exposure of melanocytes and melanoma cells to multiple stresses increases HDAC8 activation leading to a neural crest-stem cell transcriptional state and an amoeboid, invasive phenotype that increases seeding to the brain. Using ATAC-Seq and ChIP-Seq we show that increased HDAC8 activity alters chromatin structure by increasing H3K27ac and enhancing accessibility at c-Jun binding sites. Functionally, HDAC8 deacetylates the histone acetyltransferase EP300, causing its enzymatic inactivation. This, in turn, increases binding of EP300 to Jun-transcriptional sites and decreases binding to MITF-transcriptional sites. Inhibition of EP300 increases melanoma cell invasion, resistance to stress and increases melanoma brain metastasis development. HDAC8 is identified as a mediator of transcriptional co-factor inactivation and chromatin accessibility that drives brain metastasis.


Conflict of interest statement

P.A.F. serves on advisory boards for AbbVie Inc., Bristol-Myers Squibb, Boehringer-Ingelheim, NCI Neuro-Oncology Branch Peer Review, NCRI, NIH, Novellus, Physical Sciences Oncology Network, Tocagen (not active), Ziopharm, National Brain Tumor Society and as a consultant for Bayer, BTG, GlaxoSmithKline (GSK), Inovio, and Novocure. KSMS receives grant funding from Revolution Medicines and honoraria from Elsevier unrelated to the current study. J.M.K. receives salary support from BMS. The remaining authors declare no conflict of interest.

Figures

Fig. 1
Fig. 1. HDAC8 expression confers stress resistance in melanocytes and melanoma.
a Cell lines treated with vemurafenib (BRAFi) were organized into BRAFi sensitive (IC50 < 1 µM) BRAFi intermediate (IC50 = 1), and BRAFi resistant (IC50 > 1 µM). Cells were probed for HDAC8, acetylated SMC3 (acSMC3), SMC3, phospho-EGFR (p-EGFR), EGFR, phospho-c-Jun (p-c-Jun), c-Jun, and MITF by immunoblot. b Cells transfected with an empty vector (EV) or HDAC8 construct were probed for HDAC8, acSMC3, SMC3, p-c-Jun, c-Jun, and EGFR by immunoblot with ImageJ quantification. c Cells were treated with vehicle (1:1000 DMSO, VC), or with BRAF and MEK inhibition (100 nmol/L dabrafenib, 10 nmol/L trametinib, BRAFi-MEKi) for 72 h. Apoptosis was measured by Annexin V APC staining. Significance was determined by a one-way ANOVA followed by a 2-tailed t test with *=p < 0.05 (WM164: p = 0.0148 and SK-MEL-28: p = 0.0104). Cells were treated with (d) 13.85 KJ/m2 UV irradiation or (e) 1% O2 for 24 h followed by cell death measurement by trypan exclusion. Significance was determined by a one-way ANOVA followed by a 2-tailed t test with ***=p < 0.001 and **=p < 0.01. In (d), WM164 p value < 0.0001 and SK-MEL-28 p value < 0.0001. In (e), WM164 p value = 0.0016 and SK-MEL-28 p value = 0.0014. f Primary melanocyte cells were treated with 13.85 KJ/m2 UV irradiation for indicated time points. Lysates were collected and probed for p-c-Jun, c-Jun, HDAC1, HDAC2, HDAC3, and HDAC8 by immunoblot with ImageJ quantification. g HERMES1 and 3 cells (melanocytes) were transfected with an EV or HDAC8 construct and probed for HDAC8, MITF, p-c-Jun, and c-Jun by immunoblot with ImageJ quantification. HERMES1 and 3 cells were treated with (h) 13.85 KJ/m2 UV irradiation or (i) 1% O2 for 24 h followed by cell death measurement by trypan exclusion. Significance was determined by a one-way ANOVA followed by a 2-tailed t test with *=p < 0.05 and **=p < 0.01, and ***=p < 0.001. In (h), HERMES1 p value = 0.028 and HERMES3 p value = 0.0008. In (i), HERMES1 p value = 0.0198 and HERMES3 p value = 0.0063. All experiments were run 3 independent times with an n of 3 in each cohort in (c) and an n of 8 in each cohort in (d), (e), (h) and (i). All data are presented as mean values ±SD. Source data are provided as a Source Data file.
Fig. 2
Fig. 2. HDAC8 drives a transcriptional switch in melanoma cells.
a RNA-seq was performed in triplicate on EV and HDAC8 expressing WM164 and SK-MEL-28 cells with significantly changed genes assigned a log2 fold change value ±0.58 and a 2 sided p value < 0.05 without multiple hypothesis testing. The number of uniquely and overlapping upregulated genes upon HDAC8 expression are shown in the Venn diagram. b, c A KEGG pathway analysis was performed on overlapping significantly changed genes using RNA-seq data for both WM164 (EV vs HDAC8) and SK-MEL-28 (EV vs HDAC8) expressing cells. Pathways enhanced in HDAC8 expressing cells are shown in (b) and pathways downregulated in HDAC8 expressing cells are shown in (c). d A Ranked Order analysis was performed on NCSC and NCSC/undifferentiated genes using GSEA software. Shown is the normalized enrichment score (NES) and 2-sided nominal p value of the dataset without multiple hypothesis testing. Significance is determined by having a nominal p value < 0.05. e Heat maps were made of significantly altered NCSC genes comparing EV and HDAC8 expressing cells. f, g ChIP-Seq was performed on EV and HDAC8 expressing WM164 cells using an acetyl-H3K27 antibody followed by interrogation of gene promoter regions. HDAC8 expression increased H3K27 acetylation in promoter regions in (f) NCSC genes (FAM83G and AXL) and decreased H3K27 acetylation in promoter regions in (g) melanocytic genes (MLANA and DCT).
Fig. 3
Fig. 3. HDAC8 increases invasion and an amoeboid-like state in melanoma cells.
a HDAC8 expression increases invasion in a collagen-implanted spheroid assay. EV and HDAC8 expressing melanoma spheroids were plated in collagen for indicated time points. Scale bars = 500 µm. b Spheroid invasion area was quantified using ImageJ software. Significance was determined using a 2-tailed student’s t test with ***p < 0.001. (WM164: p = 0.0002 and SK-MEL-28: p < 0.0001). c HDAC8 expression increases invasion into Matrigel. EV and HDAC8 expressing cells were overlayed onto transwell inserts coated with Matrigel and allowed to invade for 48 h followed by imaging by confocal microscopy. Scale bars = 100 µm. d Invasion area was quantified using ImageJ software. Significance was determined using a 2-tailed student’s t test with **p < 0.01. (p = 0.0028). e HDAC8 increases melanoma survival in shear stress/flow assays. Cells were incubated for 24 h under continual shear stress conditions of 10 dyne/cm2. Cells were stained with Calcein AM/PI and imaged for cell viability. Scale bars = 250 µm. f Data shows numbers of dead cells (PI-positive cells) per image from (e). Significance was determined using a 2-tailed student’s t test with ***p < 0.001. (WM164: p < 0.0001 and SK-MEL-28: p < 0.0001). g HDAC8 leads to the adoption of an amoeboid-like morphology in melanoma cells. HDAC8 and EV expressing cells were plated on collagen overnight followed by brightfield image collection. Scale bars = 250 µm. h HDAC8 enhances transendothelial cell migration. DiI-stained HDAC8 and EV cells were allowed to migrate through a HUVEC coated transwell membrane for 1 h followed by imaging with fluorescence microscopy. Scale bars = 1000 µm. i Quantification of the DiI-stained cells that had migrated through the endothelial cell monolayer (cells per image). Significance was determined using a 2-tailed student’s t test with ***p < 0.001. (WM164: p < 0.0001 and SK-MEL-28: p < 0.0001). Experiments were run 3 independent times with an n of 3 in (d) and an n of 5 in (b), (f), and (i). All data are presented as mean values ± SD. Source data are provided as a Source Data file.
Fig. 4
Fig. 4. HDAC8 increases the establishment of melanoma brain metastases.
ac HDAC8 and EV expressing WM164 cells were introduced into NOD.CB17-Prkdcscid/J mice by intracardiac injection. a Tumors were allowed to establish for indicated time points with numbers of metastases measured in H&E sections of the liver and lung. Number of metastases present in the (b) liver and (c) lungs were calculated using Imagescope. Significance in (b) and (c) was determined by a one-way ANOVA followed by a 2-tailed post hoc t test with *=p < 0.05, and #=p > 0.05. In (b), day 5 p = .0213. Data are presented as mean values of 5 mice ±SD. df HDAC8 and EV expressing WM164, SK-MEL-28 and 1205Lu cells were introduced into NOD.CB17-Prkdcscid/J mice by intracardiac injection and allowed to incubate for 14 days. d Number of mice with brain tumors were counted for each condition using Imagescope software. Significance in (d) was determined by a 2-sided chi-squared test on an n of 20 mice in WM164 cells and an n of 10 mice in SK-MEL-28 cells with **=p < 0.01. (WM164: p = 0.0035 and SK-MEL-28: p = 0.0098). e Number of brain metastases per mouse brain under each condition were counted using Imagescope software. Significance was determined by a one-way ANOVA followed by a 2-tailed t test on an n of 20 mice in WM164 cells, an n of 10 mice in SK-MEL-28 cells and an n of 3 mice in 1205Lu cells with *=p < 0.05 (WM164 p = 0.0109, SK-MEL-28 p = 0.0291, 1205Lu p = 0.0463). f Embedded brain sections were stained with H&E and an IHC for PMEL (gp100) to determine tumor formation. Scale bars in 1x images = 4 mm. Scale bars in 10x images = 300 µm. g Patient-derived scRNA-Seq data (#’s=melanoma cutaneous samples, LMD melanoma leptomeningeal metastasis samples, MB melanoma brain metastases samples) were interrogated for expression of NCSC genes. (Left: sample level data for melanoma cells. Right: Expression of the NCSC gene signature in the melanoma cells). h A Spearman correlation analysis was run to determine the relationship of HDAC8 expression and the NCSC gene expression signature from the human scRNA-Seq data. A p value p < 0.05 corresponds to a significant correlation. Source data are provided as a Source Data file.
Fig. 5
Fig. 5. HDAC8 activation induces changes in chromatin accessibility of Jun and MITF targeted genes.
A ChIP-Seq analysis was performed on HDAC8 expressing and EV expressing melanoma cells at both (a) promoter and (b) enhancer regions. c Cell lines were probed for acetyl-Histone3 and total-Histone 3 levels by immunoblot. Levels of acetyl-Histone3 were normalized to total-Histone3 and quantified by ImageJ. d A HOMER analysis was performed on HDAC8 and EV expressing cells. Shown are enriched transcription factor binding motifs in HDAC8 and EV expressing cells. eg ATAC-Seq was performed on HDAC8 expressing and EV expressing cells. e A global analysis of all open chromatin was performed. A global analysis was performed on HDAC8 expressing and EV expressing melanoma cells at both (f) promoter and (g) non-promoter regions. h HDAC8 expression increases accessibility in Jun targeted genes and decreases accessibility of MITF targeted genes. A HOMER analysis was performed on ATAC-Seq data. HDAC8 was associated with increased accessibility at Jun binding sites while the EV control had increased accessibility at MITF binding sites. Source data are provided as a Source Data file.
Fig. 6
Fig. 6. HDAC8 deacetylates and inactivates EP300 leading to increased JUN transcriptional activity.
a A GREAT analysis was performed on genes with enhanced accessibility/H3K27 acetylation around their transcription start sites. b, c ATAC-seq analysis of EV and HDAC8 expressing WM164 melanoma cells. There is increased accessibility in the promoter region of the (b) NCSC gene SOX2 while there is decreased accessibility in the promoter region of the (c) melanocyte gene MLANA upon HDAC8 expression. Data show 3 independent tracks. d, e A mass spectrometry-based acetylomic analysis was performed on HDAC8 and EV expressing WM164 cells. d Proteins deacetylated by HDAC8 identified by mass spectrometry were organized into signaling hubs using STRING. e Mass spectrometry was used to identify significantly changed lysine acetylation sites in the HAT domain of EP300 are shown. Figures shows the 4 identified lysine residues deacetylated upon introduction of HDAC8. Significance was determined using a 2-tailed student’s t test with *p < 0.05. f HDAC8 deacetylates EP300. Immunoprecipitation assays were performed with EP300 in the cell lines indicated. Lysates were probed for acetyl-lysine levels by immunoblot. Levels of acetyl-EP300 were normalized to EP300 input controls and quantified by ImageJ. g HDAC8 inhibits the HAT activity of EP300. Immunoprecipitation assays were performed with EP300 in two independent melanoma cell lines (WM164 and SK-MEL-28). Collected lysates were analyzed for EP300 mediated H4 histone acetylation. Significance was determined by a 2-tailed student’s t test with *=p < 0.05 and **=p < 0.01 (WM164: p = 0.0095 and SK-MEL-28: p = 0.0103). h HDAC8 expression increases the binding of EP300 to Jun promoters and decreases binding to MITF promoters. A ChIP assay was performed on EP300 binding to the promoter region of Axl and MLANA. Significance was determined by a one-way ANOVA followed by a post hoc 2-tailed t test with *=p < 0.05 (WM164: p = 0.0231 and SK-MEL-28: p = 0.0336). Experiments were run 3 independent times with an n of 4 in each cohort. All data are presented as mean values ±SD. Source data are provided as a Source Data file.
Fig. 7
Fig. 7. Inhibition of EP300 drives the stress-resistant, invasive phenotype in melanoma cells.
a Cells were probed for EP300, CREBBP and HDAC8 by immunoblot. b, c Cells were treated with vemurafenib (1 μmol/L, BRAFi), I-CBP112 (100 nmol/L, EP300i/CREBBPi) or combination for 21 days following acetic acid permeabilization. Significance was determined by a one-way ANOVA followed by a 2-tailed t test with *=p < 0.05 (EV: p = 0.0352, HDAC8: p = 0.0129). d WM164 cells were transfected with non-silencing siRNA (siNS) or EP300 siRNA (siEP300_1 or siEP300_2). Cells were probed for EP300 and CREBBP after 72 h with ImageJ quantification. Cells were treated with dabrafenib and trametinib (100 nmol/L dabrafenib, 10 nmol/L trametinib, BRAFi-MEKi) for 72 h. Apoptosis was measured by Annexin V APC staining. Significance was determined by a one-way ANOVA followed by a 2-tailed t test with *=p < 0.05 and **=p < 0.01 (siEP300_1: p value = 0.0373, siEP300_2: p value = 0.0036). e Cells were treated with I-CBP112 (100 nmol/L) for 24 h. Lysates were collected and probed for p-c-Jun and c-Jun by immunoblot with ImageJ quantification. Cells were treated with (f) 13.85 KJ/m2 UV irradiation or (g) 1% O2 for 24 h followed by cell death measurement. Significance was determined by a 2-tailed student’s t test with *=p < 0.05, **=p < 0.01 and ***=p < 0.001. In (f), WM164 p value = 0.0125 and SK-MEL-28 p value = 0.0052. In g, WM164 p value = 0.0004 and SK-MEL-28 p value = 0.0001. h, i Melanoma spheroids infected with shNS or shEP300 were plated in collagen. Scale bars = 500 µm. j Invasion area was quantified using ImageJ. Significance was determined by a 2-tailed student’s t test with *=p < 0.05, and **=p < 0.01. (WM164: p value = 0.0132 and SK-MEL-28: p value = 0.0017). kl shNS and shEP300 SK-MEL-28 cells were injected into NOD.CB17-Prkdcscid/J mice and established for 14 days. k Brain sections were stained with H&E. Scale bars in 1x images = 4 mm. Scale bars in 10x images = 300 µm. l Number of tumors and metastases per mouse were quantified. Significance was determined in 10 mice by a 2-tailed student’s t test with *=p < 0.05. (tumor #: p value = 0.0114 and mouse metastases: p value = 0.0191) Experiments were run 3 independent times with an n of 3 in (c), 4 in (d), 5 in (j), and 8 in (f) and (g). All data are presented as mean values ± SD. Source data are provided as a Source Data file.

References

    1. Tsao H, Chin L, Garraway LA, Fisher DE. Melanoma: from mutations to medicine. Gene Dev. 2012;26:1131–1155. doi: 10.1101/gad.191999.112. - DOI - PMC - PubMed
    1. Fife KM, et al. Determinants of outcome in melanoma patients with cerebral metastases. J. Clin. Oncol. 2004;22:1293–1300. doi: 10.1200/JCO.2004.08.140. - DOI - PubMed
    1. Patchell RA. The management of brain metastases. Cancer Treat. Rev. 2003;29:533–540. doi: 10.1016/S0305-7372(03)00105-1. - DOI - PubMed
    1. Chen G, Davies MA. Emerging insights into the molecular biology of brain metastases. Biochem. Pharmacol. 2012;83:305–314. doi: 10.1016/j.bcp.2011.09.012. - DOI - PubMed
    1. Davies MA, et al. Integrated molecular and clinical analysis of AKT activation in metastatic melanoma. Clin. Cancer Res. 2009;15:7538–7546. doi: 10.1158/1078-0432.CCR-09-1985. - DOI - PMC - PubMed

Publication types

MeSH terms