. 2023 Nov 29;14(1):7843.
doi: 10.1038/s41467-023-43534-2.

TRS: a method for determining transcript termini from RNAtag-seq sequencing data

Affiliations

TRS: a method for determining transcript termini from RNAtag-seq sequencing data

Amir Bar et al. Nat Commun. .

Abstract

In bacteria, determination of the 3' termini of transcripts plays an essential role in regulation of gene expression, affecting the functionality and stability of the transcript. Several experimental approaches were developed to identify the 3' termini of transcripts, however, these were applied only to a limited number of bacteria and growth conditions. Here we present a straightforward approach to identify 3' termini from widely available RNA-seq data without the need for additional experiments. Our approach relies on the observation that the RNAtag-seq sequencing protocol results in overabundance of reads mapped to transcript 3' termini. We present TRS (Termini by Read Starts), a computational pipeline exploiting this property to identify 3' termini in RNAtag-seq data, and show that the identified 3' termini are highly reliable. Since RNAtag-seq data are widely available for many bacteria and growth conditions, our approach paves the way for studying bacterial transcription termination in an unprecedented scope.


Conflict of interest statement

The authors declare no competing interests.

Figures

Fig. 1
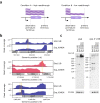
Fig. 1. A typical read coverage at 3’ termini in RNAtag-seq data.
a Shown is the read coverage along the gene talB for three RNAtag-seq libraries (orange, red and cyan lines) mapped to E. coli K-12 MG1655 reference genome (NC_000913.3). The transcription start and termination sites (determined by SEnd-seq) are marked by an arrow or a diamond arrow, respectively. The gene coding sequence is marked by a wide arrow containing the gene name. b Schematic representation of the RNAtag-seq protocol. Briefly, the protocol involves the following steps: Random fragmentation of the RNA (black lines), RNA 3’ end adapter ligation, reverse transcription (gray lines), cDNA adapter ligation, PCR and sequencing. c For multiple transcripts of the same RNA (black lines), break positions created by the random fragmentation (blue slashes) result in randomly distributed 3’ termini except for the genuine 3’ terminus, which is always present. Consequently, the number of read starts (blue bars) at the genuine 3’ terminus is higher than at other 3’ termini, underlying the observed pattern of reads (black arrows).
Fig. 2
Fig. 2. Schematic presentation of the TRS algorithm.
a Read coverage pattern corresponds to the number of read starts in each library (reflecting the 3’ termini of RNA fragments). The number of read starts per position is the input of the algorithm. Step 1: We compute the statistic Ri,j, which measures the local readthrough per genomic position and scales the libraries to the same range of values. Step 2: The averages of Ri,j across libraries (Ri¯) are computed. Step 3: We apply a peak-calling procedure to Ri¯ values and determine putative 3’ termini (purple dots) above a preset threshold (red dashed line). Step 4: For each library, using the original read start counts, we apply a statistical test to the peak positions identified in Step 3 (Methods). The p-values are corrected for multiple hypothesis testing. Positions with p-value ≤ 0.01 (red dashed line) in multiple libraries are determined as 3’ termini. Corrected p-values are presented by -log10(p). Corrected p-values of statistically significant 3’ termini in each library are shown as circles, colored by the library color, and otherwise in black. b Ri,j corresponds to the local readthrough, computed for each library. It is defined as the ratio between the number of reads that pass the position (i.e., reads that start downstream to the position and counted by Di,j) and the total number of reads covering it (i.e., reads that start downstream or reads that start at the position counted by Di,j+Li,j). Presented is the number of read starts in a region around the statistically significant peak shown in a. The number of read starts at the local region is high compared to the downstream region (i.e., Li,jDi,j) and hence Ri,j approaches 1.
Fig. 3
Fig. 3. Classification of 3’ termini according to gene and transcript annotations.
In all panels, blue rectangles represent the protein coding sequence (CDS) of a gene, pink rectangles represent non-coding RNA (ncRNA) genes, and black arrows represent the transcription orientation. Genes that reside in the same transcription unit are surrounded by yellow shading. 3’ termini are divided into three groups and subgroups: (1) Primary – 3’ termini located downstream the stop codon of protein coding genes or at the end of ncRNA genes. This group includes: (i) Primary 3’ termini, positioned up to 100 nucleotides downstream the stop codon of a protein coding gene or at the end of a ncRNA gene. (ii) Distant Primary (DP) termini, positioned up to 200 nucleotides downstream the stop codon of a protein coding gene, when there is no 3’ terminus in the first 100 nucleotides. (iii) Alternative Primary (AP) termini, same as distant primary termini but there is a 3’ terminus in the first 100 nucleotides. (iv) Alternative Primary termini in Transcription Unit (AP in TU), assigned to genes that are not last in their operon (either CDS or ncRNA gene). In this case the region downstream is extended up to 250 nucleotides. (2) Premature – 3’ termini located within the 5’ UTR of genes or in their CDS or in a ncRNA gene. (3) Orphan – 3’ termini located antisense to genes (AS) or in intergenic regions distant from genes (IGR).
Fig. 4
Fig. 4. Overlap of 3’ termini detected by TRS applied to RNAtag-seq data with previously published 3’ termini datasets.
Comparison of the set of 3’ termini detected by applying TRS to published RNAtag-seq data and previously published 3’ termini datasets obtained by term-seq, and SEnd-seq. Each row represents a dataset, and each column represents the intersection of the 3’ termini in corresponding datasets (dark blue circles). The number of 3’ termini in each dataset or intersection is presented by horizontal and vertical bars, respectively.
Fig. 5
Fig. 5. Assessment of 3’ termini detected by TRS applied to RNAtag-seq data.
a Comparison between the 3’ termini identified by TRS applied to data of RNAtag-seq and term-seq conducted on the same RNA samples from cells grown in rich (LB) medium. 3’ termini unique to each protocol were further analyzed for the possible reason they were not detected by the other protocol, either due to low coverage or due to statistically insignificant p-value (low signal). The classification of 3’ termini into these two categories are presented as colored bars, where the number of 3’ termini supported by previous studies,, or in our EG term-seq libraries are marked in yellow. b Classification of 3’ termini identified in the LB RNAtag-seq dataset. The 3’ termini annotations are divided into eight classes following Fig. 3 (outer circle), which can be categorized by the super classes: primary, premature, and orphan 3’ termini (inner circle). c Categories of 3’ termini identified by the various methods. 3’ termini obtained by applying TRS to RNAtag-seq and term-seq data were divided into three groups: overlapping 3’ termini (orange bars), 3’ termini unique to RNAtag-seq (blue) or term-seq (red) datasets. Shown is the relative frequency of each 3’ terminus category within its group.
Fig. 6
Fig. 6. Examples of 3’ termini identified in the term-seq dataset but not in the RNAtag-seq dataset.
Shown are read start patterns of RNAtag-seq (blue) and term-seq (red). a 3’ terminus of adk, identified within the CDS of the gene. Read starts accumulate in term-seq data but not in RNAtag-seq data. b 3’ terminus identified within frr 5’ UTR. Read starts do accumulate in the RNAtag-seq data but not to the same extent as in the term-seq data. The y-axes of a and b are not scaled. The gene coding sequences are marked by blue rectangles below the read coverage plots. Arrows are as in Fig. 1a.
Fig. 7
Fig. 7. 3’ UTR-derived transcripts identified in the LB RNAtag-seq dataset.
a For each gene with a primary or a distant primary 3’ terminus in the LB RNAtag-seq dataset, the log10 transformed average number of read starts within the CDS and 3’ UTR were computed. Presented is the scatterplot of these values for one of the libraries and the regression line fitted (dashed black line). The correlation coefficient is r = 0.85 (p ≤ 3.58E−252 by two-sided Student’s t test). Results for the other two libraries are presented in Supplementary Fig. 8. Genes that were identified as outliers (Methods) are colored red. bd Presented is the coverage along the genes malM (b), tdcG (c), and chiQ (d) that were identified as outliers in a. Transcription start sites identified by Thomason et al. are indicated by arrows and the 3’ termini by diamond arrows. The gene coding sequences are marked by wide arrows containing the gene names.
Fig. 8
Fig. 8. Examples of conditional 3’ termini in EPEC.
a Schematic representation of a primary 3’ terminus (left panel) that changes to a premature 3’ terminus (right panel) in response to change in conditions. Under one condition (left panel) most transcripts extend through the alternative premature 3’ terminus and end at the primary 3’ terminus, manifesting high readthrough at the premature 3’ terminus. Under another condition (right panel) most transcripts end at the premature termination site (low readthrough). b RNAtag-seq read coverage around the conditional 3’ termini (marked by a diamond arrow) in stationary phase/LB and exponential phase/ DMEM conditions. Presented are 3’ termini unique to the stationary phase/LB medium for rpsA, rpsL, and uspA. Highlighted in yellow are the probe locations designed for the northern analysis described in c. c Verification of conditional 3’ termini in rpsA and rpsL by northern analysis. Total RNA extracted from EPEC cultures grown to stationary phase on LB or to exponential phase on DMEM was analyzed, using gene specific probes. 5S rRNA was probed as a loading control. The experiment was done with two biological repeats.
Fig. 9
Fig. 9. Conserved 3’ termini of regulatory elements and sRNAs in bacteria.
Presented is the read coverage around conserved 3’ termini of a regulatory element and sRNAs in E. coli K-12 and four other bacteria: K. pneumoniae, S. enterica, ETEC, and S. flexneri. The 3’ terminus (marked by a diamond arrow) was determined by applying TRS to previously published RNAtag-seq data for the different bacteria. a A premature 3’ terminus identified upstream to mgtA CDS. b The 3’ terminus matching the sRNA FtsO in E. coli K-12. c The 3’ terminus matching the sRNA AceK-int in E. coli K-12, encoded within the CDS of aceK,. Presented 3’ termini are based on data of growth conditions that showed the highest read coverage and exhibited the most consistent results across the different bacteria. The growth conditions per gene and bacterium are as follows: mgtAS. enterica, K. pneumoniae, and S. flexneri (acidic stress), ETEC (nutritional downshift). FtsO – S. enterica, S. flexneri, and ETEC (control), K. pneumoniae (heat shock). aceKS. enterica, K. pneumoniae, and ETEC (nutritional downshift), S. flexneri (acidic stress), EPEC (stationary phase), E. coli K-12 (exponential phase). The read coverages of K. pneumoniae, S. enterica and EPEC are based on paired-end sequencing, and for ETEC, S. flexneri, and E. coli K-12 on single-end sequencing.

References

    1. Sharma CM, et al. The primary transcriptome of the major human pathogen Helicobacter pylori. Nature. 2010;464:250–255. doi: 10.1038/nature08756. - DOI - PubMed
    1. Sharma CM, Vogel J. Differential RNA-seq: the approach behind and the biological insight gained. Curr. Opin. Microbiol. 2014;19:97–105. doi: 10.1016/j.mib.2014.06.010. - DOI - PubMed
    1. Dar D, et al. Term-seq reveals abundant ribo-regulation of antibiotics resistance in bacteria. Science. 2016;352:aad9822. doi: 10.1126/science.aad9822. - DOI - PMC - PubMed
    1. Ju X, Li D, Liu S. Full-length RNA profiling reveals pervasive bidirectional transcription terminators in bacteria. Nat. Microbiol. 2019;4:1907–1918. doi: 10.1038/s41564-019-0500-z. - DOI - PMC - PubMed
    1. Konikkat S, et al. Quantitative mapping of mRNA 3’ ends in Pseudomonas aeruginosa reveals a pervasive role for premature 3’ end formation in response to azithromycin. PLoS Genet. 2021;17:e1009634. doi: 10.1371/journal.pgen.1009634. - DOI - PMC - PubMed

Publication types

MeSH terms