. 2023 Nov 29;14(1):7827.
doi: 10.1038/s41467-023-43329-5.

Contribution of pks+ E. coli mutations to colorectal carcinogenesis

Affiliations

Contribution of pks+ E. coli mutations to colorectal carcinogenesis

Bingjie Chen et al. Nat Commun. .

Abstract

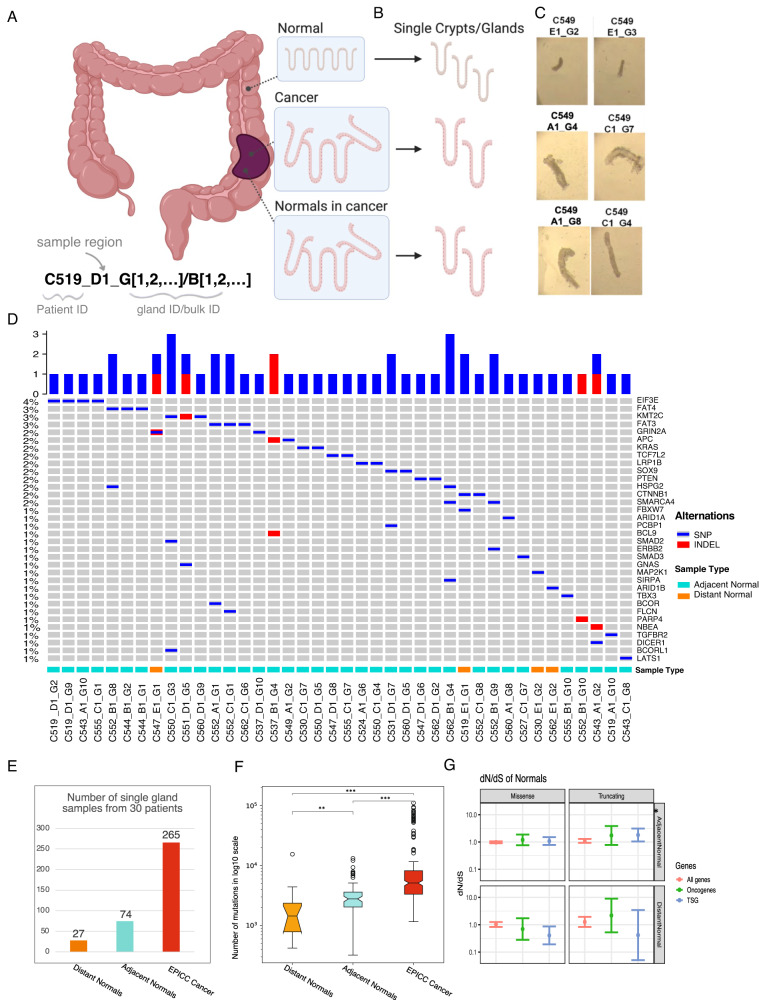
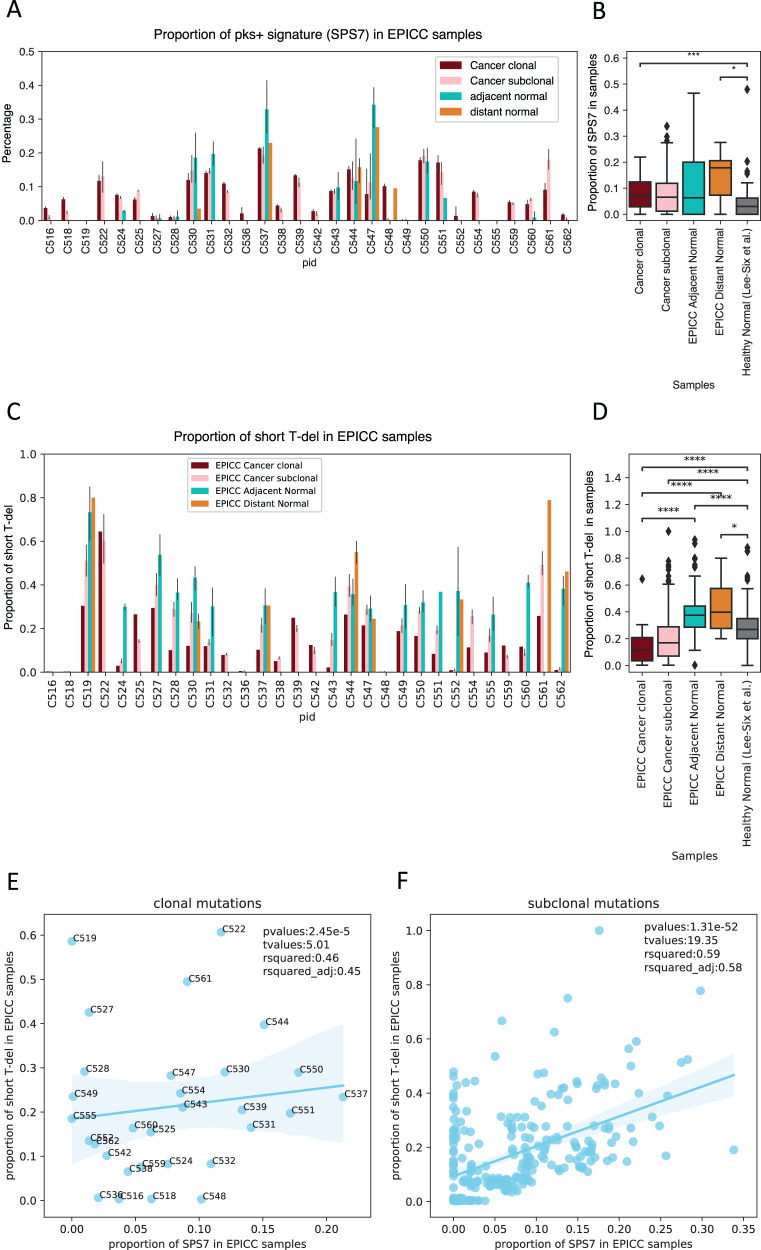
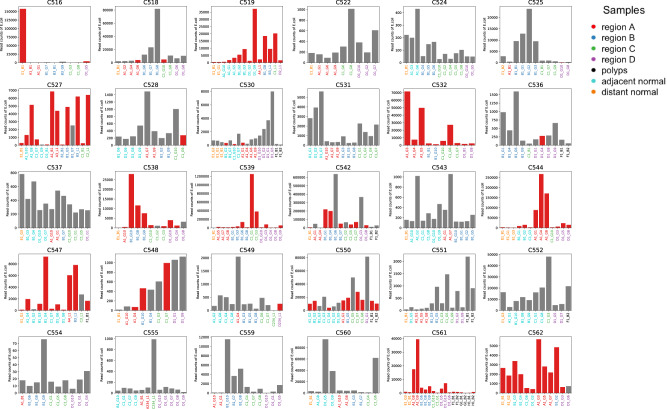
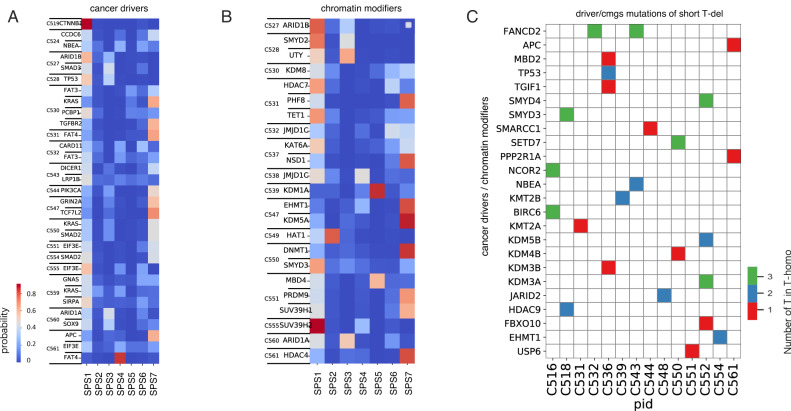
The dominant mutational signature in colorectal cancer genomes is C > T deamination (COSMIC Signature 1) and, in a small subgroup, mismatch repair signature (COSMIC signatures 6 and 44). Mutations in common colorectal cancer driver genes are often not consistent with those signatures. Here we perform whole-genome sequencing of normal colon crypts from cancer patients, matched to a previous multi-omic tumour dataset. We analyse normal crypts that were distant vs adjacent to the cancer. In contrast to healthy individuals, normal crypts of colon cancer patients have a high incidence of pks + (polyketide synthases) E.coli (Escherichia coli) mutational and indel signatures, and this is confirmed by metagenomics. These signatures are compatible with many clonal driver mutations detected in the corresponding cancer samples, including in chromatin modifier genes, supporting their role in early tumourigenesis. These results provide evidence that pks + E.coli is a potential driver of carcinogenesis in the human gut.


Conflict of interest statement

The authors declare no competing interests.

Figures

Fig. 1
Fig. 1. Study design.
A Cancer and paired normal samples were collected from fresh colectomy specimens from 30 colorectal cancer patients. Normal colon samples (denoted as distant normal in below) are from the distant epithelium which are several centimetres away from tumour lesions, the normals in cancer (marked as adjacent normal) are the normal crypts isolated from the tumour tissues. Sample naming convention is also reported. B Single glands were dissected from normal and cancer samples, and we performed Whole-genome sequencing for these samples. C We collected individual crypts from normal and cancer samples and performed qualitative morphology examination, the crypts (both adjacent normal and cancer) from different regions of cancer tissue were marked as ‘A_’,’B_’,’C_’,’D_’, while ‘E_’ are the crypts from distant normal tissues. D Oncoprint of mutations in colorectal cancer driver genes in normal crypts in our cohort (only samples containing at least one mutation in a driver gene are included). E Number of single gland samples from the 30 patients. F Mutational burden for each set of samples, the sample size of each group are showed in (E). In the boxplots of panels, hinges indicate the 25th, 50th, and 75th percentiles, whiskers indicate 1.5 × interquartile ranges, and dots indicate values of individual samples. Two-sided Mann–Whitney analysis was applied to compare groups. G dN/dS analysis for measuring selection on driver mutations.
Fig. 2
Fig. 2. Pks+ signature incidence.
A, B proportion of pks+ single base signature (SPS7, or COSMIC SBS88) in our dataset of 30 cancer patients and the comparison with normal crypts from normal people. For each patient, there were 3-11 cancer crypts. And the number of patients that we had distant and adjacent normal crypts were 10 and 17, respectively. We also split the cancer clonal (dark red bars) and subclonal (pink bars) mutations when checking the signatures. A Data are presented as bars of mean ± SEM with single data points. B Box plots consist of the box denoting the interquartile range (IQR), bound by the 25th and 75th percentiles, the median line shown within the box, and the whiskers representing the rest of the data distribution with outliers denoted by points greater than ± 1.5 x IQR. Two-sided Mann–Whitney analysis was applied to compare groups. p(EPICC Cancer Clonal vs Healthy Normal)   =   2.034e-02 (n  =  30, N  =  40), p(EPICC Distant Normal vs Healthy Normal)   =   1.010e-04 (n  =  7, N  =  40). C, D proportion of short T-del signature at T-homopolymers in EPICC cancer and normal samples. D. Mann-Whitney-Wilcoxon test two-sided, p(EPICC Cancer Clonal vs EPICC Adjacent Normal)   =   8.885e-11 (n  =  30, N  = 71), p(EPICC Cancer Clonal vs EPICC Distant Normal)   =   7.776e-05 (n  =  30, N  =  10), p(EPICC Cancer Clonal vs Healthy Normal)   =   1.805e-08 (n  =  30, N  =  40), p(EPICC Cancer Sublonal vs Healthy Normal)   =   2.489e-16 (n  =  353,N  =  30), p(EPICC Adjacent Normal vs Healthy Normal)   =   1.990e-08 (n  =  71, N  = 40), p(EPICC Distant Normal vs Healthy Normal)   =   1.413e-02 (n  =  10, N  =  40). Correlation between SPS7 and proportion of short T-dels per sample in clonal (E) with Prob (F-statistic)= 2.45e-05 and subclonal (F) mutations with Prob (F-statistic)= 1.31e-52.
Fig. 3
Fig. 3. Pks+E.coli metagenomics.
The presence of pks+ genomic reads in the sequencing data of all the EPICC cohorts. Each panel present the samples from one patient, the x labels indicate the samples from different group distinguished by the colour (orange: distant normal crypts; cyan: adjacent normal crypts; others are the cancer crypts). The y-axis is the reads counts from E.coli. The red/grey color of the bars denotes the presence/absence of clb genes as the clb genes constitute pks genomic island and encoding colibactin.
Fig. 4
Fig. 4. Contribution of different mutational signatures to cancer driver mutations.
We estimated the probability that different signatures caused non-synonymous mutations in (A) cancer driver genes detected in tumour samples, as well as mutations in (B) chromatin modifier genes (cmgs). (C) Driver gene and chromatin modifier gene alterations caused by short T-dels, likely by pks + .
Fig. 5
Fig. 5. Showcase of patient C561.
A The phylogeny of all samples for patient C561, the black labels are the independent precancerous polys lesions. B The heatmap of SNVs for C561 (C) APC driver mutations found in polyps samples matching the pks+ single base signature (polyp G) and short T-del signature motifs (polyp F).

References

    1. Fearon ER, Fearon ER, Vogelstein B, Vogelstein B. A genetic model for colorectal tumorigenesis. Cell. 1990;61:759–767. doi: 10.1016/0092-8674(90)90186-I. - DOI - PubMed
    1. Greaves M, Maley CC. Clonal evolution in cancer. Nature. 2012;481:306–313. doi: 10.1038/nature10762. - DOI - PMC - PubMed
    1. Heide T, et al. The co-evolution of the genome and epigenome in colorectal cancer. Nature. 2022;611:733–743. doi: 10.1038/s41586-022-05202-1. - DOI - PMC - PubMed
    1. Muzny DM, et al. Comprehensive molecular characterization of human colon and rectal cancer. Nature. 2012;487:330–337. doi: 10.1038/nature11252. - DOI - PMC - PubMed
    1. Cross W, et al. The evolutionary landscape of colorectal tumorigenesis. Nat. Ecol. Evol. 2018;2:1661–1672. doi: 10.1038/s41559-018-0642-z. - DOI - PMC - PubMed

Publication types