. 2023 Nov 30;13(1):175.
doi: 10.1038/s41408-023-00935-2.

Gene interaction network analysis in multiple myeloma detects complex immune dysregulation associated with shorter survival

Affiliations

Gene interaction network analysis in multiple myeloma detects complex immune dysregulation associated with shorter survival

Anish K Simhal et al. Blood Cancer J. .

Abstract

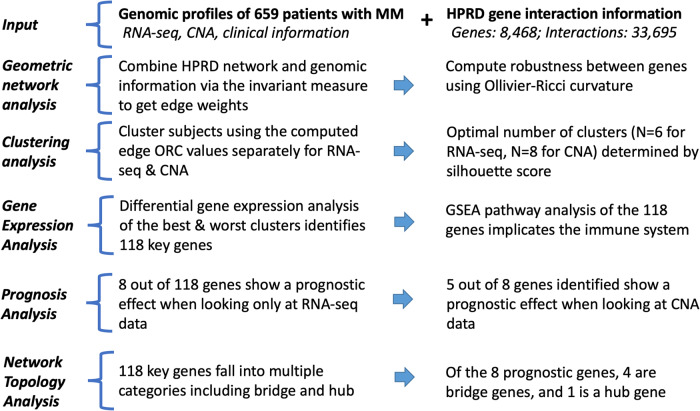
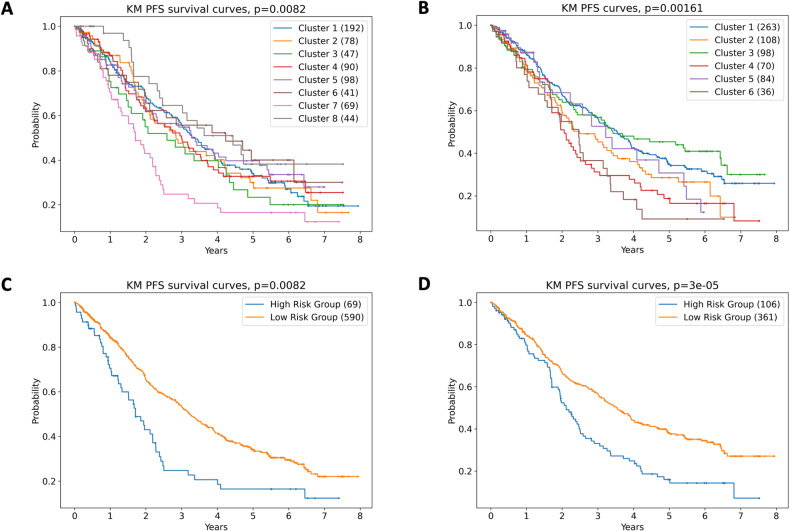
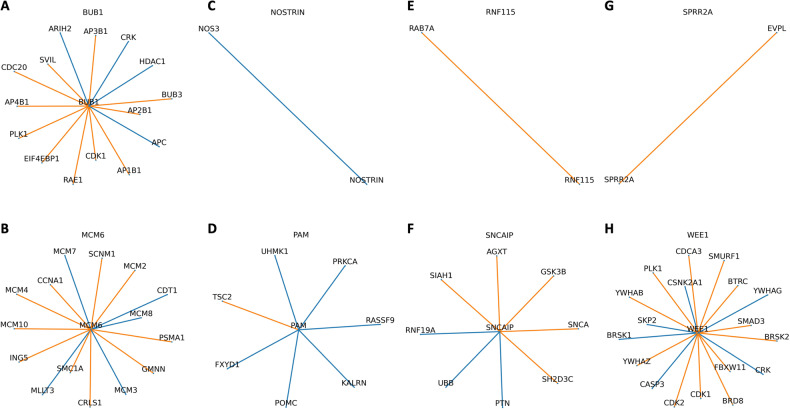
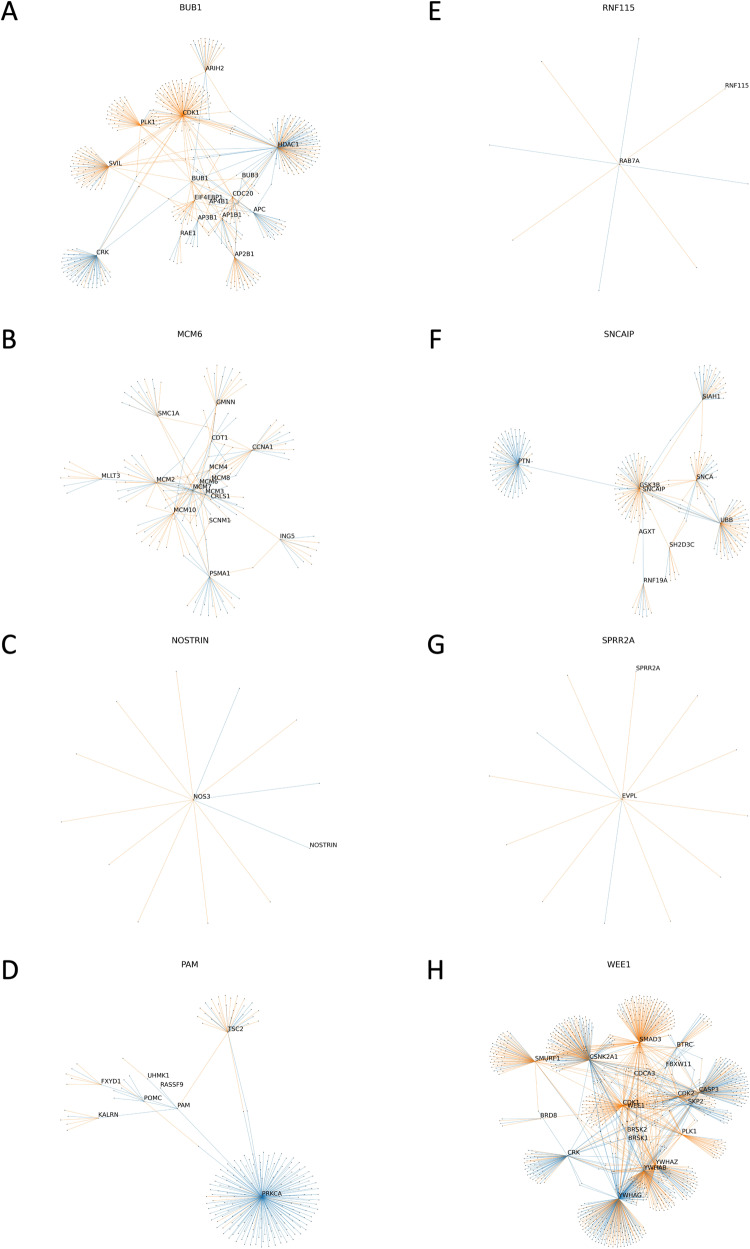
The plasma cell cancer multiple myeloma (MM) varies significantly in genomic characteristics, response to therapy, and long-term prognosis. To investigate global interactions in MM, we combined a known protein interaction network with a large clinically annotated MM dataset. We hypothesized that an unbiased network analysis method based on large-scale similarities in gene expression, copy number aberration, and protein interactions may provide novel biological insights. Applying a novel measure of network robustness, Ollivier-Ricci Curvature, we examined patterns in the RNA-Seq gene expression and CNA data and how they relate to clinical outcomes. Hierarchical clustering using ORC differentiated high-risk subtypes with low progression free survival. Differential gene expression analysis defined 118 genes with significantly aberrant expression. These genes, while not previously associated with MM, were associated with DNA repair, apoptosis, and the immune system. Univariate analysis identified 8/118 to be prognostic genes; all associated with the immune system. A network topology analysis identified both hub and bridge genes which connect known genes of biological significance of MM. Taken together, gene interaction network analysis in MM uses a novel method of global assessment to demonstrate complex immune dysregulation associated with shorter survival.


Conflict of interest statement

SZU: Research funding: Amgen, BMS/Celgene, GSK, Janssen, Merck, Pharmacyclics, Sanofi, Seattle Genetics, Takeda. Consulting/Advisory Board: Abbvie, Amgen, BMS, Celgene, Genentech, Gilead, GSK, Janssen, Sanofi, Seattle Genetics, SecuraBio, SkylineDX, Takeda, TeneoBio.

Figures

Fig. 1
Fig. 1. Overview of the data processing pipeline.
This study uses a novel measure of network robustness, Ollivier-Ricci curvature, to examine genes associated with shorter progression free survival in multiple myeloma. RNA-Seq RNA-sequencing, HPRD Human Protein Reference Database, CNA copy number aberration, ORC Ollivier-Ricci curvature, GSEA gene set enrichment analysis.
Fig. 2
Fig. 2. Ollivier Ricci curvature on example networks.
Gray edges indicate zero curvature between nodes, blue edges indicate positive curvature, and red edges indicate negative curvature. In the center image, there are multiple paths that can be traced out between any pair of nodes; therefore, the curvature is positive. Conversely, the red edges in the right-most figure show negative curvature values since the removal of any edge would bisect the graph.
Fig. 3
Fig. 3. Hierarchical clustering using Ollivier Ricci Curvature (ORC) predicts progression-free survival (PFS) in multiple myeloma.
Kaplan–Meier analysis of PFS based on ORC according to (A) copy number aberration, and (B) RNA sequencing. To better understand the differences between the high risk and low risk cohorts, clusters with similar outcomes were grouped. C For CNA based clustering, clusters 1–6 and 8 were combined into the low-risk group. Cluster 7 was the high-risk group. D For RNA-sequencing data, clusters 4 and 6 were combined into a high-risk group. Clusters 1 and 3 were combined into a low-risk group.
Fig. 4
Fig. 4. Local neighborhood of selected genes relevant to MM biology and the immune system.
Each line or edge represents the interaction between a gene-pair in a network, comparing the median interactions observed in the high-risk group compared with those in the low-risk group. Blue edges indicate that the connections are more robust in the high-risk group, while orange edges are more fragile, risk being defined by the RNA-Seq-based clustering analysis. A: TP53, B: ATM, C: CCND1, D: MYC, E: IL6, F: IFNGR1, G: TNFRSF17, H: CD38, I: IKZF3. Higher resolution images are available at www.github.com/aksimhal/mm-orc-subtypes.
Fig. 5
Fig. 5. Local neighborhood of the eight genes identified as being predictive of PFS.
Each line or edge represents the interaction between a gene-pair in a network, comparing the median interactions observed in the high-risk group compared with those in the low-risk group. Blue edges indicate that the connections are more robust in the high-risk group, while orange edges are more fragile, risk being defined by the RNA-Seq-based clustering analysis. A: BUB1, B: MCM6, C: NOSTRIN, D: PAM, E: RNF115, F: SNCAIP, G:SPRR2A, H: WEE1. Higher resolution images are available at www.github.com/aksimhal/mm-orc-subtypes.
Fig. 6
Fig. 6. ‘Two-hop’ neighborhood of the eight genes identified as being predictive of PFS.
Each line or edge represents the interaction between a gene-pair in a network, comparing the median interactions observed in the high-risk group compared with those in the low-risk group. Blue edges indicate that the connections are more robust in the high-risk group, while orange edges are more fragile, risk being defined by the RNA-Seq-based clustering analysis. A: BUB1, B: MCM6, C: NOSTRIN, D: PAM, E: RNF115, F: SNCAIP, G: SPRR2A, H: WEE1. Higher resolution images are available at www.github.com/aksimhal/mm-orc-subtypes.

References

    1. Morgan GJ, Walker BA, Davies FE. The genetic architecture of multiple myeloma. Nat Rev Cancer. 2012;12:335–48. doi: 10.1038/nrc3257. - DOI - PubMed
    1. Hu Y, Chen W, Wang J. Progress in the identification of gene mutations involved in multiple myeloma. Onco Targets Ther. 2019;12:4075–80. doi: 10.2147/OTT.S205922. - DOI - PMC - PubMed
    1. Palumbo A, Avet-Loiseau H, Oliva S, Lokhorst HM, Goldschmidt H, Rosinol L, et al. Revised international staging system for multiple myeloma: a report from international myeloma working group. J Clin Oncol. 2015;33:2863–9. doi: 10.1200/JCO.2015.61.2267. - DOI - PMC - PubMed
    1. D’Agostino M, Cairns DA, Lahuerta JJ, Wester R, Bertsch U, Waage A, et al. Second revision of the International Staging System (R2-ISS) for overall survival in multiple myeloma: a European Myeloma Network (EMN) report within the HARMONY project. J Clin Oncol. 2022;40:3406–18. doi: 10.1200/JCO.21.02614. - DOI - PubMed
    1. Zhan F, Huang Y, Colla S, Stewart JP, Hanamura I, Gupta S, et al. The molecular classification of multiple myeloma. Blood. 2006;108:2020–8. doi: 10.1182/blood-2005-11-013458. - DOI - PMC - PubMed

Publication types