. 2023 Nov 29;14(1):7825.
doi: 10.1038/s41467-023-43381-1.

PD-1- CD45RA+ effector-memory CD8 T cells and CXCL10+ macrophages are associated with response to atezolizumab plus bevacizumab in advanced hepatocellular carcinoma

Affiliations

PD-1- CD45RA+ effector-memory CD8 T cells and CXCL10+ macrophages are associated with response to atezolizumab plus bevacizumab in advanced hepatocellular carcinoma

Sarah Cappuyns et al. Nat Commun. .

Abstract

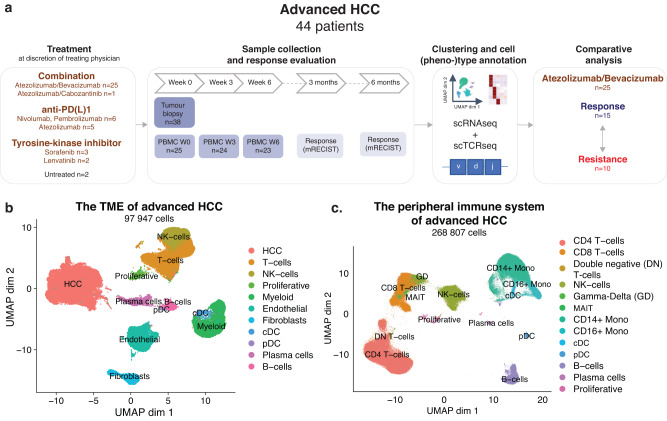
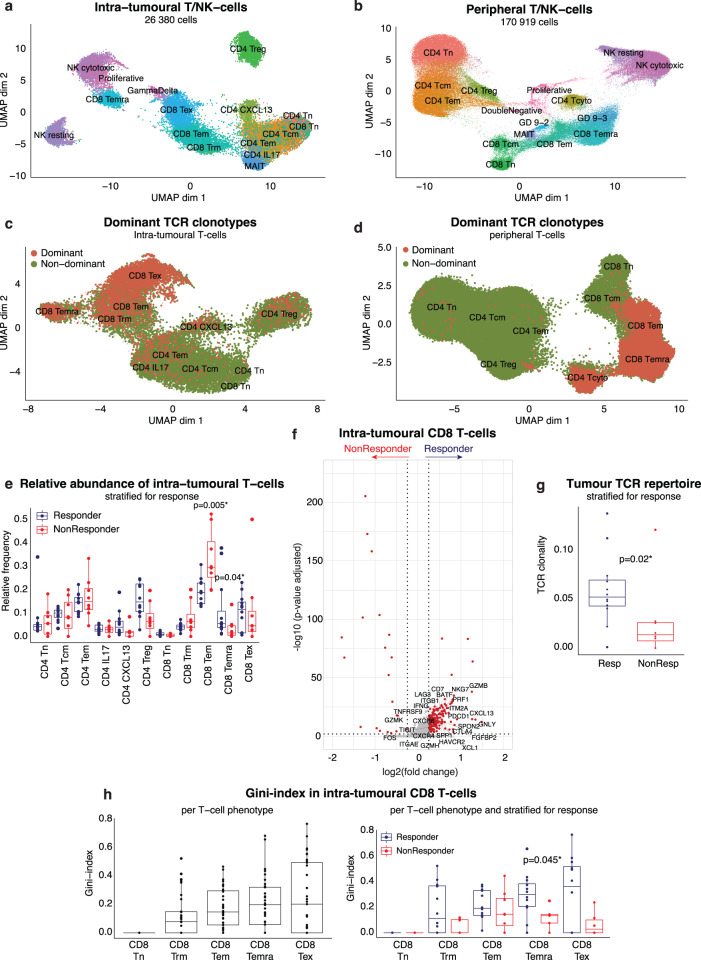
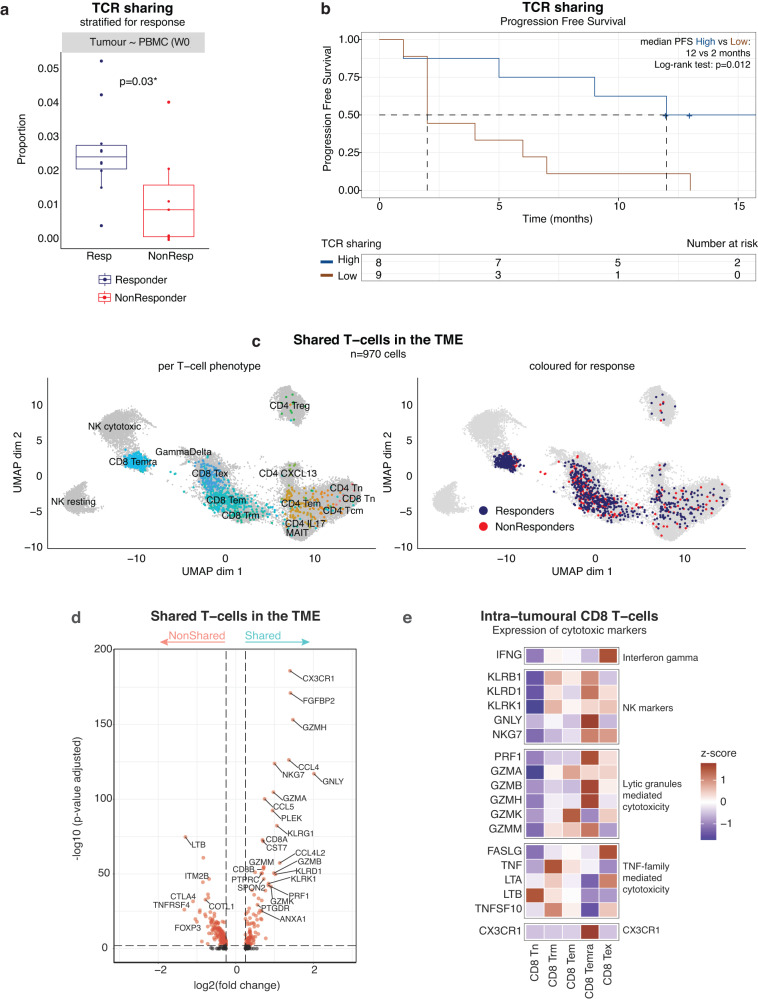
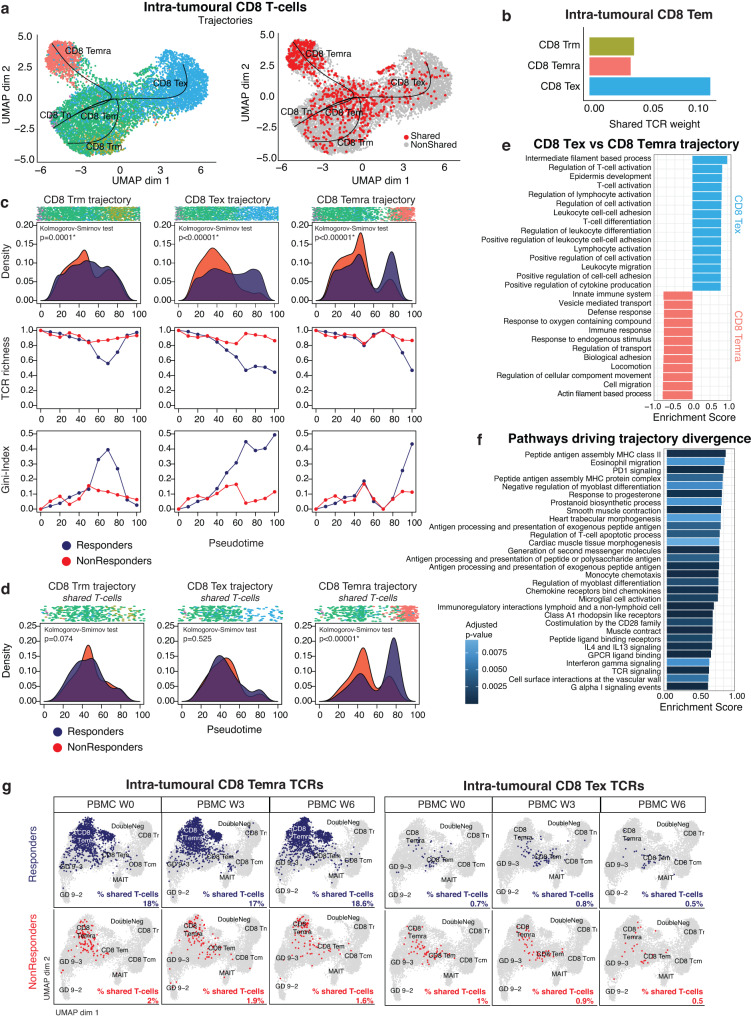
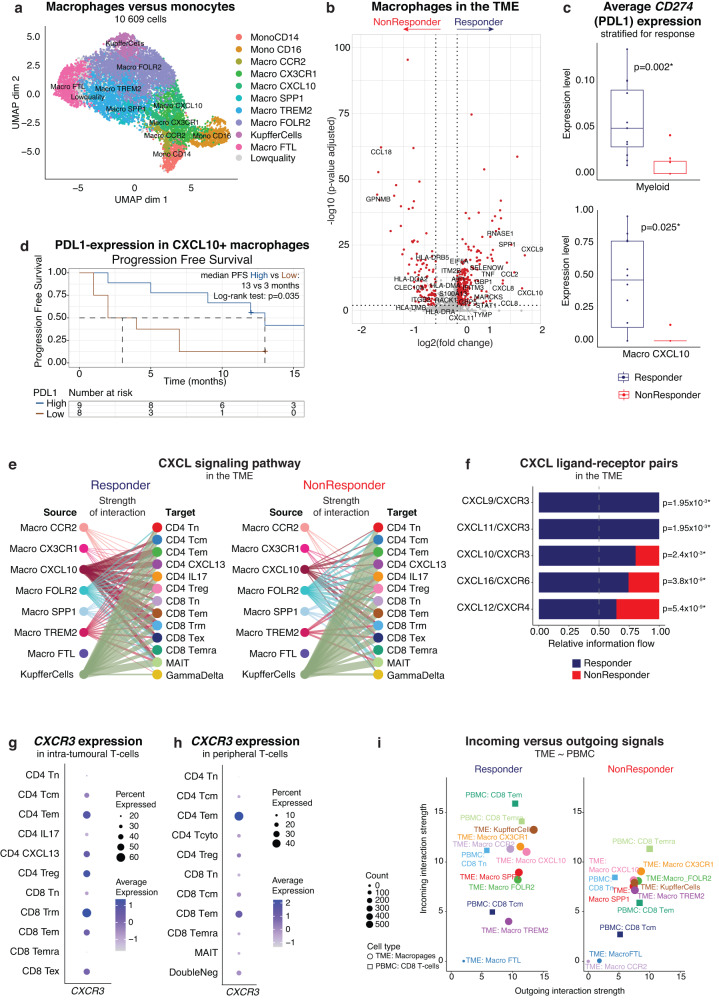
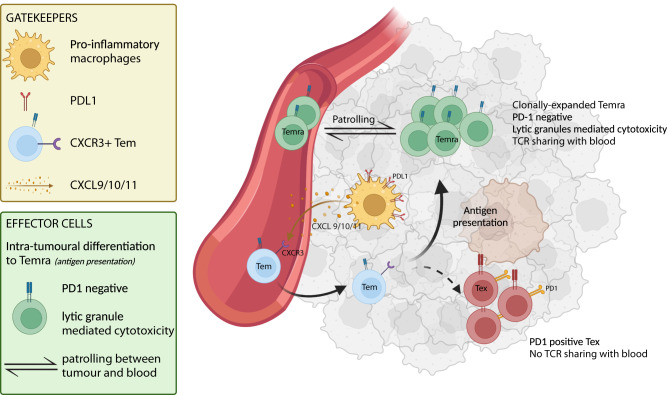
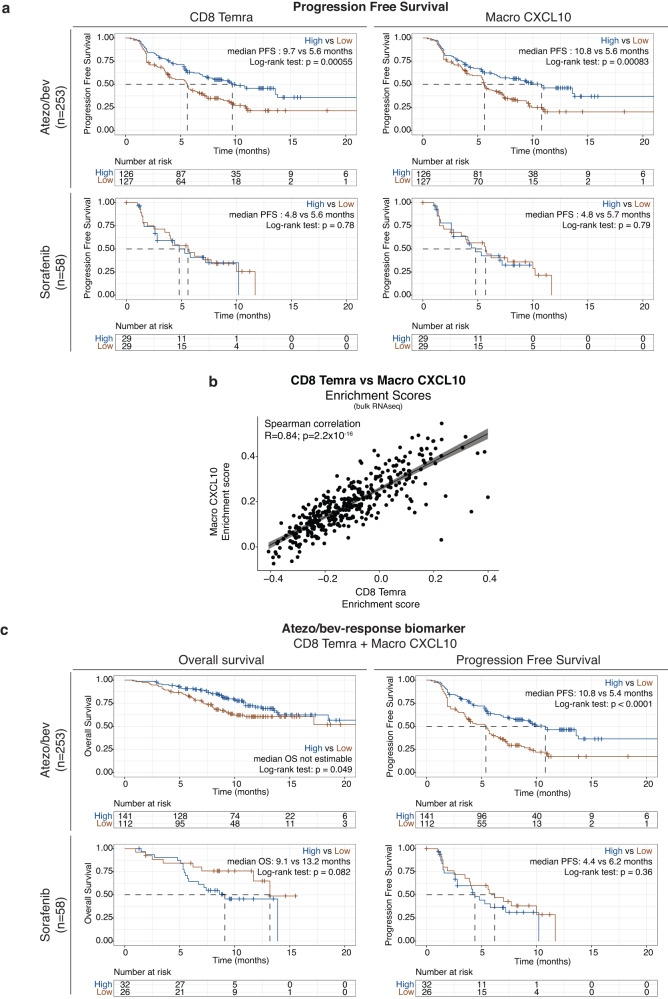
The combination of atezolizumab plus bevacizumab (atezo/bev) has dramatically changed the treatment landscape of advanced HCC (aHCC), achieving durable responses in some patients. Using single-cell transcriptomics, we characterize the intra-tumoural and peripheral immune context of patients with aHCC treated with atezo/bev. Tumours from patients with durable responses are enriched for PDL1+ CXCL10+ macrophages and, based on cell-cell interaction analysis, express high levels of CXCL9/10/11 and are predicted to attract peripheral CXCR3+ CD8+ effector-memory T cells (CD8 TEM) into the tumour. Based on T cell receptor sharing and pseudotime trajectory analysis, we propose that CD8 TEM preferentially differentiate into clonally-expanded PD1- CD45RA+ effector-memory CD8+ T cells (CD8 TEMRA) with pronounced cytotoxicity. In contrast, in non-responders, CD8 TEM remain frozen in their effector-memory state. Finally, in responders, CD8 TEMRA display a high degree of T cell receptor sharing with blood, consistent with their patrolling activity. These findings may help understand the possible mechanisms underlying response to atezo/bev in aHCC.


Conflict of interest statement

The authors declare no competing interests.

Figures

Fig. 1
Fig. 1. The tumour-microenvironment and peripheral immune system of advanced HCC.
a. Study design, patient and sample overview. b. UMAP depicting cell types identified in pre-treatment TME of advanced HCC (n = 38 tumour biopsies). c. UMAP representation of cell types identified in blood  (n = 72 PBMC samples). (cDC, conventional dendritic cells; pDC, plasmacytoid dendritic cells; DN T cells, Double negative T cells; GD T cells, Gamma-delta T cells; HCC, hepatocellular carcinoma; PD1, Programmed cell death protein 1; PDL1, Programmed death-ligand 1; scRNAseq, single-cell RNA sequencing; scTCRseq, single-cell T cell receptor sequencing; TME, tumour-microenvironment; UMAP, Uniform Manifold Approximation and Projection).
Fig. 2
Fig. 2. Clonally-expanded CD8 TEMRA are associated with response to atezolizumab/bevacizumab.
a. UMAP representation depicting intra-tumoural T/NK-cell phenotypes (n = 38 tumour biopsies). b. UMAP representation of peripheral T/NK-cell phenotypes(n = 72 PBMC samples). c. UMAP representation of dominant versus non-dominant clonotypes in intra-tumoural T cells (n = 38 tumour biopsies). Dominant clonotypes were defined as TCR sequences shared by >5 T cells. d. UMAP representation of dominant versus non-dominant clonotypes in peripheral T cells (n = 72 PBMC samples). Dominant clonotypes were defined as TCR sequences shared by >5 T cells. e. Boxplots depicting relative abundance of intra-tumoural T-/NK-cell phenotypes in atezo/bev-treated patients (n = 20), calculated per patient and stratified for response (12 Resp versus 8 NonResp). P-values calculated using two-sided Mann-Whitney U-test, only p-values < 0.05 are shown. Boxes indicate median +/- interquartile range; whiskers show minima and maxima. f. Volcano plot depicting differentially expressed genes in intra-tumoural CD8 T cells (n = 4313) from responders (n = 12; 3425 CD8 T cells) versus non-responders (n = 8; 888 CD8 T cells). P-values were obtained using the two-sided Wilcoxon test and Bonferroni-corrected (Seurat 4). Red: adjusted p-value < 0.01 and log2 fold change >0.25. g. TCR clonality of intra-tumoural T cells in atezo/bev-treated patients (n = 20), calculated per patient and stratified for response (12 Resp versus 8 NonResp). P-value calculated using Mann-Whitney U-test. Boxes indicate median +/- interquartile range; whiskers show minima and maxima. h. Gini-index of intra-tumoural CD8 T cells. Left: calculated per patient (n = 37), per CD8 T cell phenotype. Right: in atezo/bev-treated patients (n = 20), calculated per patient and stratified for response (12 Resp versus 8 NonResp). P-values calculated using two-sided Mann-Whitney U-test, only p-values < 0.05 are shown. Boxes indicate median +/- interquartile range; whiskers show minima and maxima. (GD, γδ T cells; TCR, T cell receptor; UMAP, Uniform Manifold Approximation and Projection; Resp, responder; NonResp, non-responder).
Fig. 3
Fig. 3. TCR sharing confirms CD8 TEMRA as crucial effector T cells in the TME of aHCC.
a. Proportion of TCRs shared between tumour and blood prior to treatment (PBMC week 0), relative to the total number of TCRs detected, calculated per sample (n = 17) and stratified for response (10 Resp versus 7 NonResp). P-values calculated using two-sided Mann-Whitney U-test. Boxes indicate median +/- interquartile range; whiskers show minima and maxima. b. Kaplan-Meier plot of progression free survival in atezo/bev-treated patients (n = 17; 10 Resp versus 7 NonResp) with high or low (split by median) TCR sharing between tumour and blood. c. UMAP representation of T cells characterized by a TCR shared between tumour and blood prior to treatment (n = 970 T cells). Left: coloured per T cell phenotype. Right: coloured for response to atezo/bev. d. Volcano plot depicting differentially expressed genes in shared (i.e. intra-tumoural T cells characterized by a TCR found in PBMC week 0; n = 970 T cells) versus non-shared T cells in the TME. P-values were obtained using the two-sided Wilcoxon test and Bonferroni-corrected (Seurat 4). Red: adjusted p-value < 0.01 and log2 fold change >0.25. e. Heatmaps showing expression of cytotoxic genes in intra-tumoural CD8 T cells. (PFS, Progression free survival; Resp, responder; NonResp, non-responder; TCR, T cell receptor; TME, tumour-microenvironment; UMAP, Uniform Manifold Approximation and Projection).
Fig. 4
Fig. 4. Interaction with tumour-antigens drives intra-tumoural differentiation towards CD8 TEMRA.
a. UMAP representation of intra-tumoural CD8 T cells (n = 8989). Left: depicting three distinct trajectories: CD8 TRM, CD8 TEX and CD8 TEMRA. Right: depicting shared T cells (i.e. intra-tumoural T cells characterized by a TCR found in PBMC week 0) versus non-shared T cells. b. Bar plot showing the shared TCR weight for CD8 TEM with other CD8 phenotypes in the TME. c. T cell density, TCR richness and Gini-index along each CD8 trajectory in atezo/bev-treated patients (n = 20), stratified for response (12 Resp versus 8 NonResp). The density plots reflect the relative number of T cells separately for Resp versus NonResp along each CD8 trajectory. P-values reflect the difference in distributions, calculated using the two-sided Kolmogorov-Smirnov test. d. Density of shared T cells along each CD8 trajectory in atezo/bev-treated patients (n = 17) stratified for response (10 Resp versus 7 NonResp). The density plots reflect the relative number of shared T cells separately for Resp versus NonResp along each CD8 trajectory. Shared intra-tumoural T cells are characterized by a TCR found in peripheral blood prior to treatment. P-values reflect the difference in distributions, calculated using the two-sided Kolmogorov-Smirnov test. e. Top 15 pathways identified using fGSEA on differentially expressed genes along CD8 TEX versus CD8 TEMRA trajectory (using diffEnd test; TradeSeq) for the REACTOME and GO: Biological processes gene sets. Significantly enriched pathways (adjusted p-value < 0.01) were identified and ranked based on enrichment score for each gene set separately. Only the top 15 pathways of each gene set, enriched in each trajectory were retained. f. Top pathways identified using fGSEA on differentially expressed genes identified at the point where the three trajectories diverge (using earlyDEG test; TradeSeq) for the REACTOME and GO: Biological processes gene sets. Adjusted p-value calculated using the Benjamini-Hochberg method. g. UMAP representation of peripheral T cells at week 0 (W0), week 3 (W3) and week 6 (W6) characterized by a TCR shared with CD8 TEMRA (left) and CD8 TEX (right) in the pre-treatment TME, stratified for response to atezo/bev (top: Resp (n = 10), bottom: NonResp (n = 17)). (PBMC, peripheral blood mononuclear cells; TCR, T cell receptor; TME, tumour microenvironment; UMAP, Uniform Manifold Approximation and Projection; Resp, responder; NonResp, non-responder).
Fig. 5
Fig. 5. Pro-inflammatory PDL1-expressing CXCL10+ macrophages recruit effector-memory T cells into the TME.
a. UMAP representation of monocyte and macrophage phenotypes in the TME. b. Volcano plot of differentially expressed genes in macrophages (n = 9233) in the TME of responders (n = 12) versus non-responders (n = 8). P-values were obtained using the two-sided Wilcoxon test and Bonferroni-corrected (Seurat 4). Red: adjusted p-value < 0.01 and log2 fold change >0.25. c. Boxplots depicting average CD274 (PDL1) expression level in the TME of atezo/bev-treated patients, calculated per patient in myeloid cells (top; n = 20; 12 Resp versus 8 NonResp) and CXCL10+ macrophages (Macro CXCL10, bottom; n = 17; 12 Resp versus 5 NonResp), stratified for response. P-values calculated using two-sided Mann-Whitney U-test. Boxes indicate median +/- interquartile range; whiskers show minima and maxima. d. Kaplan-Meier plot of progression free survival in atezo/bev-treated patients (n = 17) with high or low (split by median) PDL1-expression in CXCL10+ macrophages. e. Hierarchy plot of the CXCL signalling pathway in the TME, depicting cell-cell interactions between intra-tumoural macrophages (source) and intra-tumoural T cells (target cells) in responders (left) and non-responders (right). The width of edges represents the strength of communication. f. Bar plot depicting the overall information flow for each ligand-receptor pair of the CXCL signalling pathway in the TME of responders versus non-responders. Overall information flow is defined by the sum of the communication probability among all pairs of cell groups in the inferred network. P-value calculated using two-sided Wilcoxon test. g. Dot plot of CXCR3 expression in intra-tumoural T cells. h. Dot plot of CXCR3 expression in peripheral T cells. i. Scatterplot depicting the dominant senders (sources) and receivers (targets) between intra-tumoural macrophage phenotypes and peripheral CD8 T cells. X- and y-axis represent the total outgoing or incoming communication probability associated with each cell group. Symbol size is proportional to the number of inferred links (both outgoing and incoming) associated with each cell group. (PBMC, peripheral blood mononuclear cells; PDL1, Programmed death-ligand 1; TME, tumour-microenvironment; UMAP, Uniform Manifold Approximation and Projection).
Fig. 6
Fig. 6. CD8 TEMRA and Macro CXCL10 play an essential role in response to atezolizumab/bevacizumab in advanced HCC.
Graphical representation of CD8 TEMRA and Macro CXCL10 in the TME of advanced HCC and their potential role in facilitating response to atezo/bev. (PD1, Programmed cell death protein 1; PDL1, Programmed death-ligand 1; TCR, T cell receptor; TME, tumour-microenvironment). Created using Biorender.com.
Fig. 7
Fig. 7. CD8 TEMRA and Macro CXCL10 as predictive biomarkers of response to atezolizumab/bevacizumab.
a. Kaplan-Meier plots of progression free survival in 253 atezo/bev-treated (top) versus 58 sorafenib-treated advanced HCC patients (bottom) with high versus low (split by median) CD8 TEMRA (left) or Macro CXCL10 (right) enrichment score, calculated per sample in bulk RNA-sequencing data. P-values calculated using the log-rank test. Median progression free survival as indicated. b. Scatter plot depicting the correlation between CD8 TEMRA and Macro CXCL10 enrichment scores, calculated per sample in bulk RNA-sequencing data of 311 advanced HCC patients. P values calculated using  two-sided Spearman’s rank correlation test. R-values are Spearman’s rank correlation coefficients (rho). Error bands represent the 95% confidence interval. c. Kaplan-Meier plots of overall survival (left) and progression free survival (right) in 253 atezo/bev-treated (top) versus 58 sorafenib-treated advanced HCC patients (bottom) with high versus low atezo/bev-response biomarker enrichment score (using optimal cut-off determined by maximally selected rank statistics, see Methods for details), calculated per sample in bulk RNA-sequencing data. (Atezo/bev, atezolizumab plus bevacizumab; PFS, Progression free survival).

References

    1. Sung H, et al. Global Cancer Statistics 2020: GLOBOCAN estimates of incidence and mortality worldwide for 36 cancers in 185 countries. CA Cancer J. Clin. 2021;71:209–249. doi: 10.3322/caac.21660. - DOI - PubMed
    1. Llovet JM, et al. Hepatocellular carcinoma. Nat. Rev. Dis. Prim. 2021;7:6. doi: 10.1038/s41572-020-00240-3. - DOI - PubMed
    1. Finn RS, et al. Atezolizumab plus bevacizumab in unresectable hepatocellular carcinoma. N. Engl. J. Med. 2020;382:1894–1905. doi: 10.1056/NEJMoa1915745. - DOI - PubMed
    1. Cheng AL, et al. Updated efficacy and safety data from IMbrave150: Atezolizumab plus bevacizumab vs. sorafenib for unresectable hepatocellular carcinoma. J. Hepatol. 2022;76:862–873. doi: 10.1016/j.jhep.2021.11.030. - DOI - PubMed
    1. Llovet JM, et al. Sorafenib in advanced hepatocellular carcinoma. N. Engl. J. Med. 2008;359:378–390. doi: 10.1056/NEJMoa0708857. - DOI - PubMed

Publication types