. 2023 Nov 29;14(1):7834.
doi: 10.1038/s41467-023-43677-2.

Mechanisms of synthetic lethality between BRCA1/2 and 53BP1 deficiencies and DNA polymerase theta targeting

Affiliations

Mechanisms of synthetic lethality between BRCA1/2 and 53BP1 deficiencies and DNA polymerase theta targeting

George E Ronson et al. Nat Commun. .

Abstract

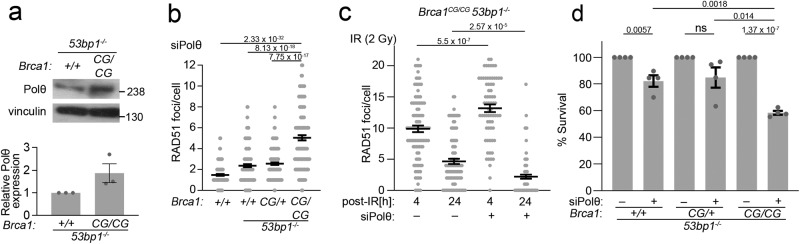
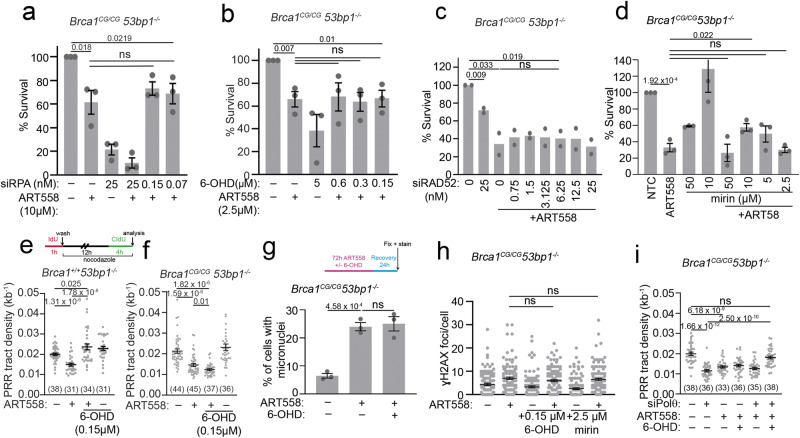
A synthetic lethal relationship exists between disruption of polymerase theta (Polθ), and loss of either 53BP1 or homologous recombination (HR) proteins, including BRCA1; however, the mechanistic basis of these observations are unclear. Here we reveal two distinct mechanisms of Polθ synthetic lethality, identifying dual influences of 1) whether Polθ is lost or inhibited, and 2) the underlying susceptible genotype. Firstly, we find that the sensitivity of BRCA1/2- and 53BP1-deficient cells to Polθ loss, and 53BP1-deficient cells to Polθ inhibition (ART558) requires RAD52, and appropriate reduction of RAD52 can ameliorate these phenotypes. We show that in the absence of Polθ, RAD52 accumulations suppress ssDNA gap-filling in G2/M and encourage MRE11 nuclease accumulation. In contrast, the survival of BRCA1-deficient cells treated with Polθ inhibitor are not restored by RAD52 suppression, and ssDNA gap-filling is prevented by the chemically inhibited polymerase itself. These data define an additional role for Polθ, reveal the mechanism underlying synthetic lethality between 53BP1, BRCA1/2 and Polθ loss, and indicate genotype-dependent Polθ inhibitor mechanisms.


Conflict of interest statement

The authors declare no competing interests.

Figures

Fig. 1
Fig. 1. Brca1C61G/C61G53bp1−/− cells rely on non-canonical support mechanisms for RAD51 foci, HR and survival.
a BRCA1 (red) and BARD1 (green), with yellow showing co-location, in the MEF genotypes shown (all are 53bp1−/−) fixed 3 h after exposure to 2 Gy irradiation (IR). b Quantification of RAD51 foci 3 hours after 2 Gy IR exposure with non-targeting control (NTC) siRNA (−) or BRCA1 siRNA (+). n = 150 cells from 3 biological replicates. c Colony survival following 16 h olaparib in MEFs of the indicated genotypes, or with BRCA1 siRNA, n = 3 biological replicates. d Quantification of HR-specific PCR product. n = 3 biological replicates. e Colony survival after treatment with NTC siRNA (−) or RNF168 siRNA (+). n = 4 biological repeats. f Quantification of RAD51 foci 3 h after 2 Gy IR exposure, of the genotypes shown (all are 53bp1−/−), following treatment with NTC siRNA (−) or siRNA to RNF168, RADX or both (+). n = 150 cells from 3 biological replicates, per condition. g Colony survival of MEFs treated with NTC siRNA (−) or siRNA to RNF168, RADX or both (+). n = 4 biological repeats. h Colony survival of MEFs treated with the RAD52 inhibitor 6-Hydroxy-DL-DOPA (6-OHD). n = 4 biological repeats. i Quantification of RAD51 foci 3 h after 2 Gy IR exposure, in EdU-positive MEFs, treated with NTC siRNA (−) or siRNA to RAD52, RADX or both (+). n = 150 cells from 3 biological replicates, per condition. j Colony survival in MEFs treated with NTC siRNA (−) or siRNA to RAD52, RADX or both (+), n = 3 biological repeats. k Relative PCR product intensity of HR-specific product in Brca1C61G/C61G 53bp1−/− cells treated with NTC siRNA (−) or siRNA to RAD52, RNF168 and BRCA1. n = 5 biological replicates. In all cases, data shown are mean ± SEM. All statistical analysis in this figure was performed using a two-tailed Student’s t Test, without adjustment for multiple comparisons. Source data are provided as a Source Data file.
Fig. 2
Fig. 2. Brca1C61G/C61G53bp1−/− cells are sensitive to Polθ depletion.
a Western blot of Polθ and quantification of protein levels, n = 3 biological replicates. Data are mean ± SEM. b Quantification of RAD51 foci, treated with siRNA to Polθ. n = 100 cells from 2 biological replicates per condition. c Quantification of RAD51 foci 4 and 24 h after 2 Gy IR exposure, in MEFs treated with NTC siRNA (−) or siRNA targeting Polθ (+). n = 100 cells from 2 biological replicates, per condition. d Colony survival in MEFs treated with NTC siRNA (−) or siRNA targeting Polθ (+). n = 4 biological replicates. In all cases, data shown are mean ± SEM. All statistical analysis in this figure was performed using a two-tailed Student’s t Test, without adjustment for multiple comparisons. Source data are provided as a Source Data file.
Fig. 3
Fig. 3. Polθ suppresses RAD52-mediated toxicity.
a RNF168 foci, b FLAG-RAD52 foci in asynchronous cells with control (−) or Polθ (+) siRNA. n = 120 cells from 3 biological replicates. c RAD52 and γH2AX foci in asynchronous Brca1C61G/C61G 53bp1−/− cells treated with control or Polθ siRNA. Scale bars represent 10 µm. d % γH2AX foci colocalised with RAD52 foci in asynchronous cells treated with control (−) or Polθ (+) siRNA. n = 80 cells from 2 biological replicates. e Colony survival of MEFs treated with Polθ, or control siRNA (−), and RAD52 siRNA. n = 4 biological replicates. f RAD51 foci in MEFs treated with IR (2 Gy) and Polθ siRNA, control (−) and RAD52 siRNA, fixed after 3 h. n = 150 cells from 3 biological replicates. g RAD52 western blot after 8 nM siRNA in Brca1C61G/C61G 53bp1−/− cells. Quantification relative RAD52 in control-treated cells, n = 2 biological replicates. h Colony survival of MEFs treated with NTC or Polθ siRNA and RAD52 inhibitor 6-OHD or vehicle (−). n = 3 biological replicates. i RAD51 foci in IR (2 Gy) -treated MEFs with RAD52 inhibitor 6-OHD or vehicle (−), fixed 3 h after exposure. n = 150 cells from 3 biological replicates. j Survival of CAL51 cells treated with Polθ, BRCA1 siRNA or both, and RAD52 inhibitor 6-OHD or vehicle (−). n = 3 biological replicates. k Quantification of FLAG-RAD52 foci in cells treated with Polθ (+), or control siRNA (−) and 0.15 μM 6-OHD or vehicle. n = 100 cells from 3 biological replicates. l Number of breaks or gaps per metaphase spread, from cells treated with control (−) or Polθ (+) siRNA and RAD52 inhibitor. n ≥ 80 metaphases from 3 biological repeats. Data are mean ± SEM. m Micronuclei after treatment with Polθ, or control siRNA (siNTC) with and without RAD52 inhibitor 6-OHD. n = 600 cells from 2 biological replicates. In all cases, Data shown are mean ± SEM. All statistical analysis in this figure was performed using a two-tailed Student’s t Test, without adjustment for multiple comparisons. Source data are provided as a Source Data file.
Fig. 4
Fig. 4. RPA:RAD52:MRE11 suppression reduces the toxicity of Polθ depletion.
a Survival after control, Polθ siRNA, or Polθ siRNA with RPA siRNA. n = 3 biological replicates. b FLAG-RAD52 foci after control or Polθ siRNA with and without RPA siRNA. n = 100 cells from 2 biological replicates, per condition. c Breaks and gaps / metaphase after control (−) or Polθ (+) siRNA with or without RPA siRNA. N ≥60 metaphases from 3 biological replicates. d Survival of cells infected with empty (−), WT-RAD52 and aa 254–286 deleted RAD52 mutant retroviruses each resistant to RAD52 siRNA, treated with Polθ siRNA and 8 nM RAD52 (+) or control siRNA (−). n = 4 biological repeats. e Survival after Polθ siRNA and MRE11 inhibitor, mirin. n = 3 biological repeats. f FLAG-RAD52 foci after treatment with vehicle or 2.5 μM mirin. n = 3 biological repeats. g Proximity-linked ligation assay foci (PLA) between MRE11 and BrdU, treated with indicated siRNA and/or inhibitors for 72 h and with 10 µM BrdU 48 h before fixation. n = 100 cells from 2 biological replicates. h IdU:CIdU ratios from MEFS treated with Polθ siRNA, and/or RAD52 inhibitor, 6-OHD and hydroxyurea (5 mM, 3 h). n > 350 fibres from 3 replicates. i Native BrdU tracts after control or Polθ siRNA and 0.15 µM RAD52 inhibitor 6-OHD and/or 5 µM mirin for 72 h. n ≥ 1400 tracks from 3 biological replicates. j PRR assay of MEFs with Polθ or BRCA1 siRNA and Polθ siRNA with and without RAD52 inhibitor, 6-OHD. n > 25 from 3 biological replicates. k PRR assay of CAL51 with Polθ or BRCA1 siRNA and Polθ siRNA with and without RAD52 inhibitor, 6-OHD. n > 25 from 3 biological replicates. l γH2AX foci after treatment with Polθ siRNA and RAD52 inhibitor 6-OHD or MRE11 inhibitor, mirin. n = 100 cells from 2 biological repeats. For ag and jl, data shown are mean ± SEM. For h and l, data shown are median. Statistical analysis in ag and jl was performed using a two-tailed Student’s t-Test, without adjustment for multiple comparisons. Statistical analysis in h and i was performed using a Mann–Whitney test. Source data are provided as a Source Data file.
Fig. 5
Fig. 5. The sensitivity of Brca1C61G/C61G53bp1−/− cells to ART558 Polθ inhibition cannot be overcome by RPA:RAD52:MRE11 suppression.
a Survival following Polθ inhibitor ART558 (10 µM) and RPA siRNA. n = 4 biological replicates. b Survival following Polθ inhibitor ART558 (10 µM) and RAD52 inhibitor 6-OHD. n = 4 biological replicates. c Survival after Polθ inhibitor ART558 (10 µM) and RAD52 siRNA. n = 2 biological replicates. d Survival after 10 µM Polθ inhibitor ART558 and MRE11 inhibitor mirin. n = 3 biological replicates. e PRR density in 53bp1−/− cells after Polθ inhibitor ART558 (10 µM) and 0.15 µM RAD52 inhibitor 6-OHD. n > 30 tracks per condition from 3 biological replicates. f PRR density in Brca1C61G/C61G 53bp1−/− cells after Polθ inhibitor ART558 (10 µM) and 0.15 µM of the RAD52 inhibitor 6-OHD. N > 30 tracks per condition from 3 biological replicates. g Micronuclei in cells untreated or treated with 10 µM ART558 and 0.15 µM 6-OHD or both. n = 600 cells per condition from 3 biological replicates. h γH2AX foci in cells untreated or treated with 10 µM ART558 and 0.15 µM RAD52 inhibitor 6-OHD or 2.5 µM mirin. n = 100 from 3 biological replicates. i PRR density after Polθ inhibitor ART558 (10 µM) and 0.15 µM RAD52 inhibitor 6-OHD with and without Polθ siRNA. N > 30 tracks per condition, from 3 biological replicates. In all cases, data shown are mean ± SEM. All statistical analysis in this figure was performed using a two-tailed Student’s t Test, without adjustment for multiple comparisons. Source data are provided as a Source Data file.
Fig. 6
Fig. 6. BRCA-RAD51 interactions suppress RAD52 recruitment and Polθ dependency.
a Endogenous C61G-BRCA1 (cyan) after 2 Gy IR with BARD1 containing (magenta) or empty vector (EV). Scale bar is 10 µm. b BARD1 and BRCA1 foci following infection with BARD1 containing (BD1) or empty vector (EV) after 2 Gy IR. n = 110 from 3 biological repeats. c Relative HR PCR product after BD1 or EV retroviral infection. n = 3 biological replicates. d Survival after control, RAD52, Polθ, or Polθ and BRCA1 siRNA and BD1 or EV retroviral infection. n = 3 biological repeats. e BRCA1 foci after EV or BARD1 mutant retrovirus, mutants illustrated bellow. n = 90, across 3 biological repeats. f Survival after Polθ siRNA and retrovirus infection as in e. n = 6 biological repeats. g Western blot of cells infected with EV or retrovirus expressing RPA-70-BRCA2-Exon27 (Ex27) or RPA-70-BRCA2-BRC4 (BRC4). h Survival after transfection with NTC, Polθ or RAD52 siRNA and infection with empty retrovirus or those expressing RPA constructs as indicated (RPA consts). n = 3 biological repeats. i FLAG-RAD52 foci after WT-BARD1 or AAE-BARD1 mutant retrovirus infection and 10 µM ART558. n = 100 from 3 biological repeats. j FLAG-RAD52 foci after infection with EV or BRC4 retrovirus and 10 µM ART558. n = 90 from 3 biological repeats. k Survival after EV, BRC4 or Ex27 retrovirus infection and Polθ inhibitor ART558. n = 3 biological repeats. l S1 nuclease assay of nascent DNA after EV, WT-BARD1 (BD1) or BRC4 infection. N ≥ 260 tracks from 3 biological replicates per condition. m PRR density after EV, WT-BARD1 (BD1) or BRC4 retroviral infection and siPolθ siRNA. N ≥ 50 tracks from 3 biological replicates. n PRR density after EV or WT-BARD1 (BD1) or BRC4 and Polθ inhibitor ART558 (10 µM). n ≥ 50 tracks from 3 biological replicates. For bf, hk, m and n, data shown are mean ± SEM. For l, data shown are median. Statistical analysis in bf, hj, m and n was performed using a two-tailed Student’s t Test, without adjustment for multiple comparisons. Statistical analysis in k was performed using a two-way ANOVA. Statistical analysis in l was performed using a Mann–Whitney test. Source data are provided as a Source Data file.
Fig. 7
Fig. 7. Proposed model of synthetic lethal mechanisms of Polθ loss and inhibition with 53BP1 and BRCA1/2 deficiencies.
Illustration of the proposed mechanism for sensitivity to Polθ loss or its inhibition according to genotype. Created with BioRender.com.

References

    1. Benafif S, Hall M. An update on PARP inhibitors for the treatment of cancer. Onco. Targets Ther. 2015;8:519–528. - PMC - PubMed
    1. Mateos-Gomez PA, et al. Mammalian polymerase theta promotes alternative NHEJ and suppresses recombination. Nature. 2015;518:254–257. doi: 10.1038/nature14157. - DOI - PMC - PubMed
    1. Ceccaldi R, et al. Homologous-recombination-deficient tumours are dependent on Poltheta-mediated repair. Nature. 2015;518:258–262. doi: 10.1038/nature14184. - DOI - PMC - PubMed
    1. Feng W, et al. Genetic determinants of cellular addiction to DNA polymerase theta. Nat. Commun. 2019;10:4286. doi: 10.1038/s41467-019-12234-1. - DOI - PMC - PubMed
    1. Wyatt DW, et al. Essential roles for polymerase theta-mediated end joining in the repair of chromosome breaks. Mol. Cell. 2016;63:662–673. doi: 10.1016/j.molcel.2016.06.020. - DOI - PMC - PubMed

Publication types

MeSH terms