. 2023 Nov 29;10(1):841.
doi: 10.1038/s41597-023-02724-9.

A dynamic and collaborative database for morphogeometric information of trilobites

Affiliations

A dynamic and collaborative database for morphogeometric information of trilobites

Fernanda Serra et al. Sci Data. .

Abstract

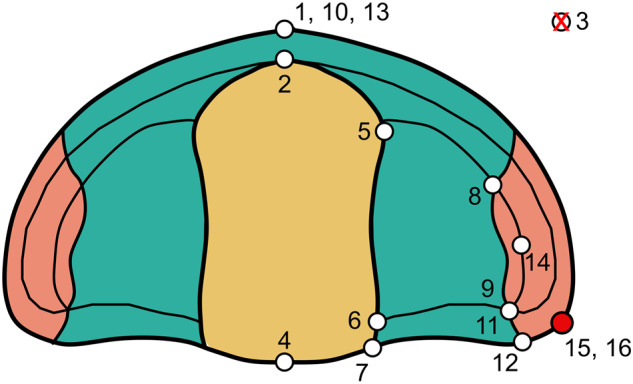
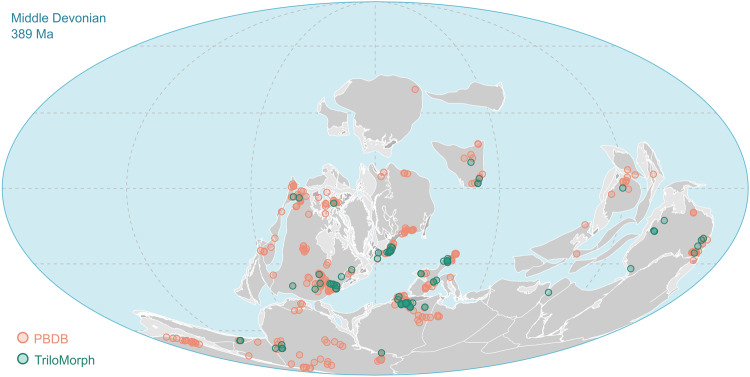
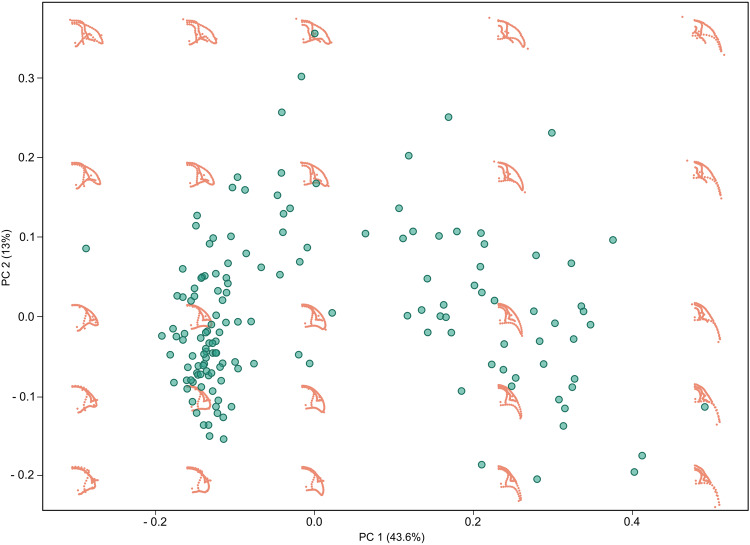
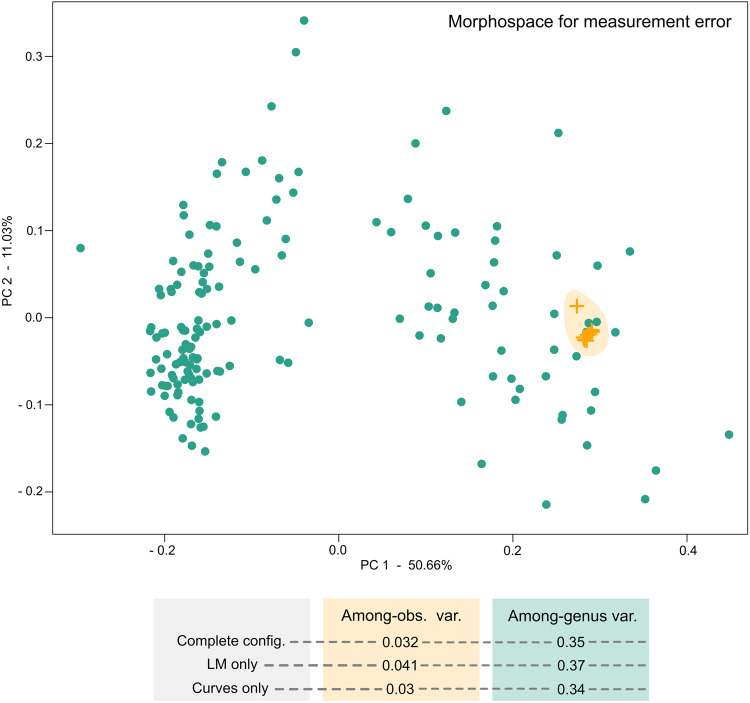
Modern morphometric-based approaches provide valuable metrics to quantify and understand macroevolutionary and macroecological patterns and processes. Here we describe TriloMorph, an openly accessible database for morpho-geometric information of trilobites, together with a landmark acquisition protocol. In addition to morphological traits, the database contains contextual data on chronostratigraphic age, geographic location, taxonomic information and lithology of landmarked specimens. In this first version, the dataset has broad taxonomic and temporal coverage and comprises more than 55% of all trilobite genera and 85% of families recorded in the Paleobiology Database through the Devonian. We provide a release of geometric morphometric data of 277 specimens linked to published references. Additionally, we established a Github repository for constant input of morphometric data by multiple contributors and present R functions that help with data retrieval and analysis. This is the first attempt of an online, dynamic and collaborative morphometric repository. By bringing this information into a single open database we enhance the possibility of performing global palaeobiological research, providing a major complement to current occurrence-based databases.


Conflict of interest statement

The authors declare no competing interests.

Figures

Fig. 1
Fig. 1
Flow diagram illustrating the main TriloMorph workflow: (1) LM protocol: the acquisition of morphological data of a specimen with unique repository code (ID) is carried out following the provided landmark protocol; after digitising, one landmark file is generated for each specimen. (2) Main table: specimen ID conforms the basic unit of entry in the main table that contains specimen-level traits and contextual characteristics (‘data.csv’). (3) PBDB + TriloMorph: taxonomic hierarchical structure and stratigraphic ranges can be obtained by merging TriloMorph data with occurrence and higher taxonomic information from the PBDB by using the accepted name from PBDB and species or genus names from TriloMorph, (4) Generalised Procrustes analysis: standardisation of landmark data. (5) Analyses: a variety of analytical tools can be used to quantify shape variation (e.g. multivariate data analysis, MANOVA, disparity measures) depending on the research goal. (6) Results: with this database and protocol it is possible to construct a morphospace to visualise patterns of shape variation in trilobites, carry out group comparative analyses or study disparity trends. A step by step explanation of the procedure and R function utilisation is given for the highlighted part (pink box) and an example on the analysis and results sections using Devonian genera from TriloMorph is provided in the R code TriloMorph-workflow. Abbreviations: LM: landmark; Taxonomic Hierarchical str.: Taxonomic Hierarchical structure; SoR: sum of ranges; SoV: sum of variances; NND: Nearest neighbour distance; PCA: principal component analysis.
Fig. 2
Fig. 2
Template of landmarks and semilandmarks curves used in the TriloMorph database illustrated on three different genera (Cyphoproetus, Harpes, and Kayserops, from the left to the right). For Harpes, absent landmarks are referred to as crosses besides the figure. Figures adapted from Gon, S.M. III, used with permission.
Fig. 3
Fig. 3
Schematic diagram of the cephalon of Ellipsocephalus, showing the alternative position of LM 15 in the template used in the geometric morphometric analysis. Figure adapted from Gon, S.M. III, used with permission.
Fig. 4
Fig. 4
Palaeogeographic map of the Eifelian Stage (Middle Devonian) indicating the geographic location of the studied collections of trilobite specimens included in the TriloMorph database (green) and location of collections from the PBDB (pink) in order to show the geographic coverage of TriloMorph. Palaeogeography is reconstructed using the PALEOMAP model in GPlates.
Fig. 5
Fig. 5
Amount of genera documented in the TriloMorph database (green) in relation to the number of trilobite genera for each Devonian stage recorded in the PBDB (yellow). Taxonomic richness was range standardised based on the Devonian occurrences recorded in the PBDB.
Fig. 6
Fig. 6
Trilobite morphospace using Devonian data from TriloMorph, virtual shapes are plotted in order to show intuitively how shape varies across morphospace. Note that our landmarking protocol is particularly sensitive to the main morphological changes described in the literature. For example, the lower right quadrant represents mostly morphological diversity among Phacopidae, towards the upper part mostly Homalonotidae, Styginidae, Calmonidae, towards the lower left quadrant morphological diversity resembles Acastidae, Odontopleuridae, Aulacopleuridae, Proetidae.
Fig. 7
Fig. 7
Morphological variability among specimens from two sources of error for morphogeometric data: within-observer (within-obs. 1, within-obs. 2), and among-observers (among-obs,), compared to among-genus variability. (a) Distribution of pairwise Procrustes distances among specimens within each group. (b) Morphospace for measurement error for specimens within each group.
Fig. 8
Fig. 8
Morphological variability among specimens considering among-genus and among-observers sources of error. Note the increase in morphological variability among-observers when slightly changing the location of a landmark that makes up for the ending point of a semilandmark curve (orange shade). Abbreviations: config.: configuration, LM: landmarks; obs.: observer, var.: variability.
Fig. 9
Fig. 9
Devonian disparity and diversity trends based on TriloMorph morphometric data (measured as the SoV) and on trilobite genera present in the PBDB and in TriloMorph respectively.
Fig. 10
Fig. 10
Morphospace for Lochkovian - Famennian trilobites using data from TriloMorph. Accentuated data points indicate morphotypes present in the respective intervals, morphotypes that are absent (x) are also indicated in order to show the total spectrum.

References

    1. Signor PW, Brett CE. The mid-Paleozoic precursor to the Mesozoic marine revolution. Paleobiology. 1984;10:229–245. doi: 10.1017/S0094837300008174. - DOI
    1. Klug C, et al. The Devonian nekton revolution: Devonian nekton revolution. Lethaia. 2010;43:465–477. doi: 10.1111/j.1502-3931.2009.00206.x. - DOI
    1. Harper DAT, Zhan R-B, Jin J. The Great Ordovician Biodiversification Event: Reviewing two decades of research on diversity’s big bang illustrated by mainly brachiopod data. Palaeoworld. 2015;24:75–85. doi: 10.1016/j.palwor.2015.03.003. - DOI
    1. Servais T, et al. The onset of the ‘Ordovician Plankton Revolution’ in the late Cambrian. Palaeogeogr. Palaeoclimatol. Palaeoecol. 2015;458:12–28. doi: 10.1016/j.palaeo.2015.11.003. - DOI
    1. Foote M. Morphologic patterns of diversification: examples from trilobites. Palaeontology. 1991;34:461–485.