. 2023 Nov 29;14(1):7856.
doi: 10.1038/s41467-023-43364-2.

A click chemistry-mediated all-peptide cell printing hydrogel platform for diabetic wound healing

Affiliations

A click chemistry-mediated all-peptide cell printing hydrogel platform for diabetic wound healing

Jinjian Huang et al. Nat Commun. .

Abstract

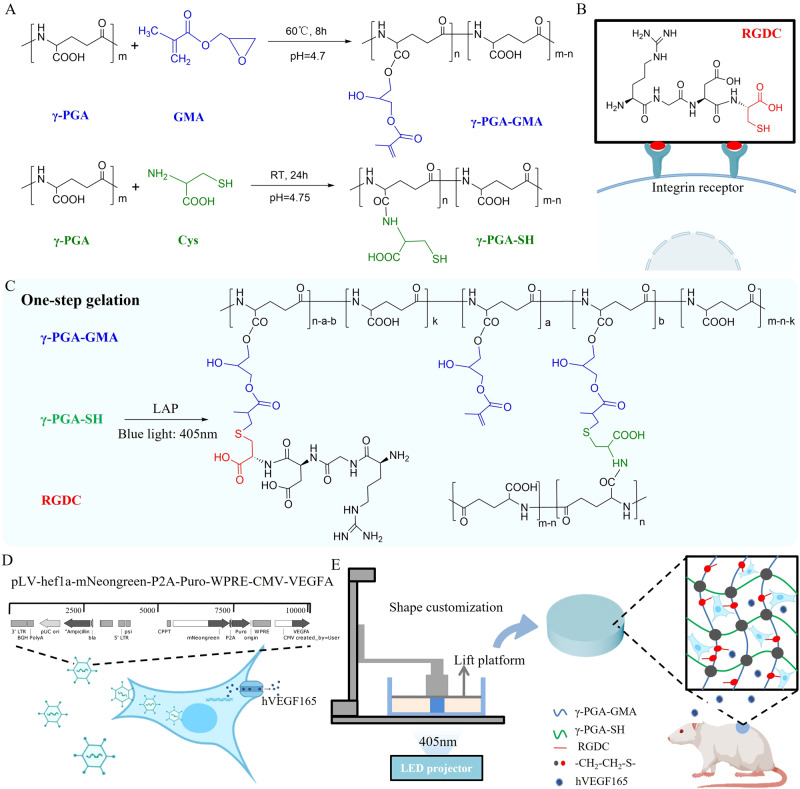
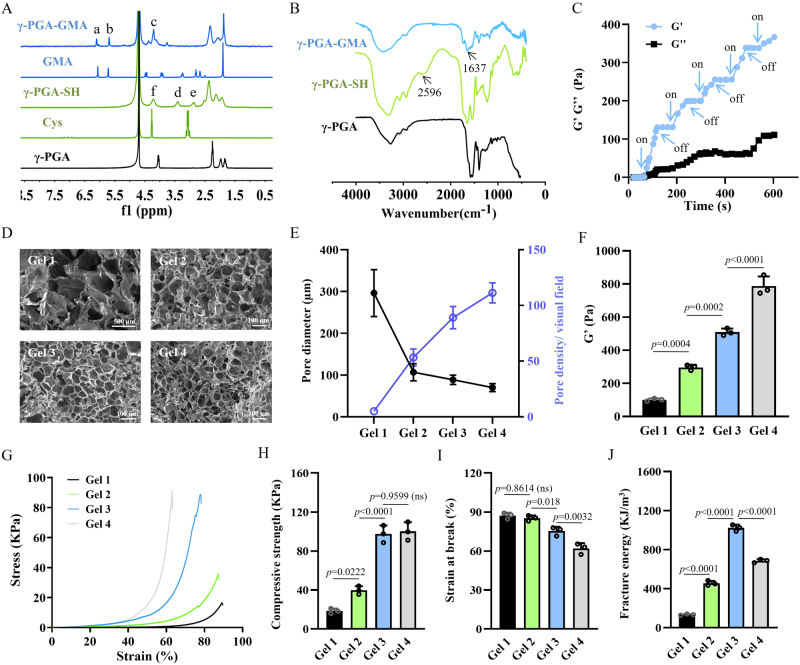
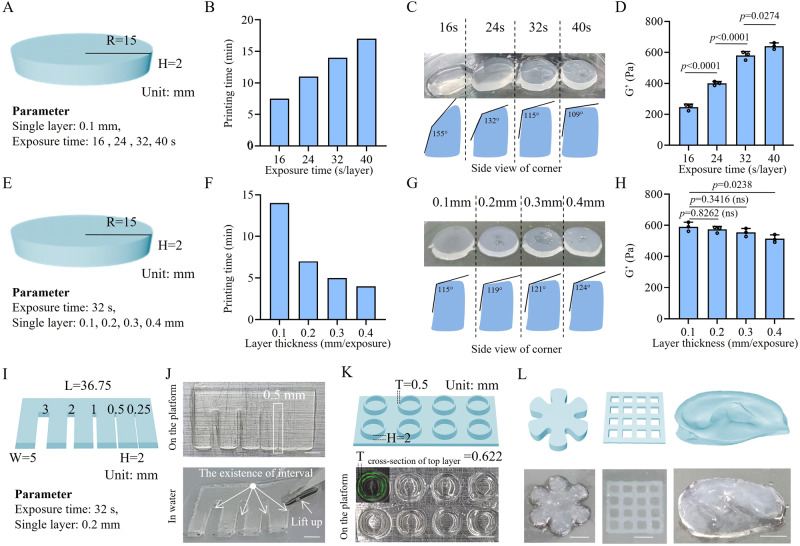
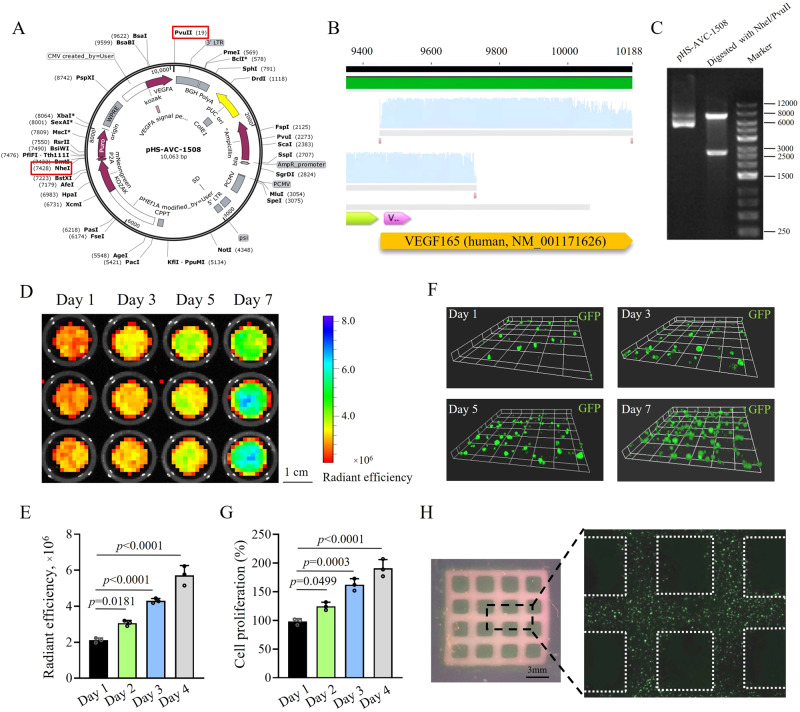
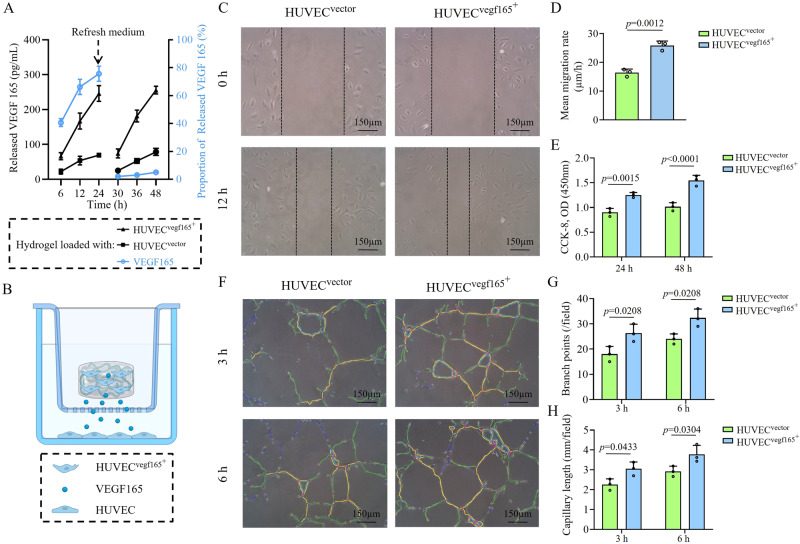
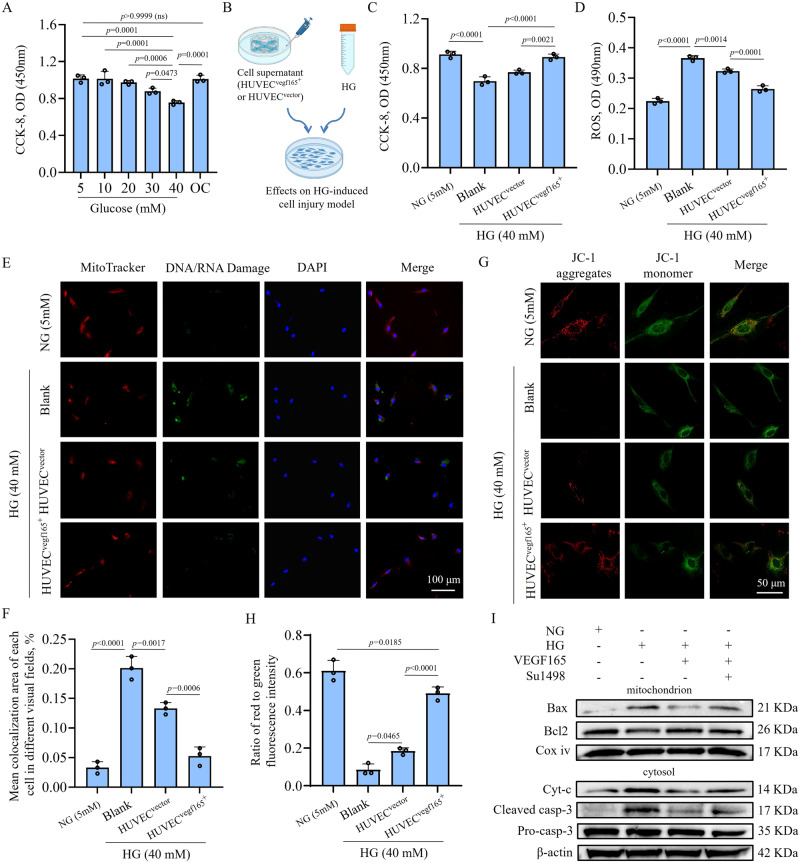
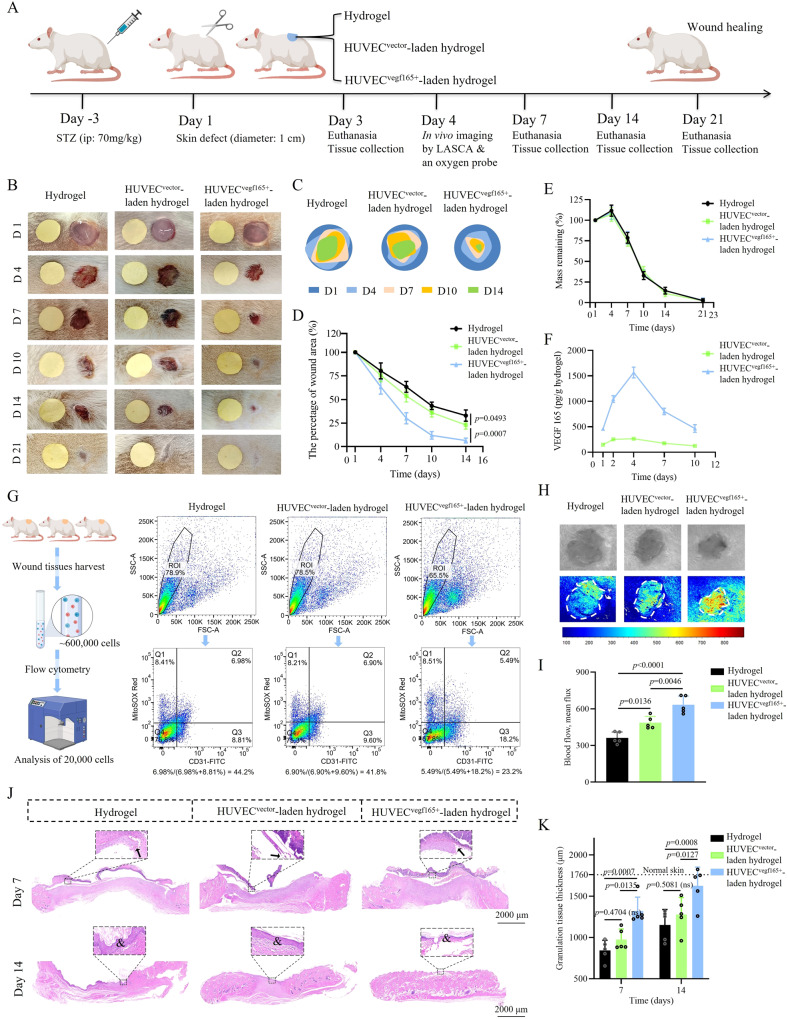
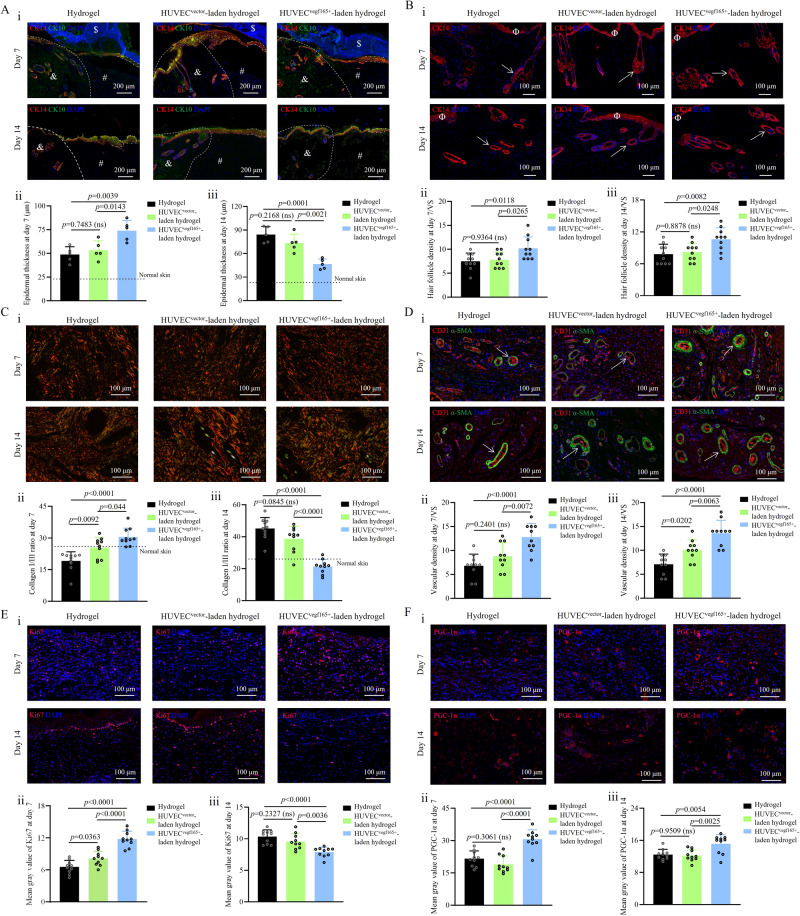
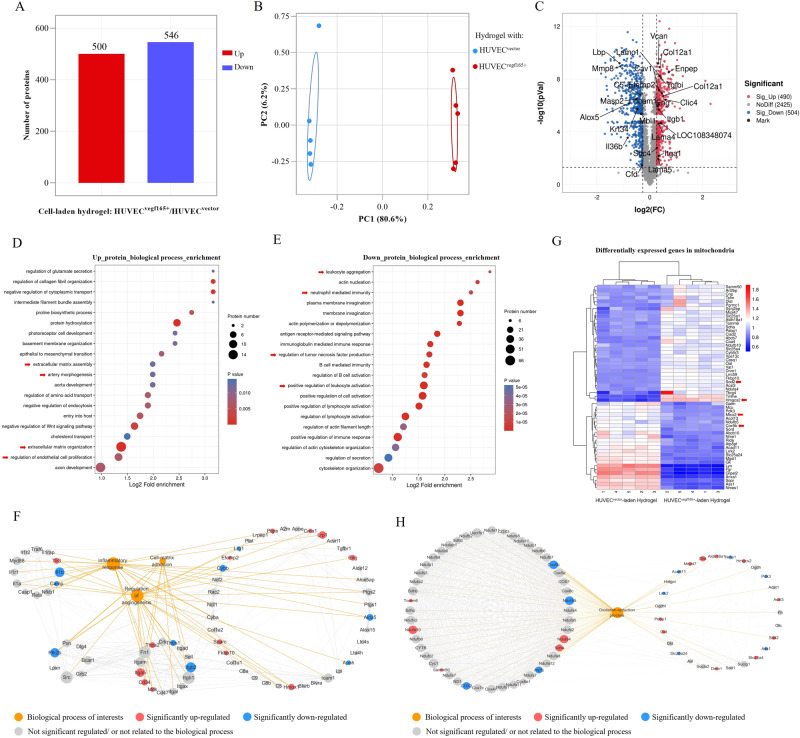
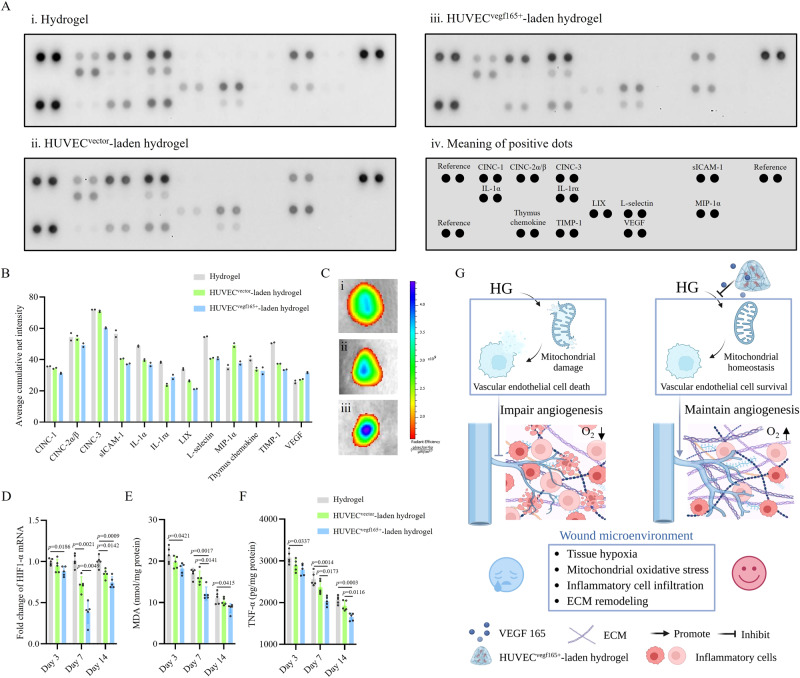
High glucose-induced vascular endothelial injury is a major pathological factor involved in non-healing diabetic wounds. To interrupt this pathological process, we design an all-peptide printable hydrogel platform based on highly efficient and precise one-step click chemistry of thiolated γ-polyglutamic acid, glycidyl methacrylate-conjugated γ-polyglutamic acid, and thiolated arginine-glycine-aspartate sequences. Vascular endothelial growth factor 165-overexpressed human umbilical vein endothelial cells are printed using this platform, hence fabricating a living material with high cell viability and precise cell spatial distribution control. This cell-laden hydrogel platform accelerates the diabetic wound healing of rats based on the unabated vascular endothelial growth factor 165 release, which promotes angiogenesis and alleviates damages on vascular endothelial mitochondria, thereby reducing tissue hypoxia, downregulating inflammation, and facilitating extracellular matrix remodeling. Together, this study offers a promising strategy for fabricating tissue-friendly, high-efficient, and accurate 3D printed all-peptide hydrogel platform for cell delivery and self-renewable growth factor therapy.


Conflict of interest statement

The authors declare no competing interests.

Figures

Fig. 1
Fig. 1. Design of cell-printable peptide hydrogel platform to produce self-renewable VEGF 165 for diabetic wound healing.
A Synthetic routes of γ-PGA-GMA and γ-PGA-SH. RT, room temperature. B Chemical structure of RGDC, which presents additional thiol groups compared to RGD. C One-step generation of all-peptide hydrogels using thiol-ene click reaction of γ-PGA-GMA with γ-PGA-SH and RGDC. LAP, a type of photoinitiator stimulated by blue light. D Transfection of VEGF 165 transcript-carried lentivirus in HUVECs for overexpressing VEGF 165. E Printing the HUVECvegf165+-laden peptide hydrogels for diabetic wound healing using sustained-release VEGF 165.
Fig. 2
Fig. 2. Synthesis and optimization of the all-peptide hydrogels.
A 1H NMR spectrum of modified γ-PGA. a: δ = 6.27 ppm; b: δ = 5.64 ppm; c: δ = 4.13–4.52 ppm; d: δ = 3.36 ppm; e: δ = 2.87 ppm; f: δ = 4.13–4.52 ppm. B FTIR spectrum of modified γ-PGA. C Time-sweep rheological tests of the hydrogels with five cycles of blue light on and off. D Representative images of hydrogel micromorphology based on three repeated experiments with similar results. E Morphological analysis revealed the reduction in pore size and increase in pore density with increase in polymer concentration. n = 3 independent experiments. F Rheological results showing an increase in G′ of hydrogels when the polymer concentration is increased. n = 3 independent experiments. G Representative compressive stress-strain curves of different hydrogels. H Compressive strength of hydrogels with relatively high polymer concentration (Gel 3 and Gel 4) is increased compared to that of hydrogels with lower polymer concentration (Gel 1 and Gel 2). n = 3 independent experiments. I Strain at break of hydrogels is decreased with increase in polymer concentration. n = 3 independent experiments. J Fracture energy of Gel 3 is the highest among all the groups of hydrogels. n = 3 independent experiments. The p values in the figures (F, HJ) are determined by one-way ANOVA followed by Tukey’s multiple comparisons test. Data are presented as mean ± SD. ns not significant. Source data are provided as a Source Data file.
Fig. 3
Fig. 3. DLP printability of the all-peptide hydrogel.
A Flat cylinder model for the determination of the optimal blue light exposure time per layer. B Prolongation of the light exposure time of each layer increased the printing time and reduced the efficiency. C Prolongation of the light exposure time of each layer increased the printing accuracy by forming a tangent angle of the corner closer to 90°. D Prolongation of the light exposure time of each layer increased the storage modulus (G′) of the printed cylinder hydrogel. n = 3 independent experiments. E Flat cylinder model for the determination of the optimal printing layer thickness. F Increase in layer thickness significantly reduced the printing time. G Increase in layer thickness slightly impaired the printing accuracy by forming a tangent angle of the corner further away from 90°. H Increase in layer thickness slightly impaired the storage modulus (G′) of the printed cylinder hydrogel. n = 3 independent experiments. I Comb model for the determination of printing resolution. J Real printed comb with the printing resolution reaching 0.5 mm because the gap at 0.5 mm was the minimum distance required to separate adjacent comb teeth. Scale bars = 5 mm. K Printing microtube models with the wall thickness at 0.5 mm. The wall thickness of real microtubes was measured to be 0.622 mm, reflecting that the printing error was 0.122 mm. Scale bar = 5 mm. L DLP printing of customized objects in different shapes, including hexagonal petals, microporous scaffolds, and ear models. Scale bars = 5 mm. The p values in the figures (D and H) are determined by one-way ANOVA followed by Tukey’s multiple comparisons test. Data are presented as mean ± SD. ns, not significant. R radius, H height, W width, T thickness. Source data are provided as a Source Data file.
Fig. 4
Fig. 4. Co-printability of HUVECsvegf165+ using the all-peptide bioink.
A Structure of VEGF 165-overexpressing lentivirus plasmid, pHS-AVC-1580. Red frameworks mark the two restriction endonucleases of NheI and PvuII for cutting off the plasmid in the later validation experiment. B Gene sequencing identifies the VEGF 165 sequence in the plasmid. C Size of two fragments of VEGF 165-overexpressing lentivirus plasmid cut off by NheI and PvuII restriction endonucleases conforms to the expectations (e.g., 7409 bp and 2654 bp). Two independent experiments have confirmed similar results. D IVIS spectrum of HUVECvegf165+-laden hydrogel sheets when cultured for different time periods. E Quantitative analysis of the radiant efficiency of cell sheet IVIS images when cultured for different time periods. n = 3 independent experiments. F Z-axis stacking of the cell sheets using confocal microscopy when cultured for different time periods. G CCK-8 analysis of cell proliferation after different culture time periods. n = 3 independent experiments. H High-fidelity HUVECvegf165+-laden microporous scaffold embedded with homogeneous cells. The p values in the figures (E and G) are determined by one-way ANOVA followed by Tukey’s multiple comparisons test. Data are presented as mean ± SD. Source data are provided as a Source Data file.
Fig. 5
Fig. 5. Releasing kinetics of VEGF 165 by different hydrogel platforms and the resultant biological functions.
A HUVECvegf165+-laden hydrogel presented distinctive self-renewal ability and enhanced VEGF 165 release. The VEGF 165 releasing curves of cell-laden hydrogel in black were corresponding to the left Y-axis, while the curves of VEGF 165-loaded hydrogel in blue were in different releasing profiles and corresponding to the right Y-axis. n = 3 independent experiments. B Co-culture cell model for studying the biological effects of HUVECvegf165+-laden hydrogel. This figure was created with BioRender.com and has been granted a publication license. C Wound healing of HUVECs was accelerated following treatment with HUVECvegf165+-laden hydrogel. D Quantitative analysis of wound healing speed. n = 3 independent experiments. E HUVEC proliferation was improved by HUVECvegf165+-laden hydrogel. n = 3 independent experiments. F Tube formation of HUVECs was enhanced by HUVECvegf165+-laden hydrogel. G Quantitative analysis of branch points. n = 3 independent experiments. H Quantitative analysis of capillary length. n = 3 independent experiments. The p values in the figure (D) and figures (E, G, and H) are determined by two-sided unpaired t test and two-way ANOVA followed by Sidak’s multiple comparisons test, respectively. Data are presented as mean ± SD. Source data are provided as a Source Data file.
Fig. 6
Fig. 6. Self-renewable VEGF 165 from HUVECvegf165+-laden hydrogel improves HG-induced endothelial cell injuries via protecting mitochondrial permeability.
A HG impairs the viability of HUVECs. OC, osmotic control with 5 mM glucose and 35 mM D-mannitol. n = 3 independent experiments. B Schematic diagram of cell models used to investigate the effects of the supernatant of cell-laden hydrogel platform on HG-induced HUVEC injuries. This figure was created with BioRender.com and has been granted a publication license. C Supernatant of HUVECvegf165+-laden hydrogel platform significantly improved the viability of HUVECs under the HG condition. n = 3 independent experiments. D Supernatant of HUVECvegf165+-laden hydrogel platform significantly reduced the ROS production of HUVECs under the HG condition. n = 3 independent experiments. E Immunofluorescence (IF) staining assay revealed HG-induced DNA/RNA damages with the IF signals co-localized with mitochondria. The supernatant of HUVECvegf165+-laden hydrogel platform ameliorated the DNA/RNA damage. F Quantitative analysis of mitochondrial DNA/RNA damage after different treatments. n = 3 independent experiments. G Supernatant of HUVECvegf165+-laden hydrogel platform improved the mitochondrial permeabilization detected with JC-1, a type of mitochondrial membrane potential (MMP) dye. H Quantitative analysis of the fluorescence intensity ratio of JC-1 aggregates to JC-1 monomers for determining MMPs after different treatments. n = 3 independent experiments. I Western blot results indicated that the VEGF 165 in the supernatant of HUVECvegf165+-laden hydrogel platform alleviated Bax-elicited mitochondrial perforation and casp-3-activated programmed cell death due to mitochondrial leakage. The results have been confirmed by two independent experiments. The p values in the figures (A, C, D, F, and H) are determined by one-way ANOVA followed by Tukey’s multiple comparisons test. Data are presented as mean ± SD. ns, not significant. Source data are provided as a Source Data file.
Fig. 7
Fig. 7. Evaluation of the effect of HUVECvegf165+-laden hydrogel on rat diabetic wounds.
A Experimental scheme. This figure was created with BioRender.com and has been granted a publication license. ip, intraperitoneal injection; LASCA, laser speckle contrast analysis. B Diabetic wound healing processes were recorded after the three treatments. Yellow paper as a size control is in a diameter of 1 cm. C Re-depiction of wound healing processes. D Comparison of wound closure rates following the three treatments. n = 15 rats/group on day 1; n = 10 rats/group on days 4 and 7; n = 5 rats/group on days 10 and 14. E Hydrogel degradation rate in the three treatment groups calculated by residue weight. n = 5 hydrogels/group. F Dynamic changes of VEGF 165 concentration in HUVECvector-laden hydrogels and HUVECvegf165+-laden hydrogels during the in vivo treatment process. n = 5 hydrogels/group. G Flow cytometry analysis of single cells lysed from wounds of three rats in each group indicated that the proportion of mitochondrial oxidative stress damage in vascular endothelial cells was 23.2% in the HUVEC vegf165+-laden hydrogel group, which was significantly lower than that of the hydrogel group (44.2%) and HUVECvector-laden hydrogel group (41.8%). MitoSOX red marked mitochondrial oxidative stress damage; CD 31 marked vascular endothelial cells. The left panel of the figure was created with BioRender.com and has been granted a publication license. H LASCA revealed increased blood flow following the treatment with HUVECvegf165+-laden hydrogels. I Quantitative analysis of blood flow based on mean flux. n = 5 rats/group. J HE analysis revealed varied degrees of granulation tissue formation and re-epithelization in the different treatment groups. Arrows: edges of the extended epithelial layer on day 7; &: formation of intact epithelial layer. K Quantitative analysis of granulation tissue thickness in the different treatment groups. n = 5 rats/group. The p values in the figures (D and K) and figure (I) are determined by two-way ANOVA and one-way ANOVA, respectively, followed by Tukey’s multiple comparisons test. Data are presented as mean ± SD. ns not significant. Source data are provided as a Source Data file.
Fig. 8
Fig. 8. Histological analysis of the healing process of diabetic wounds with different treatments.
A CK14/CK10 immunofluorescence (IF) staining of the epithelial layer. $: fibrous capsule; #: regenerated granulation tissue; &: edges of normal skin; dotted line: boundary separating normal skin and wound; dot-and-dash line: extended epithelial layer that covers the wound bed. n = 5 rats/group. B CK14 IF staining of hair follicles. Φ: epithelial layer; arrows: hair follicles. VS, visual field. n = 10. C Picrosirius red staining of collagen in the wounds. n = 10. D Vascular structure stained with CD 31 and ɑ-SMA. Arrows: microvessels. n = 10. E Staining of proliferative cells by Ki67. n = 10. F Evaluation of cell metabolic rate by PGC-1ɑ staining. n = 10. For AF, i: representative tissue staining images; ii: quantitative analysis of corresponding wound images on day 7; iii: quantitative analysis of corresponding wound images on day 14. For BF, n = 10 because two random visual fields were selected for each tissue sample harvested from five rats in each group. The p values in each figure (ii and iii) are determined by one-way ANOVA followed by Tukey’s multiple comparisons test. Data are presented as mean ± SD. ns, not significant. Source data are provided as a Source Data file.
Fig. 9
Fig. 9. Proteomics comparison of diabetic wounds on day 7 between HUVECvegf165+-laden hydrogel and HUVECvector-laden hydrogel.
A Number of differentially expressed proteins. B PCA reveals evident separation based on differentially expressed proteins between the two groups. n = 5 rats/group. C Volcano plot shows the differentially expressed proteins of interests. D Upregulated pathways in the biological process enrichment analysis. Arrows: upregulated pathways of interests regarding extracellular matrix deposition and vessel regeneration. E Downregulated pathways in the biological process enrichment analysis. Arrows: downregulated pathways of interests regarding inflammatory response. F Protein-protein interaction and protein-biological process relation network analysis indicates that different biological processes during wound healing including inflammatory response, angiogenesis, and cell-matrix adhesion are interrelated based on some common differentially expressed proteins. G Heatmap shows the differentially expressed mitochondrial proteins of interests. Arrows: representative proteins related to mitochondrial oxidative stress damage. H Protein-protein interaction and protein-biological process relation network analysis reveals the key differentially expressed mitochondrial proteins involved in the oxidation-reduction process. The p values in the figure (C) and figures (D and E) are determined by two-sided unpaired t test and Fisher’s exact test, respectively.
Fig. 10
Fig. 10. HUVECvegf165+-laden hydrogel ameliorates oxygenation and inflammation of diabetic wounds.
A Proteome profiler rat cytokine array of diabetic wounds on day 7 with different treatments. B Quantitative analysis of the signal intensity of cytokines. n = 2 dots for each cytokine in the membrane. C IVIS spectrum of luminescent oxygen probe for the detection of oxygen contents of diabetic wounds on day 4. i: hydrogel; ii: HUVECvector-laden hydrogel; iii: HUVECvegf165+-laden hydrogel. D Comparison of HIF-1ɑ transcriptional level among the diabetic wounds with different treatments on days 3, 7, and 14. n = 5 rats/group. E Comparison of MDA concentration among the diabetic wounds with different treatments on days 3, 7, and 14. n = 5 rats/group. F Comparison of TNF-ɑ production among the diabetic wounds with different treatments on days 3, 7, and 14. n = 5 rats/group. G Therapeutic mechanism of wound healing by HUVECvegf165+-laden hydrogel. VEGF 165 was continuously released from the HUVECvegf165+-laden hydrogel to rescue HG-induced vascular endothelial cell death by inhibiting mitochondrial oxidative stress, thus improving tissue angiogenesis and oxygenation, and creating an eligible microenvironment for diabetic wound healing. This schematic diagram was created with BioRender.com and has been granted a publication license. The p values in the figures (DF) are determined by two-way ANOVA followed by Tukey’s multiple comparisons test. Data are presented as mean ± SD. Source data are provided as a Source Data file.

References

    1. Sen CK. Human wound and its burden: updated 2020 compendium of estimates. Adv. Wound Care. 2021;10:281–292. doi: 10.1089/wound.2021.0026. - DOI - PMC - PubMed
    1. Armstrong DG, et al. Five year mortality and direct costs of care for people with diabetic foot complications are comparable to cancer. J. Foot Ankle Res. 2020;13:16. doi: 10.1186/s13047-020-00383-2. - DOI - PMC - PubMed
    1. Medical device: diabetic foot ulcer (DFU) treatment market. Available at: https://www.fortunebusinessinsights.com/industry-reports/diabetic-foot-u... (2020).
    1. Everett, E. & Mathioudakis, N. Update on management of diabetic foot ulcers. Ann. N.Y. Acad. Sci. 1411, 153–165 (2018). - PMC - PubMed
    1. Falanga V. Wound healing and its impairment in the diabetic foot. Lancet. 2005;366:1736–1743. doi: 10.1016/S0140-6736(05)67700-8. - DOI - PubMed

Publication types