. 2023 Dec;624(7990):173-181.
doi: 10.1038/s41586-023-06781-3. Epub 2023 Nov 29.

MSL2 ensures biallelic gene expression in mammals

Affiliations

MSL2 ensures biallelic gene expression in mammals

Yidan Sun et al. Nature. 2023 Dec.

Abstract

In diploid organisms, biallelic gene expression enables the production of adequate levels of mRNA1,2. This is essential for haploinsufficient genes, which require biallelic expression for optimal function to prevent the onset of developmental disorders1,3. Whether and how a biallelic or monoallelic state is determined in a cell-type-specific manner at individual loci remains unclear. MSL2 is known for dosage compensation of the male X chromosome in flies. Here we identify a role of MSL2 in regulating allelic expression in mammals. Allele-specific bulk and single-cell analyses in mouse neural progenitor cells revealed that, in addition to the targets showing biallelic downregulation, a class of genes transitions from biallelic to monoallelic expression after MSL2 loss. Many of these genes are haploinsufficient. In the absence of MSL2, one allele remains active, retaining active histone modifications and transcription factor binding, whereas the other allele is silenced, exhibiting loss of promoter-enhancer contacts and the acquisition of DNA methylation. Msl2-knockout mice show perinatal lethality and heterogeneous phenotypes during embryonic development, supporting a role for MSL2 in regulating gene dosage. The role of MSL2 in preserving biallelic expression of specific dosage-sensitive genes sets the stage for further investigation of other factors that are involved in allelic dosage compensation in mammalian cells, with considerable implications for human disease.


Conflict of interest statement

The authors declare no competing interests.

Figures

Fig. 1
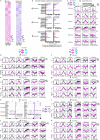
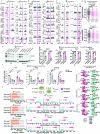
Fig. 1. Allele-specific changes in gene expression after Msl2 deletion.
a, Schematic of polymorphic male and female WT and Msl2-KO hybrid ES cell lines and ES-cell-derived clonal NPCs. The diagram was created using BioRender. A1, allele 1; A2, allele 2. b, Comparison of standard and allele-specific differential expression (DE) analysis between Msl2 KO and WT in male CaBl and BlCa and female CaBl and 9sCa NPCs. The blue dots indicate significantly differentially expressed genes from the standard analysis (q < 0.01). The red dots represent significantly differentially expressed genes from the allele-specific analysis (P < 0.05). c, Categorization of differentially expressed genes in WT (grey) and Msl2-KO (KO1/2 clones, pink) NPCs (left). Expression levels of allele 1 and allele 2 from allele-specific DE analysis are shown for male CaBl and female 9sCa WT and Msl2-KO1/2 NPCs (right). Significance was determined using two-sided nonparametric Wilcoxon rank-sum tests; *P < 0.05, **P < 0.01, ***P < 0.001; not significant (NS), P > 0.05. Exact P values are summarized in the Source Data. Sample sizes for statistical tests (from top to bottom): n = 177, 171, 67, 92, 1,068 and 300 (left) and n = 180, 130, 85, 87, 940 and 300 (right). Details on the box plots are provided in the Methods. d, Allelic differential expression changes (log2[FC] (Msl2 KO/WT)) in male CaBl and BlCa and female CaBl and 9sCa NPCs. Source Data
Fig. 2
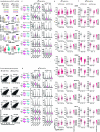
Fig. 2. MSL2 regulates haploinsufficient genes.
a, k-means clustering of bi-to-mono genes (log2[FC] < −2) across male CaBl and BlCa and female CaBl and 9sCa NPCs based on allele-specific log2[FC] (Supplementary Table 2). The coloured bars indicate 14 subclusters. b, Haploinsufficiency scores (left) and triplosensitivity (right) of bi-to-mono genes in four NPCs (as described in a). Left, the dot size and colour represent haploinsufficiency scores and the presence (red) and absence (blue) of triplosensitivity. Associations with selected human diseases from ClinGen are shown. An expanded version is shown in Extended Data Fig. 4b. c, The overlap of bi-to-mono genes in male CaBl and BlCa and female CaBl and 9sCa NPCs, with the indicated classes of published monoallelic genes (Supplementary Tables 4–6). Unknown, previously unidentified as monoallelic genes. P values indicate significance for bi-to-mono gene enrichment in published datasets calculated using two-sided Fisher’s exact tests. d, Allelic differential expression changes (log2[FC] (Msl2 KO/WT) in allele 1 and allele 2) for bi-to-mono genes consistent in male CaBl and BlCa (left) or female CaBl and 9sCa (right) NPCs. M, maternal; P, paternal. e, Schematic and RNA-seq tracks of Slc38a1 in male CaBl and BlCa and Decr1 in female CaBl and 9sCa WT and Msl2-KO NPCs. f, Allelic differential expression changes (log2[FC] (Msl2KO/WT) in allele 1 and allele 2) for bi-to-mono genes consistent in male and female CaBl (left) and male BlCa and female 9sCa (right) NPCs. g, Schematic and RNA-seq tracks of Skida1 in male and female CaBl WT and Msl2-KO NPCs, and Slc38a3 in male and female BlCa and 9sCa WT and Msl2-KO NPCs. h, Allelic differential expression changes (log2[FC] (Msl2KO/WT)) for all XCI escapees in female 9sCa (left) and CaBl (right) NPCs. The grey lines indicate the log2[FC] = −2 threshold. All escapees are summarized in Supplementary Table 7. i, Allelic expression of escapees with bi-to-mono changes in WT and Msl2-KO 9sCa and CaBl NPCs. For d, f and h, the diagrams were created using BioRender. Source Data
Fig. 3
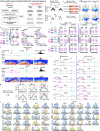
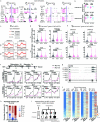
Fig. 3. MSL2 maintains promoter–enhancer contacts.
a,c, ATAC–seq and histone modification ChIP–seq metagene profiles for bi-to-monoA1 genes in male CaBl (a) and bi-to-monoA2 genes in BlCa (c) WT (grey) and Msl2-KO (pink) NPCs. The log2[FC] of ChIP–seq levels (IP/input) are displayed with the standard error (shadows). b,d, RNA-seq, ATAC–seq, and H3K4me3 and H4K36me3 ChIP–seq tracks of Zfp560 in male CaBl (b) and BlCa (d) WT and Msl2-KO NPCs (left). The fold change of ChIP–seq (IP/input) is shown. Right, RNA expression (top) and chromatin accessibility (bottom) on WNN UMAPs for Decr1. e, The MSL2 ChIP–seq peak distribution in male CaBl and BlCa and female 9sCa WT NPCs at the promoters (TSS ± 1 kb) and enhancers identified in NPCs by EnhancerAtlas2.0. f, H3K4me3 HiChIP analysis identified promoter–enhancer contacts of Rab9 in the surrounding region (±550 kb) built from allele 1 (magenta) and allele 2 (cyan) and standard analysis (black) in female 9sCa WT and Msl2-KO NPCs. MSL2 ChIP–seq (IP/input) tracks and Hi-C data in female 9sCa WT NPCs are shown. g, Aggregation of in silico MSL2 HiChIP (MSL2 ChIP–seq + Hi-C) interactions (top) and randomly selected Hi-C interactions (bottom) at pairwise promoter–enhancer combinations of bi-to-mono genes in female 9sCa WT NPCs. h, MSL2 ChIP–seq (IP/input) metagene profiles in male CaBl and BlCa and female 9sCa WT NPCs at the enhancers and promoters of bi-to-monoA2 genes.
Fig. 4
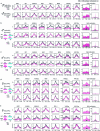
Fig. 4. Monoallelic CG-motif factor binding and CpG methylation after MSL2 loss.
a, The top 20 enriched transcription factors from enhancer and promoter motif analysis on the active allele of bi-to-mono genes in male CaBl and BlCa and female 9sCa Msl2-KO NPCs. The dot size shows the motif fold enrichment and the colour shows −log10[P]. Var, binding variant. b,c, ChIP–seq metagene plots of the indicated factors and histone acetylation at the TSS and the CpG methylation frequency at the TSS (left) of bi-to-mono genes and differentially methylated loci (DML, false-discovery rate (FDR) < 1 × 10−5) (right) in male CaBl (b) and BlCa (c) WT and Msl2-KO NPC clones. The log2[FC] values of ChIP–seq levels (IP/input) are displayed with the standard error (shadows). d, RT–qPCR analysis of Zfp422 mRNA levels in 6 h dBET-treated or DMSO-treated (mock) male CaBl and BlCa WT and Msl2-KO NPCs. mRNA levels relative to Rplp0 expression are shown. Significance was determined using two-way analysis of variance (ANOVA) with Tukey’s multiple-comparison test. Exact P values are as follows: CaBl: **P = 0.0067, *P = 0.0133; BlCa: ****P < 0.0001, ***P = 0.0003, *P = 0.0193. n = 3 independent experiments. Data are mean ± s.e.m. e, Anticorrelation between monoallelic CG-motif factor binding and CpG methylation in male CaBl Msl2-KO NPCs. The log2[FC] (allele 2/allele 1) in NRF1, SP1 and KANSL3 ChIP–seq signal (IP/input) (top) and the subtract (allele 2 − allele 1) of CpG methylation frequency (bottom). Allele-1-biased (magenta) and allele-2-biased genes (cyan) are shown. The diagrams were created using BioRender. f, The log2[FC] (KO/WT) in allelic NRF1 ChIP–seq signal (IP/input) (top) and CpG methylation (bottom) at genes with consistent bi-to-mono changes in male NPCs (Fig. 2a,d) separated into paternal (left; n = 16) or maternal (right; n = 30) change. Significance was determined using two-sided nonparametric Wilcoxon rank-sum tests; exact P values are indicated in the figure. Details on the box plots are provided in the Methods. Source Data
Fig. 5
Fig. 5. The physiological role of MSL2.
a, Schematic of the Msl2-null allele of the Msl2−/− mice in the pure C57BL/6 background, showing the two Msl2 transcripts, and the predicted outcome of CRISPR-mediated deletion in exon e1 (red) on the MSL2 protein. The asterisk depicts an alternative exon in isoform 2. b, Genotype ratios in prenatal (E11.5–18.5) or postnatal (P0.5) litters of Msl2+/− female (F) mice mated with Msl2+/− male (M) mice. n = 195 (prenatal) and n = 37 (postnatal). All animal numbers are provided in the Source Data. c, The percentage and number of E18.5 embryos with severe, mild or no phenotypes isolated from Msl2+/− female mice mated with Msl2+/− male mice. d, The phenotypes of the indicated genotypes in E18.5 embryos isolated from Msl2+/− female mice mated with Msl2+/− male mice. e, Representative images of Msl2+/− and Msl2−/− E18.5 embryo heads with eye malformations (left). The arrows highlight the affected eyes. Right, other severe phenotypes observed in Msl2−/− female E18.5 embryos, including brain defects, microphthalmia, haemorrhage (black arrows) and kidney malformation (white arrow) are indicated. f, Comparison of downregulated genes in the brain and placenta of female Msl2−/− E18.5 embryos (n = 3 and 3 (Msl2+/+); n = 3 and 2 (Msl2−/−)) scored at FDR < 0.05 and log2[FC] < 0. The colour key indicates the log2[FC] (KO/WT). g, GO enrichment analysis of downregulated genes in the brain and placenta (f) of female Msl2−/− E18.5 embryos. The ratio of genes in each category is indicated by the dot size and the adjusted P value is indicated by the colour range. h,i, Expression changes of bi-to-mono (h) and haploinsufficient genes (i) of four NPCs in Msl2−/− E18 embryos. The log2[FC] (KO/WT) (standard analysis) of NPCs, brain and placenta is shown. The percentages of bi-to-mono (h) and haploinsufficient genes (i) with consistent changes in the brains are shown. The colour key indicates the log2[FC] (KO/WT). j, Model summarizing MSL2-mediated transition of biallelic to monoallelic expression in hybrid NPCs. The diagrams in a and j were created using BioRender. Source Data
Extended Data Fig. 1
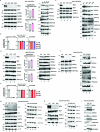
Extended Data Fig. 1. Characterization of hybrid WT and Msl2-KO ESC and NPCs.
(a, c, d, f, g-i) Western blot analysis of pluripotency factors, selected MSL and KANSL complex components and histone modifications in WT and Msl2-KO ESC and NPCs. ACTIN, DHX9, RNA POL II, histone H3 and H4 serve as loading controls across panels. All Western blot experiments have been performed twice and representative results of a single experiment are depicted. The same loading order and equal volumes of the same lysates were loaded on multiple gels for blots displayed in a given column. For gel source data, see Supplementary Fig. 1. (a) Male CaBl ESCs comparing the parental WT (lane 1) and 3 Msl2-KO clones (lane 2–4). Protein quantification of NANOG and OCT3/4 (middle panel) of the single experiment depicted in the left panel was performed relative to RNA POL II levels. Data of Msl2-KO clones (KO (n = 3), pink) are depicted as a fold change over the WT clone (WT (n = 1), grey) and data are represented as mean values +/− SEM. Sequencing experiments were performed on the parental WT and Msl2-KO clones 1 and 3. (b) RT-qPCR analyses of Msl2 exon1, Nanog and Oct4 mRNA levels in parental WT, 3 Msl2-KO male CaBl ESC clones. mRNA levels were normalized to Tbp. Results are represented as fold change over WT and data are represented as mean values +/− SEM. n = 4 independent experiments. (c) Male CaBl NPCs comparing the parental WT (lane 1) and 3 Msl2-KO clones (lane 2–4). Sequencing experiments were performed on the parental WT and Msl2-KO clone 1 and 2. (d) Male BlCa ESCs comparing the parental WT (lane 1) and 2 Msl2-KO clones (lane 2-3). Protein quantification of NANOG and OCT3/4 of the single experiment depicted in the left panel was performed relative to RNA POL II levels. Data of Msl2-KO clones (KO (n = 2), pink) are depicted as a fold change over the WT clone (WT (n = 1), grey) and data are represented as mean values +/− SEM. Sequencing experiments were performed on the parental WT and Msl2-KO clone 1. (e) RT-qPCR analyses of Msl2 exon1, Nanog and Oct4 mRNA levels in parental WT, 2 Msl2-KO male BlCa ESC clones. mRNA levels were normalized to Tbp. Results are represented as fold change over WT and data are represented as mean values +/− SEM. n = 4 independent experiments. (f) Male BlCa NPCs comparing the parental WT (lane 1) and 2 Msl2-KO clones (lane 2-3). Sequencing experiments were performed on the parental WT and Msl2-KO clone 1. (g) Female 9sCa ESCs comparing the parental WT (lane 1) and 3 Msl2-KO clones (lane 2–4). Asterisk indicates protein of interest. A background band (50 kDa) detected by MSL2 antibody was included to highlight KO specificity. Sequencing experiments were performed on the parental WT and Msl2-KO clones 1 and 2. (h) Female 9sCa NPCs comparing the parental WT (lane 1) and 2 Msl2-KO clones (lane 2-3). Sequencing experiments were performed on the parental WT and Msl2-KO clones 1 and 2. (i) Female CaBl NPCs comparing the parental WT (lane 1) and Msl2-KO clone (lane 2). Sequencing experiments were performed on the parental WT and Msl2-KO clone. Source Data
Extended Data Fig. 2
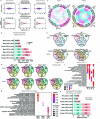
Extended Data Fig. 2. Differential gene expression analyses of WT and Msl2-KO ESC and NPCs.
(a) Standard differential expression (DE) (top) and allele-specific DE analysis (bottom) of Msl2-KO and WT in male CaBl/BlCa and female 9sCa ESCs. Blue dots represent significant DEgenes from standard analysis which compares total gene expression levels of  Msl2 KO to WT (KO/WT) (q-value < 0.01). Red dots represent significant DEgenes from allele-specific analysis which compares gene expression changes for allele 2 (A2) (KO/WT) to allele 1 (A1) (KO/WT) (p-value < 0.05, see Methods). Total number of DEgenes are indicated at the top. (b) Number of significantly up- (blue) and down-regulated (red) genes upon Msl2 KO obtained by standard DE analysis (q-value < 0.01). (c) Circos plots compare allelic downregulated genes in female 9sCa and male BlCa/CaBl ESCs (left) and male CaBl/BlCa and female CaBl/9sCa NPCs (right) on allele 1 (magenta) and allele 2 (cyan). Outer circle colours indicate the cell line (see a) and middle circle rulers indicate the number of significantly downregulated genes per cell line per allele (p-value < 0.01). Inner circle connections represent common genes between cell lines. Grey bars show overlapping downregulated genes between allele 1 and allele 2 for each cell line. (d) Allelic downregulated genes among female 9sCa and male CaBl/BlCa ESCs (top) and male CaBl/BlCa, female CaBl/9sCa NPCs (bottom). DEgenes for allele 1 (left) and allele 2 (right) are depicted. Significance was tested using Fisher’s exact test comparing NPCs to ESCs on individual alleles (see Methods). (e) Overlap of significantly downregulated genes obtained from standard (red), allele 1 (blue) and allele 2 (yellow) DE analysis for three ESCs (top) and four NPCs (bottom). (f) Gene ontology enrichment of allelic significantly downregulated genes identified in male CaBl/BlCa and female CaBl/9sCa NPCs (p-value < 0.01) (see c). Size of black dots indicates gene category ratio and colour range represents adjusted p-value (red to blue). (g) Gene ontology enrichment analysis of allelically significantly downregulated genes identified in female 9sCa and male CaBl/BlCa ESCs (p-value < 0.01). The ratio of genes in each category is indicated by the size of the dots and the adjusted p-value is highlighted by colour range (red to blue). (h) Number of significantly allele1- (blue) and allele2-biased (red) genes upon  Msl2 KO in female 9sCa, male CaBl/BlCa ESCs and female 9sCa/CaBl, male CaBl/BlCa NPCs obtained by allele-specific DE analysis (p-value < 0.05).
Extended Data Fig. 3
Extended Data Fig. 3. Classification of DEgenes in WT and Msl2-KO NPCs.
(a) Schemes illustrate the classification of DEgenes into 5 categories plus an extra category of random genes. To categorize MSL2-regulated genes, DEgenes obtained from all three types of DE analysis were used (see Methods). Boxplots show normalized counts (log2) of total gene expression from standard DE analysis for genes of each category in male CaBl/BlCa and female CaBl/9sCa NPCs. Significance was scored by nonparametric Wilcoxon rank-sum test (two-sided), *p < 0.05, **p < 0.01, ***p < 0.001, ****p < 0.0001, NS: p > 0.05. Exact p-values are summarized in the Source Data. Sample sizes for statistical tests are as follows: male CaBl NPCs (top to bottom): n = 177, 171, 67, 92, 1068, 300; male BlCa NPCs (top to bottom): n = 171, 148, 63, 39, 1501, 300; female CaBl NPCs (top to bottom): n = 177, 173, 105, 119, 1323, 300; female 9sCa NPCs (top to bottom): n = 180, 130, 85, 87, 940, 300. For details on the boxplots, see Methods. (b) Expression levels of genes from each category for WT and Msl2 KO for individual alleles (allele 1: left; allele 2: right) obtained from allele-specific DE analysis in female CaBl (left) and male BlCa NPCs (right). Significance was scored by nonparametric Wilcoxon rank-sum test (two-sided), *p < 0.05, **p < 0.01, ***p < 0.001, ****p < 0.0001, NS: p > 0.05. Exact p-values are summarized in the Source Data. Sample sizes for statistical tests are as follows: male BlCa NPCs (top to bottom): n = 171, 148, 63, 39, 1501, 300; female CaBl NPCs (top to bottom): n = 177, 173, 105, 119, 1323, 300. For details on the boxplots, see Methods. (c) Left: Log2[FC](KO/WT) of gene expression for allele 1 (magenta) and allele 2 (cyan) for genes of each category in male CaBl/BlCa and female CaBl/9sCa NPCs. Three log2[FC] quartiles are indicated (from left to right): log2[FC] > −1, −2 <log2[FC] < −1 and log2[FC] < −2. Right: The numbers of genes identified for each quantile within each category are summarized. The category order is the same as in (a). For details on the boxplots, see Methods. Source Data
Extended Data Fig. 4
Extended Data Fig. 4. Characterization of Bi to Mono genes in WT and Msl2-KO NPCs.
(a) Percentages of haploinsufficient genes within the bi-to-mono genes (Fig. 2a, pink coloured genes) in male CaBl/BlCa and female CaBl/9sCa NPCs and within all genes in the mouse genome. Significance was tested using Fisher’s exact test. The haploinsufficient gene list was compiled from human data from ClinGen, GnomAD database (https://www.nature.com/immersive/d42859-020-00002-x/index.html), and Collins et al.. Genes were converted into mouse orthologs (see Methods). (b) Expanded version of Fig. 2b. The gene list is the same as in Fig. 2b. Haploinsufficiency scores of haploinsufficient genes identified in male CaBl/BlCa and female CaBl/9sCa NPCs, including scores from GnomAD database (https://www.nature.com/immersive/d42859-020-00002-x/index.html), ExAC, and DECIPHER databases,. The dot size and colour represent the haploinsufficiency score. Higher scores (e.g. 0.9-1) indicate a gene which is more likely to exhibit the features of haploinsufficient genes, lower scores (e.g. 0-0.1) indicate that a gene is less likely to exhibit haploinsufficiency. Associations with selected human diseases from ClinGen are shown. (c) Schematic illustrating two types of dosage-sensitive genes: those that are sensitive to decreased DNA dosage (haploinsufficiency) and those that are sensitive to increased DNA dosage (triplosensitivity). Created with BioRender.com. (d) Loss-of-function intolerance of haploinsufficient genes in male CaBl/BlCa and female CaBl/9sCa NPCs. Loss-of-function tolerance scores were obtained from the ExAC and GnomAD database (https://www.nature.com/immersive/d42859-020-00002-x/index.html). It includes two metrics: pNull, which represents the probability that the transcript belongs to the distribution of unconstrained genes, and oe_lof, which is the observed over expected ratio for predicted loss-of-function variants in the transcript. The dot size and colour indicate the (1 - loss-of-function tolerance score) to provide a better visualization of the data. Gene list is as in panel (b). (e) Comparison of allelic gene expression changes in NPCs with reciprocal background in male and female NPCs. Log2[FC] of allelic gene expression changes of Msl2 KO compared to WT of genes displaying consistent bi-to-mono changes in male CaBl and BlCa NPCs (left) and genes displaying consistent bi-to-mono changes in female CaBl and 9sCa NPCs (right) are depicted. For each cell line the first column refers to changes observed for allele 1 (A1) and the second for allele 2 (A2). M, maternal; P, paternal. See Methods for details on the analysis. (f) Sanger-seq of cDNA isolated from female 9sCa, male CaBl/BlCa WT and Msl2-KO NPCs. Electropherograms depicting the SNP rs214712414 in Zkscan16 (top) and SNP rs29038396 in Mecp2 (bottom) are shown. The letter K indicates an undefined base. The experiment was performed twice and a representative result of one experiment is shown. (g) Comparison of allelic gene expression changes in NPCs with the same background. Log2[FC] of allelic gene expression changes of Msl2 KO compared to WT of genes displaying consistent bi-to-mono changes in male and female CaBl NPCs (left) and genes displaying consistent bi-to-mono changes in male BlCa and female 9sCa NPCs (right). For each cell line the first column refers to changes observed for allele 1 and the last column for allele 2.,: maternal; P, paternal. See Methods for details on the analysis. (h) Left: RNA-seq, ATAC-seq, H3K27me3 and H3K36me3 ChIP-seq tracks at the inactive (maternal) and active (paternal) X chromosome in female 9sCa WT and Msl2-KO NPCs (top). ChIP-seq signal is input normalized. RNA-seq tracks at the inactive (maternal) and active (paternal) X chromosome in female CaBl WT and Msl2-KO NPCs (bottom). Right: RNA-seq, H3K36me3 ChIP-seq, ATAC-seq, and CpG methylation tracks of the Xist gene on the inactive and active X chromosome in female 9sCa WT and Msl2-KO NPCs (top). ChIP-seq signal is input normalized. RNA-seq tracks of the Xist gene on the inactive and active X chromosome in female CaBl WT and Msl2-KO NPCs (bottom).
Extended Data Fig. 5
Extended Data Fig. 5. TT-seq and chromatin analysis in WT and Msl2-KO NPCs.
(a) Allelic analysis of TT-seq (Transient transcriptome sequencing) results of female 9sCa WT and Msl2-KO NPCs. Left: Log2[FC] of allelic nascent gene expression comparing Msl2-KO clones 1 and 2 to WT. Right: Subtraction of the RNA synthesis rate for Msl2-KO clones 1 and 2 from WT. The first two columns refer to changes observed for allele 1 and the last columns for allele 2. The rows are ordered based on the categories as illustrated in Fig. 1d. Scales show Z score normalized log2[FC]. (b) Overall changes in chromatin features at downregulated genes scored by allelic DE analysis in male CaBl/BlCa and female 9sCa Msl2-WT and KO NPCs separated by allele 1 (left) and allele 2 (right). Numbers of allelic DE genes per cell line are indicated. Bar plots summarize the number of ATAC-seq and histone modification ChIP-seq peaks showing either decreased (purple) or increased signal (yellow) in Msl2-KO versus WT NPCs (see Methods). (c) ATAC-seq and histone modification ChIP-seq metagene profiles for genes of the bi-to-monoA2 category in female 9sCa WT (grey) and 2 Msl2-KO (KO1 and KO2; pink) NPC clones subdivided into three log2[FC] quantiles. Data is shown for allele 1 only. Log2[FC] of ChIP-seq levels (IP/Input) are depicted with shadows representing the standard error. (d-g) ATAC-seq and histone modification ChIP-seq metagene profiles (TSS +/− 2 kb) for bi-to-monoA1 genes in male BlCa (d) and female 9sCa NPCs (e) and bi-to-monoA2 genes in CaBl (f) and female 9sca NPCs (g). Signals are displayed for allele1 (top), allele2 (middle) and the signal obtained from standard (non-allele-specific) analysis (bottom). Log2[FC] of ChIP-seq levels (IP/Input) are depicted with shadows representing the standard error. (h) RNA-seq, ATAC-seq and H3K27me3/H4K36me3 ChIP-seq tracks for the bi-to-monoA2 genes Mecp2 (left) and Zfp607a (right) in female 9sCa WT and Msl2-KO NPCs. Log2[FC] ChIP-seq levels (IP/Input) are shown. (i-k) ATAC-seq and histone modification ChIP-seq metagene profiles for bi-to-bi-down genes in male CaBl (i), BlCa (j) and female 9sCa (k) WT and Msl2-KO NPCs. Signals are displayed for allele 1 (top), allele 2 (middle) and the signal obtained from standard (non-allele-specific) analysis (bottom). Log2[FC] of ChIP-seq levels (IP/Input) are depicted with shadows representing the standard error.
Extended Data Fig. 6
Extended Data Fig. 6. scMultiomics data of male CaBl/BlCa WT and Msl2-KO NPCs.
(a) UMAPs of male CaBl (left) and BlCa (right) WT and Msl2-KO NPC single cell data based on three analytical strategies: independent RNA analysis (top), independent chromatin accessibility analysis (middle), and weighted nearest neighbour (WNN) analysis (bottom) representing a weighted combination of scRNA-seq and scATAC-seq modalities. The total numbers of cells analysed per condition are indicated in the figure. Cells are coloured by their sample names or by condition (WT vs. KO). (b) Pearson correlation of gene counts between bulk RNA-seq and scRNA-seq in male CaBl (left) and BlCa (right) WT and Msl2-KO NPCs. scRNA-seq gene counts were calculated by merging the total counts of all cells per gene. (c,d) Violin plots showing normalized counts of RNA expression and chromatin accessibility of genes from each category for individual alleles for male CaBl (c) and BlCa (d) WT (grey) and Msl2-KO NPCs (pink). Significance was scored by nonparametric Wilcoxon rank-sum test (two-sided), ****p < 0.0001, NS: p > 0.05. Exact p-values are summarized in the Source Data. Sample sizes for statistical tests are as follows: male CaBl NPCs (top to bottom): n = 177, 171, 67, 92, 1068, 300; male BlCa NPCs (top to bottom): n = 171, 148, 63, 39, 1501, 300. (e,f) Feature plots of representative bi-to-mono genes showing RNA expression (left) and chromatin accessibility (right) on WNN UMAPs for male CaBl (e) and BlCa (f) WT and Msl2-KO NPCs. Identical genes are shown for male reciprocal BlCa and CaBl NPCs. Source Data
Extended Data Fig. 7
Extended Data Fig. 7. Allele-specific analysis of H3K4me3 HiChIP and scATAC-seq data in WT and Msl2-KO NPCs.
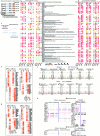
(a) Scheme illustrating the allele-specific analysis for H3K4me3 HiChIP data. Our pipeline started off with an alignment and quality control with HiC-Pro, followed by SNP-based separation of aligned reads. The separated reads were then processed with the normal HiChIP pipeline using MAPS (see Methods). (b) Summary of the chromatin contacts between Vcan and Sox2 promoter and distal sites in the surrounding region (+/− 550 kb) in female 9sCa WT and Msl2-KO NPCs scored by H3K4me3 HiChIP. The height of chromatin contacts indicates the observed contacts number/maximum contacts number within the sample. (c) Proportion of genes with promoter-enhancer contacts in female 9sCa WT NPCs identified by H3K4me3 HiChIP. (d) Aggregation of H3K4me3 HiChIP interactions at pairwise promoter-enhancer combinations of bi-to-mono (top) and bi-to-bi-down (bottom) genes in female 9sCa WT and Msl2-KO NPCs. H3K4me3 HiChIP interactions are the mean observed over expected contact ratios of Hi-C matrices with a 10 kb bin size. The scale represents mean observed over expected chromatin contacts. (e) Changes in the numbers of promoter-enhancer contacts at bi-to-monoA2 and bi-to-monoA1 genes in female 9sCa WT and Msl2-KO NPCs (left). Changes in the distribution of the distance between promoters and enhancers at bi-to-monoA2 and bi-to-monoA1 genes in WT and Msl2-KO female 9sCa NPCs (right). Significance was determined by nonparametric Wilcoxon rank-sum test (two-sided), exact p-values are indicated in the figure. Sample sizes for statistical tests are bi-to-monoA2: n = 90 and bi-to-monoA1: n = 58. For details on the boxplots, see Methods. (f) Summary of enhancer-promoter contacts of the bi-to-monoA2 genes Mecp2 (top) and Morf4l2 (bottom) in the surrounding region (+/− 550 kb) in female 9sCa WT and Msl2-KO NPCs. For visualization, the height of the contacts indicates the number of enhancer-promoter contacts divided by the maximum enhancer-promoter contact number per sample. MSL2 ChIP-seq (IP/Input) tracks and HiC data in female 9sCa WT NPCs are indicated. (g) MSL2 ChIP-seq metagene profiles (IP/Input) in male CaBl/BlCa and female 9sCa WT NPCs for bi-to-monoA1 genes showing biallelic binding at enhancers and promoters. Shadows in the profiles represent standard errors. (h) Changes in the numbers and co-accessibility scores of promoter-enhancer contacts identified by scATAC-seq analysis at bi-to-monoA2/A1 and bi-to-bi-down genes in male CaBl (left) and BlCa (right) WT and Msl2-KO NPCs. Significance is determined by nonparametric Wilcoxon rank-sum test (two-sided), exact p-values are indicated in the figure (see Supplementary Fig. 6 for details on the analysis). Sample sizes for statistical tests are as follows: male CaBl NPCs (top to bottom): n = 73, 81, 143; male BlCa NPCs (top to bottom): n = 94, 76, 348. For details on the boxplots, see Methods. (i) Summary of the Cicero co-accessibility links between the promoter of indicated genes and distal sites in the surrounding region (+/− 550 kb) in male BlCa (left) and CaBl (right) WT and Msl2-KO NPCs. The height of contacts indicates the magnitude of the Cicero co-accessibility score between the connected peaks. Peaks constructed from allele 1 (magenta) and allele 2 (cyan) are indicated (see Supplementary Fig. 6 for details on the analysis). (j) Motifs of overrepresented transcription factors (see Fig. 4a) derived from motif enrichment analysis of enhancers (left) and promoters (right) on the remaining active allele of bi-to-mono genes in male CaBl/BlCa and female 9sCa Msl2-KO NPCs (see Methods).
Extended Data Fig. 8
Extended Data Fig. 8. Transcription factor ChIP-seq and CpG methylation at bi-to-mono genes in WT and Msl2-KO NPCs.
(a-e) ChIP-seq metagene profiles of indicated transcription factors, RNA POL II, histone acetylation marks (H4K5ac and H4K12ac) and the CpG methylation frequency at the TSS and differentially methylated loci (DML, FDR<1e-5) of indicated gene subsets in male CaBl/BlCa (a-c) and female 9sCa (d,e) WT and Msl2-KO NPCs. Log2[FC] of ChIP-seq levels (IP/Input) are shown and shadows represent standard error. (a) Results obtained from standard analyses for bi-to-monoA11 genes in male CaBl (top) and bi-to-monoA2 genes in male BlCa (bottom) WT and Msl2-KO NPCs are shown. (b,c) Results obtained from allele-specific (allele 1/2) and standard analyses for bi-to-monoA2 genes in male CaBl (b) and bi-to-monoA1 genes in male BlCa (c) WT and MSL2 Msl2-KO NPCs are shown. (d,e) Results obtained from allele-specific and standard analyses for bi-to-monoA2 (d) and bi-to-monoA1 genes (e) in female 9sCa WT and Msl2-KO NPCs are shown.
Extended Data Fig. 9
Extended Data Fig. 9. Analysis of CG-motif factors and CpG methylation in WT and Msl2-KO NPCs.
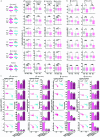
(a-c) ChIP-seq tracks of indicated transcription factors and RNA POL II at the TSSs of the bi-to-mono genes Zfp560 (a) and Slc38a1 (b) in male CaBl and BlCa and at Rab9 and Slc16a13 in female 9sCa (c) WT and Msl2-KO NPCs. Log2[FC] of ChIP-seq levels (IP/Input) are shown for all with exception of MSL2 showing the subtract of IP to input for female 9sCa NPCs. (d) Comparison of bulk H4K16ac levels between female 9sCa WT and Msl2-KO NPCs determined by standard (non-allele-separated) ChIP-seq analysis. H4K16ac ChIP-seq signal at bi-to-bi-down genes (log2[FC] < -1, top panel) and bi-to-mono genes (bi-to-monoA1/A2, bottom pane) in WT and two Msl2-KO clones is shown. Log2[FC] ChIP-seq levels (IP/Input) are depicted. Significance was scored by nonparametric Wilcoxon rank-sum test (two-sided). Exact p-values are indicated in the figure. Sample sizes for statistical tests are: bi-to-mono: n = 148 and bi-to-bi-down: n = 423. For details on the boxplots, see Methods. (e) Left: Western blot of KANSL1 levels in whole cell lysates of female 9sCa WT and Msl2-KO NPCs upon siRNA-mediated Kansl1 knockdown using 3 different siRNAs compared to scramble siRNA and untreated cells. siKansl1#3 was chosen for further experiments. ACTIN was used as a loading control. KANSL1 specific band indicated by *. Right: RT-qPCR results of Kansl1, Mecp2, Fmr1 and Slc16a13 mRNA levels in female 9sCa WT and Msl2-KO NPCs upon siRNA-mediated knockdown of Kansl1 compared to scramble siRNA. RNA levels are normalized to Rplp0 expression. Data is plotted as fold change relative to each individual scramble control. Significance was scored using parametric unpaired t-test (two-sided). Exact P-values are indicated in the figure and error bars indicate SEM. For Kansl1, Fmr1 and Slc16a13 results of n = 4 independent experiments are shown. For Mecp2 n = 3 independent experiments are shown for Msl2-KO and n = 4 for WT NPCs. (f) RT-qPCR results of Mecp2, Fmr1, Slc16a13 mRNA levels in female 9sCa WT and Msl2-KO NPCs treated for 1, 6 and 12 hrs with 100 nM BRD4 inhibitor dBET or DMSO (mock). RNA levels are shown relative to Rplp0 expression. Significance was scored using ordinary 2-way ANOVA with Sidak’s multiple comparison test. Exact P-values are as follows: Mecp2: *p = 0.0189; 0.0125; 0.0481 (from left to right), ***p = 0.0007, Fmr1: **p = 0.0054; 0.0013; 0.0078; 0.003 (from left to right), Slc16a13: **p = 0.0051; 0.0047 (from left to right), ***p = 0.0002, ****p < 0.0001, NS: p > 0.05. For Fmr1 and Slc16a13 results of n = 3 independent experiments are shown for all time points. For Mecp2 n = 3 independent experiments are shown for timepoints 1 and 6 hrs and for timepoint 12 hrs n = 3 are shown for WT and n = 2 for Msl2-KO NPCs. Error bars indicate SEM. (g) Annotation of differentially methylated loci (DML) between Msl2 KO and WT scored separately for allele 1 (top panel) and allele 2 (bottom panel) in male CaBl/BlCa and female 9sCa NPCs. On each allele, loci with upregulated and downregulated DNA methylation were scored. Percentage of total DMLs (outer rings: upregulated; inner rings: downregulated) annotated to promoters, exons or introns of genes (left panels, pink shading) or annotated to CpG islands (CpG), shores or other regions (right panels, green shading) are shown. DMLs between Msl2-KO and WT NPCs are scored using a cutoff of over 25% difference in CpG methylation frequency (FDR<1e-5). The CpG methylation frequency represents the percentage of reads containing methylated C vs total reads (see Methods). (h) Percentages of genes with significant gains (FDR<1e-5) in CpG methylation frequency upon MSL2 loss (orange) and the genes with unchanged CpG methylation frequencies (grey) at the TSS region (TSS +/− 1 kb) for bi-to-mono and bi-to-bi-down genes in male CaBl/BlCa and female 9sCa NPCs. (i) Anticorrelation between monoallelic CG-motif factors (NRF1, SP1, KANSL1 and KANSL3) binding and gain in CpG methylation in male BlCa (top) and female 9sCa (bottom) Msl2-KO NPCs. Top panels: Violin plots showing the log2[FC] of CG-motif factors binding signal at allele 2 versus allele 1 illustrating the monoallelic bias for CG-motif factors binding in Msl2-KO cells. Bottom panels: Violin plots showing the CpG methylation frequency in the overlapped sites as indicated in the top panel. Allele-1-biased (magenta) and allele-2-biased genes (cyan) are indicated. For the calculation of the anticorrelation and details on the boxplots, see Methods. Graphic schemes are created with BioRender.com. Source Data
Extended Data Fig. 10
Extended Data Fig. 10. Allelic DNMT3A/B ChIP-seq and CpG methylation in WT and Msl2-KO NPCs and in vivo data.
(a) CpG methylation tracks at the TSS regions of Slc38a1 in male CaBl/BlCa and Fmr1, Mecp2, Zfp26 and Zfp607a in female 9sCa WT and Msl2-KO NPCs. (b) Log2[FC](KO/WT) of allelic KANSL3 ChIP-seq signal (IP/Input) at genes consistent to both male BlCa and CaBl with reverse allele change (Fig. 2cd) in male BlCa and CaBl NPCs. Loss of KANSL3 binding signal on the paternal allele (top; allele 2 in BlCa; allele 1 in CaBl; n = 16) or maternal allele (bottom; allele 1 in BlCa; allele 2 in CaBl; n = 30) is shown. Significance is determined by nonparametric Wilcoxon rank-sum test (two-sided) and exact p-values are indicated in the figure. For details on the boxplots, see Methods. (c) DNMT3A (left) and DNMT3B (right) ChIP-seq binding profiles at the midpoint of highly (red, n = 11522), lowly (orange, n = 26,303) and unmethylated (black, n = 16844) regions in female 9sCa WT (top) and Msl2-KO1 NPC clone (bottom). ChIP-seq signal is normalized by library size. The methylation status was defined using BS-seq data. Highly methylated represents CpG methylation frequency over 95%, lowly represents CpG methylation frequency between 10% to 50%, and no methylation represents CpG methylation frequency less than 10% (see Methods). (d,e) Allelic binding signal of DNMT3A (left) and DNMT3B (right) at the TSS (TSS +/− 2 kb) of bi-to-monoA2 (d) and bi-to-monoA1 (e) genes in female 9sCa WT and Msl2-KO clones 1 and 2. ChIP-seq signal is normalized by library size. Significance was scored by nonparametric Wilcoxon rank-sum test (two-sided), exact p-values are indicated in the figure. Sample sizes for statistical tests are: bi-to-monoA2: n = 90 and bi-to-monoA1 n = 58. For details on the analysis and the boxplots, see Methods. (f) Top: schematic illustration of in vitro neuronal differentiation protocol of NPCs. NPCs were differentiated into neurons in N2B27 medium supplemented only with FGF−2 (5 ng/ml) for 7 days, after which FGF was removed completely for neuronal maturation for 7 days. Bottom panel: RT-qPCR results showing fold-change of RNA expression of neuronal genes in male CaBl/BlCa WT and Msl2-KO NPCs during differentiation and maturation from day 0 (d0) to day 14 (d14) compared to WT on d0. RT-qPCR data were normalized to Rplp0. Data are represented as mean values +/−SEM, n = 3 independent experiments. Time vs. Genotype interaction significance was scored by Two-way ANOVA and exact p-values are indicated in the figure. (g) Msl2 RNA-seq tracks of whole brains (n = 3, Rep1-3) isolated from female Msl2 +/+ or Msl2 −/− E18.5 embryos. RNA signal after the deleted region in exon 1 is absent until the next gene Ppp2r3a which transcribes from the reverse strand. * depicts an alternative exon at the 5’UTR of Msl2 transcript isoform 2. (h) Sex and genotype percentage of Msl2 +/+ or Msl2 −/− E18.5 embryos with severe, mild or no phenotypes. The proportion of female embryos with phenotypic abnormalities was significantly higher than that of males. Significance was scored by one-sided Fisher’s exact test. Details are provided in Source Data Fig. 5. (i) Scheme showing that insufficient expression of the haploinsufficient gene BCL11A causes Dias-Logan syndrome in human patients. Half gene dosage of BCL11A can result in variable phenotypic frequencies such as autism spectrum disorder, microcephaly, facial dysmorphism or intellectual disabilities. (j) Expression changes of bi-to-bi-down genes in male CaBl/BlCa and female CaBl/9sCa Msl2-KO NPCs in brain and placenta isolated from Msl2−/− E18.5 embryos. Log2[FC]s (Msl2 KO/WT) in standard analysis of NPCs, brain and placenta were used to generate the heatmap. Numbers above the heatmap indicate the ratio of bi-to-bi-down genes that showed consistent changes in mouse brain compared to the total number of bi-to-bi-down genes per cell line. Colour key indicates log2[FC](KO/WT). Source Data

References

    1. Weinstein LS. The role of tissue-specific imprinting as a source of phenotypic heterogeneity in human disease. Biol. Psychiatry. 2001;50:927–931. doi: 10.1016/S0006-3223(01)01295-1. - DOI - PubMed
    1. Ferrón SR, et al. Postnatal loss of Dlk1 imprinting in stem cells and niche astrocytes regulates neurogenesis. Nature. 2011;475:381–385. doi: 10.1038/nature10229. - DOI - PMC - PubMed
    1. Collins RL, et al. A cross-disorder dosage sensitivity map of the human genome. Cell. 2022;185:3041–3055. doi: 10.1016/j.cell.2022.06.036. - DOI - PMC - PubMed
    1. Eckersley-Maslin MA, et al. Random monoallelic gene expression increases upon embryonic stem cell differentiation. Dev. Cell. 2014;28:351–365. doi: 10.1016/j.devcel.2014.01.017. - DOI - PMC - PubMed
    1. Gendrel A-V, et al. Developmental dynamics and disease potential of random monoallelic gene expression. Dev. Cell. 2014;28:366–380. doi: 10.1016/j.devcel.2014.01.016. - DOI - PubMed

Publication types