. 2023 Dec;624(7991):433-441.
doi: 10.1038/s41586-023-06793-z. Epub 2023 Nov 29.

FOXP3 recognizes microsatellites and bridges DNA through multimerization

Affiliations

FOXP3 recognizes microsatellites and bridges DNA through multimerization

Wenxiang Zhang et al. Nature. 2023 Dec.

Abstract

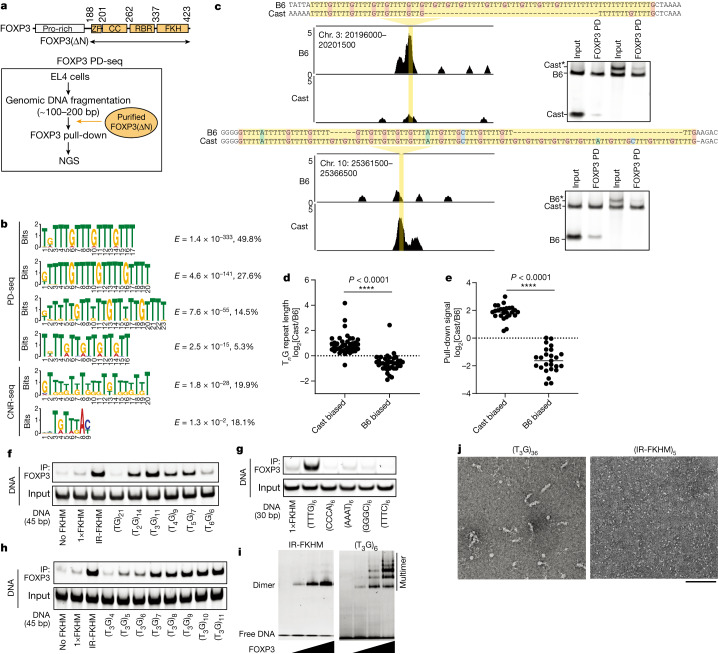
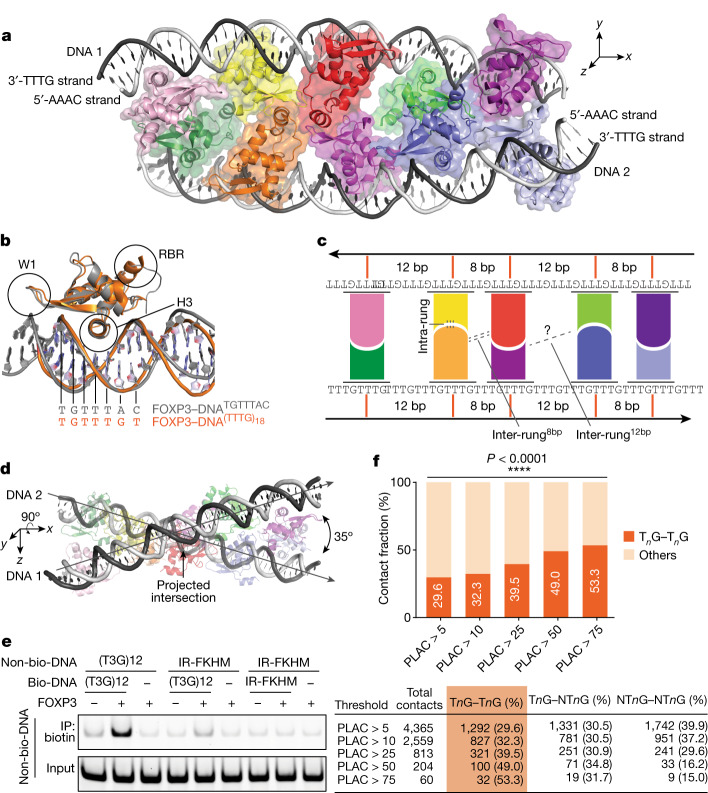
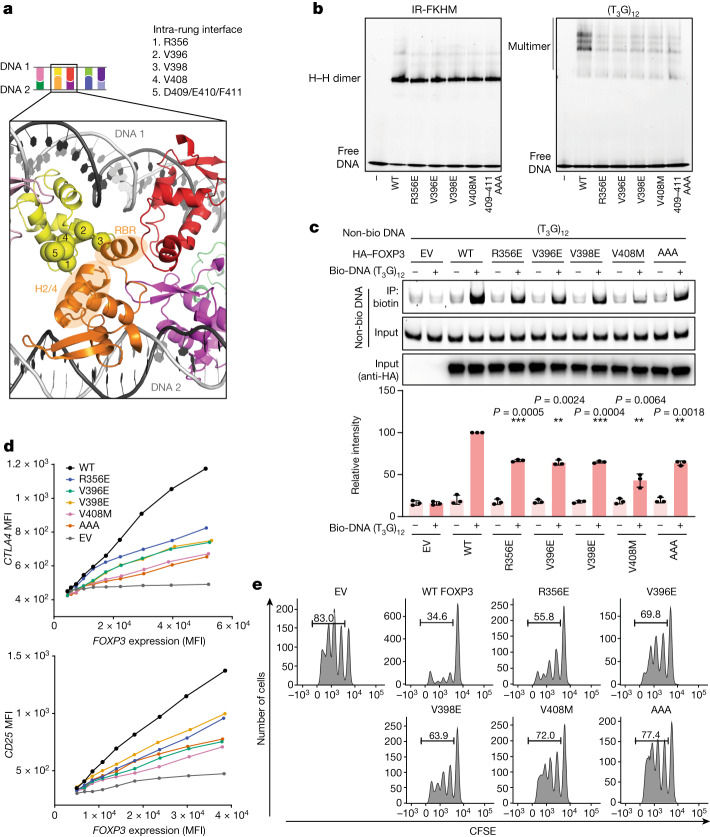
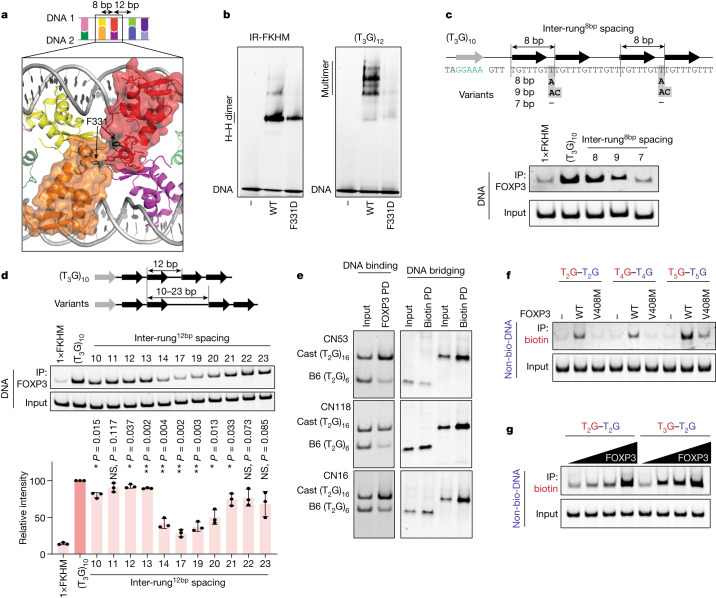
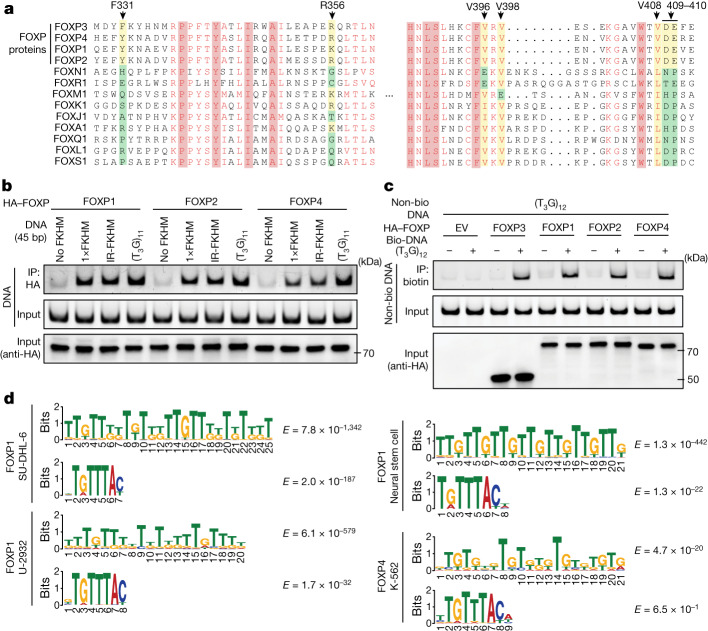
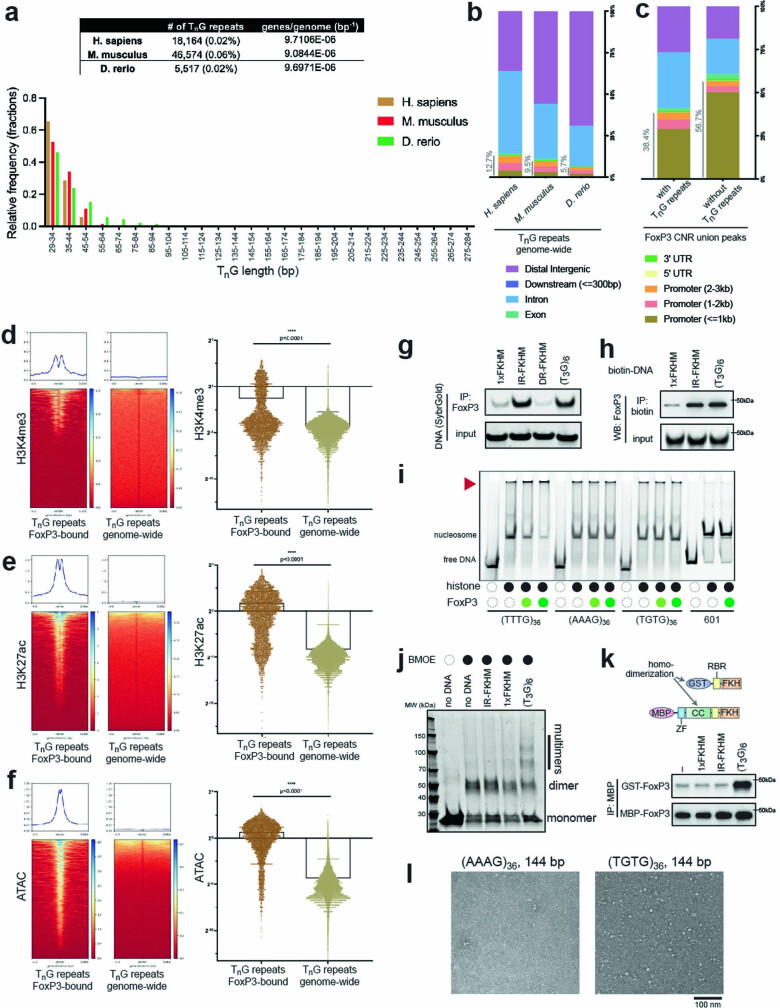
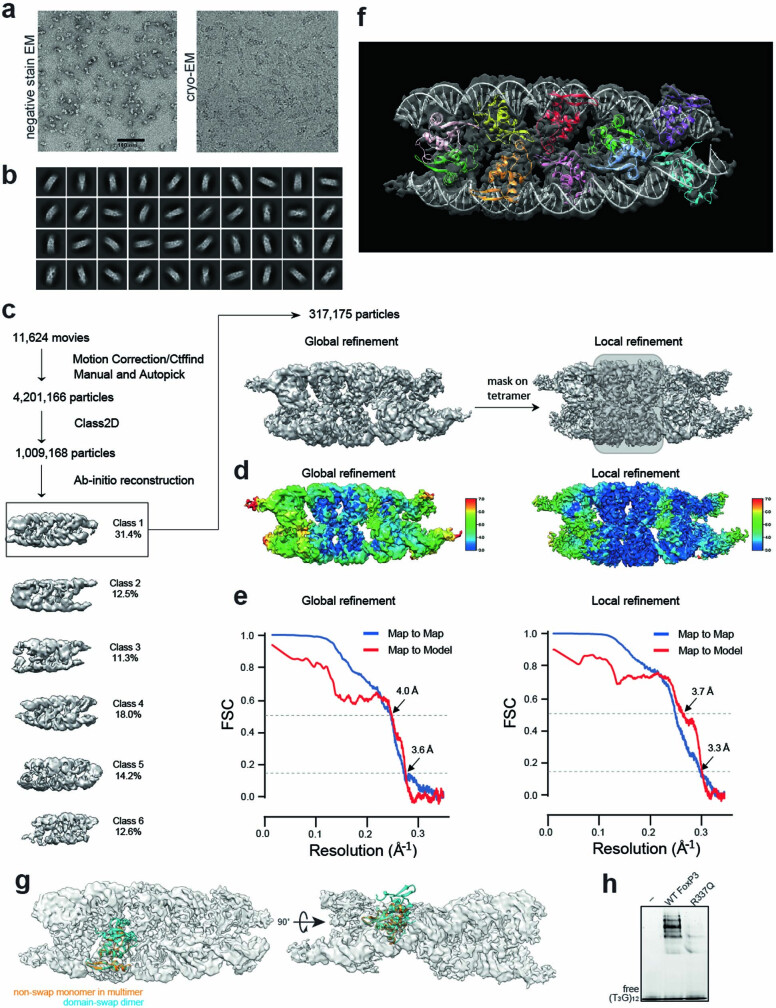
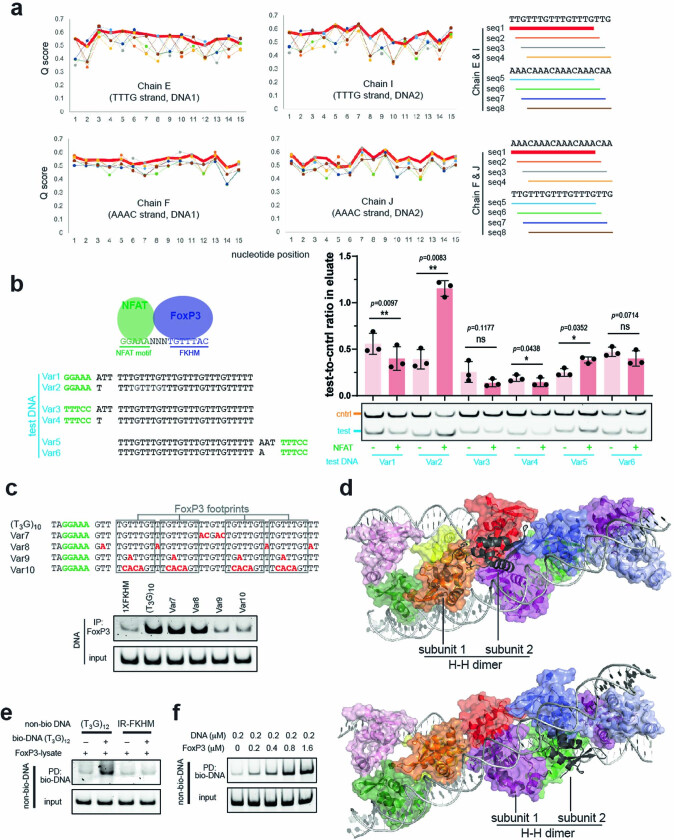
FOXP3 is a transcription factor that is essential for the development of regulatory T cells, a branch of T cells that suppress excessive inflammation and autoimmunity1-5. However, the molecular mechanisms of FOXP3 remain unclear. Here we here show that FOXP3 uses the forkhead domain-a DNA-binding domain that is commonly thought to function as a monomer or dimer-to form a higher-order multimer after binding to TnG repeat microsatellites. The cryo-electron microscopy structure of FOXP3 in a complex with T3G repeats reveals a ladder-like architecture, whereby two double-stranded DNA molecules form the two 'side rails' bridged by five pairs of FOXP3 molecules, with each pair forming a 'rung'. Each FOXP3 subunit occupies TGTTTGT within the repeats in a manner that is indistinguishable from that of FOXP3 bound to the forkhead consensus motif (TGTTTAC). Mutations in the intra-rung interface impair TnG repeat recognition, DNA bridging and the cellular functions of FOXP3, all without affecting binding to the forkhead consensus motif. FOXP3 can tolerate variable inter-rung spacings, explaining its broad specificity for TnG-repeat-like sequences in vivo and in vitro. Both FOXP3 orthologues and paralogues show similar TnG repeat recognition and DNA bridging. These findings therefore reveal a mode of DNA recognition that involves transcription factor homomultimerization and DNA bridging, and further implicates microsatellites in transcriptional regulation and diseases.


Conflict of interest statement

The authors declare no competing interests.

Figures

Fig. 1
Fig. 1. FOXP3 recognizes TnG repeat microsatellites.
a, The FOXP3 domain architecture and schematic of FOXP3 PD-seq. CC, coiled-coil domain; ZF, zinc finger domain. b, De novo motif analysis of FOXP3 PD-seq peaks (n = 21,605) and CNR-seq peaks (n = 6,655) using MEME-ChIP and STREME. The E score and the percentage of peaks containing the given motif are shown on the right. See Supplementary Table 1a,b for the comprehensive list of motifs for PD-seq, CNR-seq, and ChIP–seq data,. c, Allelic imbalance in FOXP3 binding in vivo. Left, genome browser view of CNR-seq, showing B6-biased (top) and Cast-biased (bottom) peaks. B6 genomic coordinates are shown at the top left. Right, B6 and Cast DNA oligos were mixed 1:1 and analysed using FOXP3(∆N) pull-down and gel analysis. Cast* and B6* represent oligos extended with a random sequence (Supplementary Table 2b) to reverse their length bias. Chr., chromosome. d, TnG repeat length comparison between Cast and B6 mice at 76 loci, showing allelic bias in c. Repeat lengths were measured in nucleotides. n = 39 (Cast-biased loci) and n = 37 (B6-biased loci) were used for this comparison. Statistical analysis was performed using two-tailed unpaired t-tests; ****P < 0.0001. e, Allelic imbalance in FOXP3 binding in vitro. A total of 50 pairs of Cast and B6 sequences (Supplementary Table 2a) was chosen from the 76 pairs in d and analysed using FOXP3(∆N) pull-down. For each pair, the recovery rate of the Cast and B6 DNA was measured and their ratios were plotted. Each datapoint represents the average of the two pull-downs. Statistical analysis was performed using two-tailed unpaired t-tests. f, FOXP3–DNA interaction was measured using FOXP3(∆N) pull-down. DNA containing a random sequence (no FKHM), a single FKHM (1×FKHM), IR-FKHM or tandem repeats of TnG (n = 1–6) were used. All DNAs were 45 bp long. g, FOXP3–DNA interaction using DNAs (30 bp) containing various tandem repeats, including T3G repeats. h, FOXP3–DNA interaction using DNAs (45 bp) containing 4–11 repeats of T3G. i, Native gel shift assay of MBP-tagged FOXP3(∆N) (0–0.4 μM) with DNA (30 bp, 0.05 μM) containing IR-FKHM or (T3G)6. j, Representative negative-stain EM images of FOXP3(∆N) in a complex with (T3G)36 and (IR-FKHM)5. Both DNAs were 144 bp long. Scale bar, 100 nm.
Fig. 2
Fig. 2. FOXP3 forms a ladder-like multimer after binding to T3G repeat DNA.
a, The cryo-EM structure of a FOXP3(∆N) decamer in a complex with two DNA molecules (grey) containing (T3G)18. Each of the ten FOXP3 subunits are coloured differently. b, Comparison of a representative FOXP3(∆N) subunit from a (orange) with a FOXP3(∆N) subunit from the head-to-head dimeric structure (grey; Protein Data Bank (PDB): 7TDX). H3 recognizes the DNA sequence (TGTTTAC in the head-to-head dimer, TGTTTGT in the ladder-like multimer) by inserting it into the major groove. c, Schematic of the ladder-like architecture of FOXP3 on T3G-repeat DNA. d, The skew relationship between the two DNA molecules, which is evident when looking down the y axis of a. e, DNA-bridging assay. Biotinylated DNA (bio-DNA, 82 bp) and non-biotinylated DNA (non-bio-DNA, 60 bp) were mixed at a 1:1 ratio (0.1 μM each), incubated with FOXP3(∆N) (0.4 μM) and processed for Streptavidin pull-down before gel analysis. Non-biotinylated DNA in the eluate was visualized by SybrGold staining. f, Chromatin contacts at FOXP3-bound anchors identified using Hi-C-seq and PLAC-seq. Contacts with a frequency of >5 in the WT Treg cell Hi-C analysis and connected by two FOXP3-bound anchors were analysed with an increasing FOXP3 PLAC-seq count threshold. The percentage of the unique contacts mediated by two TnG anchors (out of all unique contacts between two FOXP3-bound anchors) is indicated. All TnG–TnG contacts were between two distinct 10 kb anchor bins. NTnG, non-TnG.
Fig. 3
Fig. 3. Intra-rung interactions are essential for TnG repeat recognition, DNA bridging and the cellular functions of FOXP3.
a, The intra-rung interface. The α-carbons of Arg356, Val396, Val398, Val408 and Asp409/Glu410/Phe411 are shown as spheres. These residues on the yellow subunit interact with RBR and H2/H4 loop of the orange subunit. The subunit colours are as described in Fig. 2a. b, The effect of intra-rung interface mutations on DNA binding. MBP-tagged FOXP3(∆N) (0.4 μM) was incubated with IR-FKHM or (T3G)12 (60 bp for both) and analysed using a native gel shift assay. c, The effect of intra-rung interface mutations on DNA bridging. FOXP3 (or empty vector (EV)) was expressed in HEK293T cells and the lysate was incubated with a mixture of biotinylated and non-biotinylated DNA (1:1 ratio) and then analysed using Streptavidin pull-down and gel analysis. The relative levels of non-biotinylated DNA co-purified with biotinylated DNA were quantified from three independent pull-downs. The difference was compared with the WT in the presence of biotinylated DNA. Statistical analysis was performed using two-tailed paired t-tests; ***P < 0.001, **P < 0.005. d, Transcriptional activity of FOXP3. CD4+ T cells were retrovirally transduced to express FOXP3, and its transcriptional activity was analysed by measuring the protein levels of the known target genes CTLA4 and CD25 using fluorescence-activated cell sorting (FACS). FOXP3 levels were measured on the basis of Thy1.1 expression, which is under the control of IRES, encoded by the bicistronic FOXP3 mRNA. MFI, mean fluorescence intensity. e, T cell suppression assay of intra-rung interface mutations. FOXP3-transduced T cells (suppressors) were mixed with naive T cells (responders) at a 1:2 ratio and the effect of the suppressor cells on the proliferation of the responder cells was measured on the basis of the carboxyfluorescein succinimidyl ester (CFSE) dilution profile of the responder T cells.
Fig. 4
Fig. 4. Architectural flexibility of the ladder-like assembly broadens the sequence specificity of FOXP3.
a, Structure highlighting the inter-rung8bp interactions between the orange and red subunits (in surface representation). The interactions are primarily between RBRs, where Phe331 resides. b, The effect of the inter-rung8bp mutation (F331D) on the FOXP3–DNA interaction was analysed using FOXP3(∆N) pull-down. c, The effect of inter-rung8bp spacings on FOXP3 binding was determined using FOXP3(∆N) pull-down. Both inter-rung8bp gap nucleotides were changed from T in (T3G)10 to A (8 bp spacing), to AC (9 bp spacing) or to no nucleotide (7 bp spacing). The black arrows indicate FOXP3 footprints. The grey arrow and green-coloured nucleotides indicate the NFAT-binding site. NFAT interacts with FOXP3 and helps in fixing the FOXP3–DNA register, which was necessary to examine the effect of DNA sequence variations at or between the FOXP3 footprints. d, The effect of inter-rung12bp spacings on FOXP3 binding was analysed using FOXP3(∆N) pull-down. The inter-rung12bp spacing was changed from 12 bp in (T3G)10 to 10–23 bp (the sequences are provided in Supplementary Table 2b). The average recovery rate of DNA from three independent pull-downs was plotted. Statistical analysis was performed using two-tailed paired t-tests in comparison to (T3G)10; *P < 0.05; NS, P > 0.05. e, Comparison of Cast and B6 sequences in FOXP3 binding (left) and DNA bridging (right). Three pairs of sequences at the loci CN53, CN118 and CN16 with Cast bias in the CNR-seq analysis were compared (Supplementary Table 2a) using FOXP3(∆N) pull-down. f, DNA bridging between (T2G)14 and (T2G)14, between (T4G)9 and (T4G)9, and between (T5G)7 and (T5G)7 in the presence of WT FOXP3 or the IPEX mutant V408M. Biotinylated and non-biotinylated DNA are coloured red and blue, respectively. g, DNA bridging between (T2G)14 and (T2G)14, and between (T2G)14 and (T3G)11 by FOXP3 (0–0.4 μM).
Fig. 5
Fig. 5. TnG microsatellite recognition is conserved among FOXP3 orthologues and paralogues.
a, Sequence alignment of forkhead TFs. Residues equivalent to the key interface residues in mouse FOXP3 (arrow on top) were highlighted in yellow (when similar to the mouse residues) or green (when dissimilar). b, The DNA-binding activity of FOXP1, FOXP2 and FOXP4. HA-tagged FOXP1, FOXP2 and FOXP4 were transiently expressed in HEK293T cells and purified by anti-HA immunoprecipitation. Equivalent amounts of the indicated DNAs (all 45 bp) were added to FOXP1/2/4-bound beads and further purified before analysis using gel analysis (SybrGold). c, The DNA-bridging activity of FOXP1, FOXP2 and FOXP4. Experiments were performed as described in Fig. 3c using HEK293T lysate expressing HA-tagged FOXP TFs. d, De novo motif analysis of FOXP1 and FOXP4 ChIP–seq peaks from a published database,. The comprehensive list and their references are provided in Supplementary Table 1c.
Extended Data Fig. 1
Extended Data Fig. 1. Analysis of T3G repeats in the genome and FoxP3 multimerization on T3G repeats.
a. TnG repeat-like sequences in the genomes of H. sapiens, M. musculus and D. rerio. Sequences that match the TnG repeat-like motif (29 nt motif from FoxP3 CNR overlap peaks, see Supplementary Table 1b) were identified using FIMO (p = 0.05, see Methods). Genomic percentage of TnG repeat-like sequences (in parenthesis) was the number of TnG repeat regions multiplied by the average size of the repeats (31, 33 and 38 bp for H. sapiens, M. musculus and D. rerio, respectively), divided by the genome size (3.2, 2.7 and 1.4 billion bp, respectively). Below: length distribution of the TnG repeat-like sequences. Genes-to-genome size ratio was calculated by dividing the number of genes used in the feature annotation (31,074, 24,528 and 13,576 in H. sapiens, M. musculus and D. rerio) by the genome size. b. Distribution of TnG repeat-like sequences in the genomes of H. sapiens, M. musculus and D. rerio relative to Transcription Start Sites (TSSs). c. Distribution of CNR union peaks (union of Rudensky CNR peaks and Dixon CNR peaks, n = 9,062) relative to TSSs. CNR union peaks with and without TnG repeat-like sequences (n = 3,301 and 5,761, respectively) were identified using FIMO (p = 0.05) as in (a). d-f. Comparison of (d) H3K4me3-ChIP, (e) H3K27ac-ChIP and (f) ATAC signal around the TnG repeat-like sequences that overlap with FoxP3 CNR union peaks vs. those genome-wide in thymic Tregs (n = 4,837 peaks and 41,889 peaks respectively). See Extended Data Fig. 4a–c for pre-thymic Tregs, which showed that high levels of H3K4me3, H3K27ac and ATAC signals were maintained prior to FoxP3 expression. TnG repeats in the blacklist were removed. Right: ChIP/ATAC signal was averaged over +/− 500 bp around the TnG repeat-like sequences. Two-tailed unpaired t-tests. ****, p <  0.0001. g. DNA sequence specificity of FoxP3 as measured by FoxP3 pull-down. HA-tagged, full-length FoxP3 was transiently expressed in HEK293T cells and purified by anti-HA IP. Equivalent amounts of indicated DNAs (30-31 bp) were added to FoxP3-bound beads and further purified by anti-HA IP prior to gel analysis. h. DNA sequence specificity of FoxP3 as measured by DNA pull-down. Equivalent amounts of biotinylated DNAs were mixed with FoxP3-expressing 293 T lysate and were subjected to streptavidin pull-down. Co-purified FoxP3 was analysed by anti-HA WB. i. FoxP3 binding to nucleosomal DNA as measured by native gel-shift assay. Indicated DNA was incubated with the histone octamer at 1:1 molar ratio (black circle), followed by incubation with FoxP3 (0.2 or 0.4 μM for light and dark green circles, respectively). Empty dotted circles indicate no histone or FoxP3. Sybrgold stain was used for visualization. With an increasing concentration of FoxP3, the intensity of the nucleosomal TTTG repeat decreased, while the signal in the gel well (red arrow) increased. Such changes were not observed with other DNAs. j. BMOE crosslinking of FoxP3∆N with and without DNA. FoxP3∆N can only form multimers on (T3G)6 DNA. k. Multimerization analysis of FoxP3, as measured by co-purification of FoxP3 with different tags. GST- and MBP-tagged FoxP3 were incubated together in the presence and absence of indicated DNA and were subjected to MBP pull-down, followed by WB analysis of GST-FoxP3 in eluate. Note that GST replaced the CC domain in FoxP3, disallowing hetero-dimerization between MBP-FoxP3 and GST-FoxP3. Thus, co-purification of these two proteins in the presence of T3G repeats suggests DNA sequence-dependent multimerization of the FoxP3 homodimer. l. Representative negative-stain EM images of FoxP3∆N in complex with (AAAG)36 (left) and (TGTG)36 (right).
Extended Data Fig. 2
Extended Data Fig. 2. Cryo-EM structure of the FoxP3∆N–(T3G)18 complex.
a. Representative negative-stain EM (left) and cryo-EM images (right) of FoxP3∆N multimers on (T3G)18 DNA. b. 2D classes chosen for 3D reconstruction. c. Cryo-EM image processing workflow. See details in Methods. d. Local resolution for the maps of global refinement (left) and local refinement with a mask covering the central four subunits of FoxP3 (right). Local resolution was calculated by CryoSPARC. Resolution range was indicated according to the colour bar. e. Fourier shell correlation (FSC) curve for global refinement (left) and local refinement (right). Map-to-Map FSC curve was calculated between the two independently refined half-maps after masking (blue line), and the overall resolution was determined by gold standard FSC = 0.143 criterion. Map-to-Model FSC was calculated between the refined atomic models and maps (red line). f. Cryo-EM map and ribbon model of FoxP3∆N decamer in complex with two (T3G)18 DNAs (PDB: 8SRP, EMDB: 40737). DNA molecules are coloured grey. Individual FoxP3 monomers are coloured differently. g. Superposition of the domain-swap dimeric structure of FoxP3 (cyan, PDB:4WK8) onto any subunit of the FoxP3 multimeric structure (represented here by the orange subunit) by aligning the common portions of FoxP3 reveals that the domain-swap dimer is incompatible with the density map. h. Native gel shift analysis of MBP-tagged FoxP3∆N (WT or R337Q, 0.4 μM) with (T3G)12 DNA (0.05 μM). Note that R337Q induces domain-swap dimerization.
Extended Data Fig. 3
Extended Data Fig. 3. DNA sequence and conformational analysis.
a. DNA sequence assignment by Q-score analysis using mapQ. For each of the four DNA strands, eight possible sequence alignments (right) were tested against the local refinement map. The sequence alignment showing the highest overall score was highlighted with a thick red line. The best sequence alignments for all four DNA strands were consistent with each other and were used for cryo-EM reconstruction. b. Experimental validation of FoxP3–DNA registers using NFAT–FoxP3 cooperativity analysis. This assay utilizes the FoxP3 interaction partner NFAT, which assists FoxP3 binding to DNA only when their binding sites are 3 bp apart in one particular orientation (as in the schematic). To investigate FoxP3 footprints on T3G repeat DNA, we varied the position and orientation of NFAT consensus sequence (GGAAA, green) relative to T3G repeats (Var1-6), and performed FoxP3 pull-down. An internal control DNA (cntrl, harbouring the NFAT motif followed by FKHM with 3 nt gap) was used to normalize the test DNA (Var1-6) pull-down efficiency. Only DNA with a single nucleotide gap between GGAAA and TTTG (Var2) showed a positive effect of NFAT on the FoxP3–DNA interaction. This suggests that the most upstream FoxP3 subunit recognizes TGTTTGT. Two-tailed paired t-tests, comparing with and without NFAT. p < 0.005 for **, p < 0.05 for * and p > 0.05 for ns. c. FoxP3 interaction with (T3G)10 variants. Variations in DNA sequence outside the FoxP3 footprints were tolerated (Var7 and Var8), but those within the footprints (Var9 and Var10) were not. d. Comparison of the inter-subunit interactions in FoxP3 decamer on TnG repeats vs head-to-head (H-H) dimer on IR-FKHM (PDB:7TDX). Superposition of the H-H dimer (dark grey) onto any of the ten subunits in the decamer structure showed distinct modes of inter-subunit interactions. Shown are two examples where subunit 1 of the H-H dimer was aligned to orange (top) or magenta (bottom) subunits of the decamer, showing that subunit 2 of the H-H dimer did not align with any of the decamer subunits. e. DNA bridging assay using FoxP3 expressed in 293 T cells. Biotinylated and non-biotinylated DNA (82 and 60 bp, respectively) were mixed at 1:1 ratio and further incubated with 293 T lysates expressing HA-tagged FoxP3, followed by streptavidin pull-down and gel analysis of non-biotinylated DNA by SybrGold staining. f. DNA bridging assay using an increasing concentration of purified FoxP3∆N. 0.1 μM each of biotinylated and non-biotinylated (T3G)12 DNAs were used. FoxP3 concentrations are indicated at the bottom.
Extended Data Fig. 4
Extended Data Fig. 4. FoxP3 can bridge TnG repeat-containing sites in vivo.
a-c. Comparison of (a) H3K4me3-ChIP, (b) ATAC and (c) H3K27ac-ChIP signal around the CNR union peaks with and without TnG repeat-like sequences in pre-thymic Tregs (pre-tTregs) and thymic Tregs (tTregs) (n = 3,301 peaks and 5,761 peaks, respectively). Right: ChIP/ATAC signal was averaged over +/− 500 bp around the CNR peak summits. Two-tailed unpaired t-tests. ****, p < 0.0001. d. FoxP3-dependence of the chromatin contacts at FoxP3-bound TnG anchors in Fig. 2f. FoxP3-bound TnG anchors were defined as anchors that overlap with FoxP3 CNR peaks with TnG repeat-like sequences. Contacts with frequency>5 in WT Treg HiC and connected by two TnG anchors were analysed with an increasing FoxP3 PLAC-seq count threshold. For each contact, log2 foldchange of HiC counts from WT to FoxP3 knock-out Treg were plotted. Contacts with FDR < 10 were coloured red. The majority of the TnG–TnG contacts were less frequent in FoxP3 knock-out than in WT Tregs, although smaller fractions (10-15%) showed statistically significant FoxP3 dependence (FDR < 10), as previously reported. n = 4365, 2559, 813, 204 and 60 anchors respectively. Mean ± SD were shown in black and blue lines. See also Supplementary Table 3. e. Fraction of the FoxP3-bound TnG anchors from Fig. 2f that overlap with previously published Treg EPL anchors.
Extended Data Fig. 5
Extended Data Fig. 5. Characterization of intra-rung interface mutant FoxP3.
a. mRNA-seq heatmap analysis. CD4+ T cells were transduced and sorted to express FoxP3 as in Fig. 3d and were subjected to mRNA-seq. Top 100 genes showing the most significant difference between WT FoxP3 and EV were chosen for the evaluation of individual mutants. All four mutants were impaired in transcriptional functions, albeit to varying extents. The level of FoxP3 was equivalent for WT and all mutants. A few genes previously reported to be FoxP3-dependent were indicated in larger fonts. Note that V398E was not tested due to its negative effect on NFAT binding in (e). b. ChIP-seq of HA-tagged FoxP3. Cells were transduced as in Fig. 3d and were subjected to anti-HA ChIP-seq. WT FoxP3 bound peaks were identified using MACS2 (n = 8,607, p < 0.01), and heatmaps of the ChIP signal were generated for each mutant at the WT peak locations. Below: averaged intensity of ChIP signal within 0.5 kb of the WT peak summit. Peaks with and without TnG repeats (n = 1,900 peaks and 6,707 peaks, respectively) were compared. Two-tailed paired t-tests, comparing mutants to WT. p < 0.0001 for ****, p < 0.001 for *** and p < 0.005 for **. c. Nuclear localization of WT FoxP3 and intra-rung interface mutants. HA-tagged FoxP3 was transiently expressed in A549 cells and was subjected to anti-HA immunofluorescent (yellow) analysis. Nuclei were shown with DAPI (blue) staining. d. Expression levels of WT FoxP3 and intra-rung mutants in A549 cells. e. Effect of the intra-rung mutations on the NFAT–FoxP3 interaction, as measured by native gel shift assay. FoxP3 (0.1 μM) was incubated with DNA harbouring IR-FKHM and the NFAT site (with a 3-bp gap as in Extended Data Fig. 3b, 0.05 μM). NFAT (0.1 μM) was added to the mixture to monitor formation of the ternary complex NFAT–FoxP3–DNA. Note that V398E showed slight but reproducible reduction in NFAT binding.
Extended Data Fig. 6
Extended Data Fig. 6. Multimerization on TnG repeats is conserved in FoxP3 orthologs and paralogs.
a. TnG repeats DNA-binding activity of FoxP3 with mutations in RBR. All seven RBR mutations previously shown to disrupt the head-to-head dimerization disrupted (T3G)12 binding. b. Effect of inter-rung12bp spacing variations on FoxP3-mediated DNA bridging. Non-biotinylated DNAs in Fig. 4d were mixed with biotinylated (T3G)10 and FoxP3∆N (0.2 μM) prior to streptavidin pull-down and gel analysis. Relative level of non-biotinylated DNA co-purified with biotinylated DNA was quantitated from three independent pull-downs. Two-tailed paired t-tests, in comparison to (T3G)10. p < 0.001 for ***, p < 0.05 for * and p > 0.05 for ns. c. DNA-bridging activity of FoxP3 with different combinations of TnG repeats. Biotinylated-DNA (red) and non-biotinylated DNA (blue) were mixed at 1:1 ratio and were incubated with FoxP3∆N (0.2 μM) prior to streptavidin pull-down and gel analysis of non-biotinylated DNA. T2G, T4G and T5G repeats bridged better with T3G repeats than with themselves. d. DNA-binding activity of FoxP3 orthologs with indicated DNA. Experiments were performed as in Fig. 5b. e. DNA-bridging activity of FoxP3 orthologs. Experiments were performed as in Fig. 5c. f. Sequence alignment of FoxP3 orthologs from different species, showing conservation of the key interface residues (yellow highlight, arrows on top with the residue identities in M. musculus FoxP3). g. DNA-binding activity of FoxP3 paralogs with TnG repeats (n = 1-4). Experiments were performed as in Fig. 5b.

Update of

Comment in

References

    1. Brunkow, M. E. et al. Disruption of a new forkhead/winged-helix protein, scurfin, results in the fatal lymphoproliferative disorder of the scurfy mouse. Nat. Genet.27, 68–73 (2001). 10.1038/83784 - DOI - PubMed
    1. Bennett, C. L. et al. The immune dysregulation, polyendocrinopathy, enteropathy, X-linked syndrome (IPEX) is caused by mutations of FOXP3. Nat. Genet.27, 20–21 (2001). 10.1038/83713 - DOI - PubMed
    1. Fontenot, J. D., Gavin, M. A. & Rudensky, A. Y. Foxp3 programs the development and function of CD4+CD25+ regulatory T cells. Nat. Immunol.4, 330–336 (2003). 10.1038/ni904 - DOI - PubMed
    1. Hori, S., Nomura, T. & Sakaguchi, S. Control of regulatory T cell development by the transcription factor Foxp3. Science299, 1057–1061 (2003). 10.1126/science.1079490 - DOI - PubMed
    1. Chatila, T. A. et al. JM2, encoding a fork head-related protein, is mutated in X-linked autoimmunity-allergic disregulation syndrome. J. Clin. Invest.106, R75–R81 (2000). 10.1172/JCI11679 - DOI - PMC - PubMed

Publication types