Comparative Study
. 2024 Jan;625(7996):735-742.
doi: 10.1038/s41586-023-06798-8. Epub 2023 Nov 29.

Identification of constrained sequence elements across 239 primate genomes

Lukas F K Kuderna #  1 Jacob C Ulirsch #  1 Sabrina Rashid #  1 Mohamed Ameen  1 Laksshman Sundaram  1 Glenn Hickey  2 Anthony J Cox  1 Hong Gao  1 Arvind Kumar  1 Francois Aguet  1 Matthew J Christmas  3 Hiram Clawson  2 Maximilian Haeussler  2 Mareike C Janiak  4 Martin Kuhlwilm  5   6 Joseph D Orkin  7 Thomas Bataillon  8 Shivakumara Manu  9   10 Alejandro Valenzuela  11 Juraj Bergman  8   12 Marjolaine Rouselle  8 Felipe Ennes Silva  13   14 Lidia Agueda  15 Julie Blanc  15 Marta Gut  15 Dorien de Vries  4 Ian Goodhead  4 R Alan Harris  16 Muthuswamy Raveendran  16 Axel Jensen  17 Idriss S Chuma  18 Julie E Horvath  19   20   21   22   23 Christina Hvilsom  24 David Juan  11 Peter Frandsen  24 Joshua G Schraiber  1 Fabiano R de Melo  25 Fabrício Bertuol  26 Hazel Byrne  27 Iracilda Sampaio  28 Izeni Farias  26 João Valsecchi  29   30   31 Malu Messias  32 Maria N F da Silva  33 Mihir Trivedi  10 Rogerio Rossi  34 Tomas Hrbek  26   35 Nicole Andriaholinirina  36 Clément J Rabarivola  36 Alphonse Zaramody  36 Clifford J Jolly  37 Jane Phillips-Conroy  38 Gregory Wilkerson  39 Christian Abee  39 Joe H Simmons  39 Eduardo Fernandez-Duque  40 Sree Kanthaswamy  41   42 Fekadu Shiferaw  43 Dongdong Wu  44 Long Zhou  45 Yong Shao  44 Guojie Zhang  44   45   46   47   48 Julius D Keyyu  49 Sascha Knauf  50   51 Minh D Le  52 Esther Lizano  11   53 Stefan Merker  54 Arcadi Navarro  11   55   56   57   58 Tilo Nadler  59 Chiea Chuen Khor  60 Jessica Lee  61 Patrick Tan  60   62   63 Weng Khong Lim  62   63   64 Andrew C Kitchener  65   66 Dietmar Zinner  67   68   69 Ivo Gut  15 Amanda D Melin  70   71   72 Katerina Guschanski  17   73 Mikkel Heide Schierup  8 Robin M D Beck  4 Ioannis Karakikes  74   75 Kevin C Wang  76   77   78 Govindhaswamy Umapathy  9   10 Christian Roos  79 Jean P Boubli  4 Adam Siepel  80 Anshul Kundaje  81   82 Benedict Paten  2 Kerstin Lindblad-Toh  3   83 Jeffrey Rogers  84 Tomas Marques Bonet  85   86   87   88   89 Kyle Kai-How Farh  90
Affiliations
Comparative Study

Identification of constrained sequence elements across 239 primate genomes

Lukas F K Kuderna et al. Nature. 2024 Jan.

Abstract

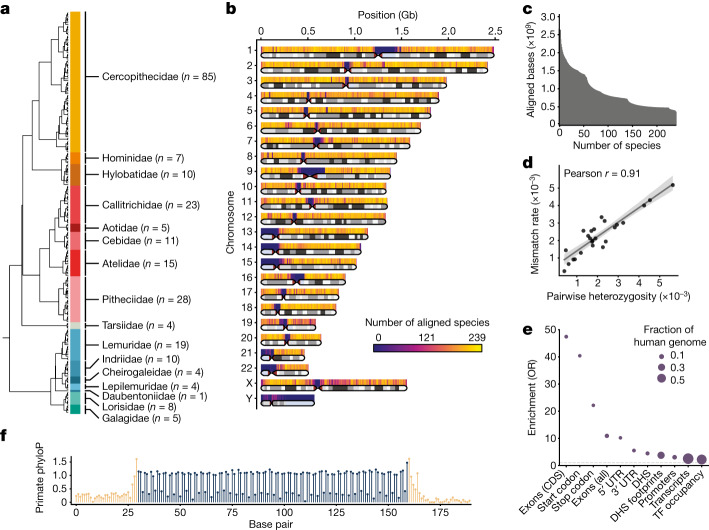
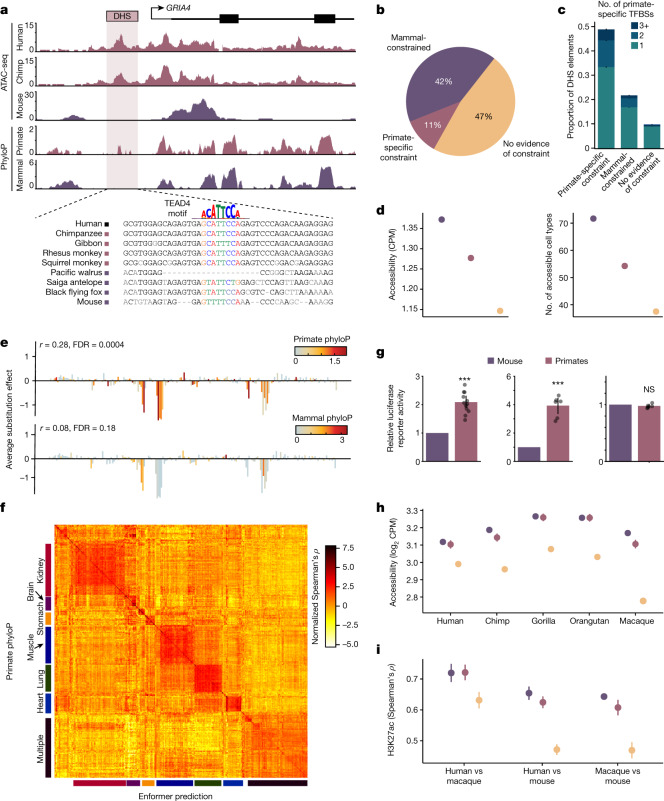
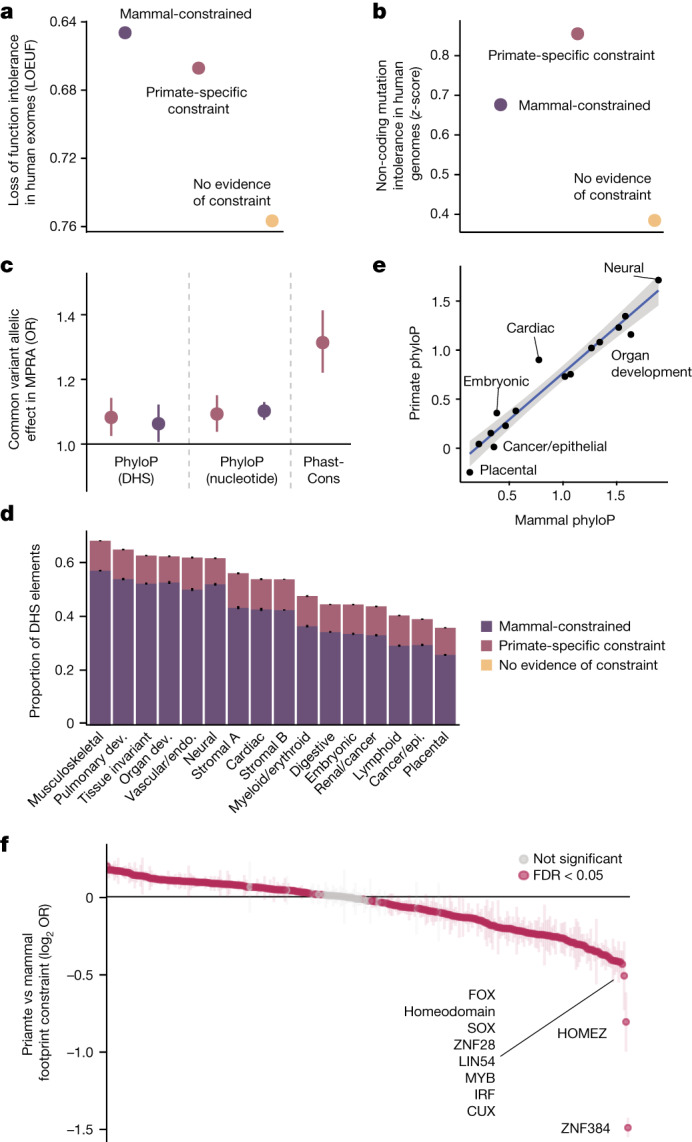
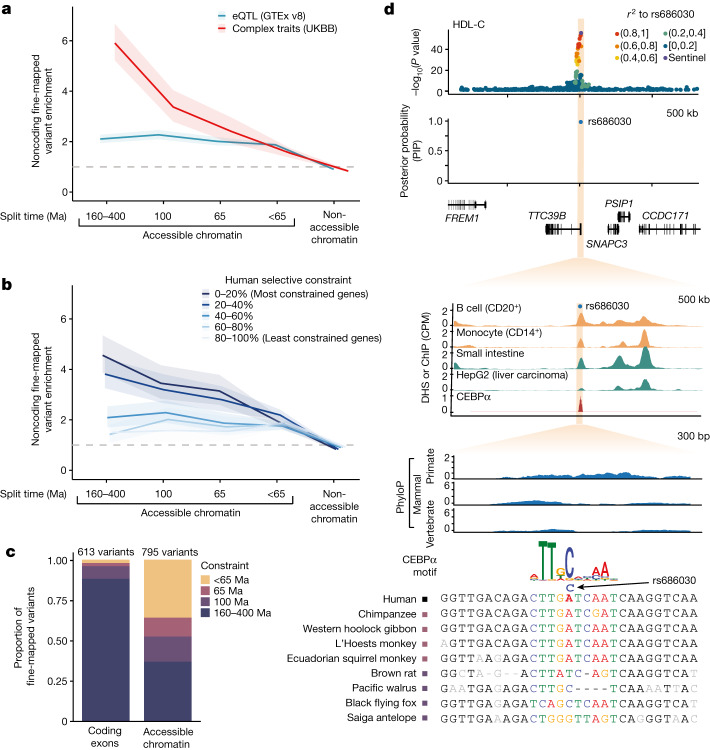
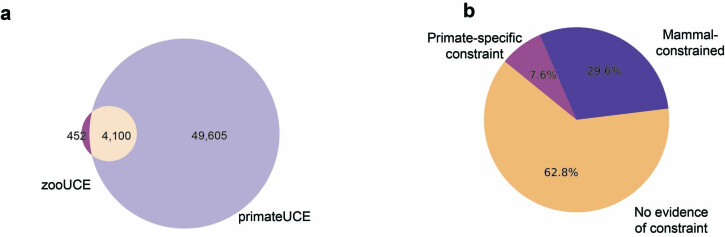
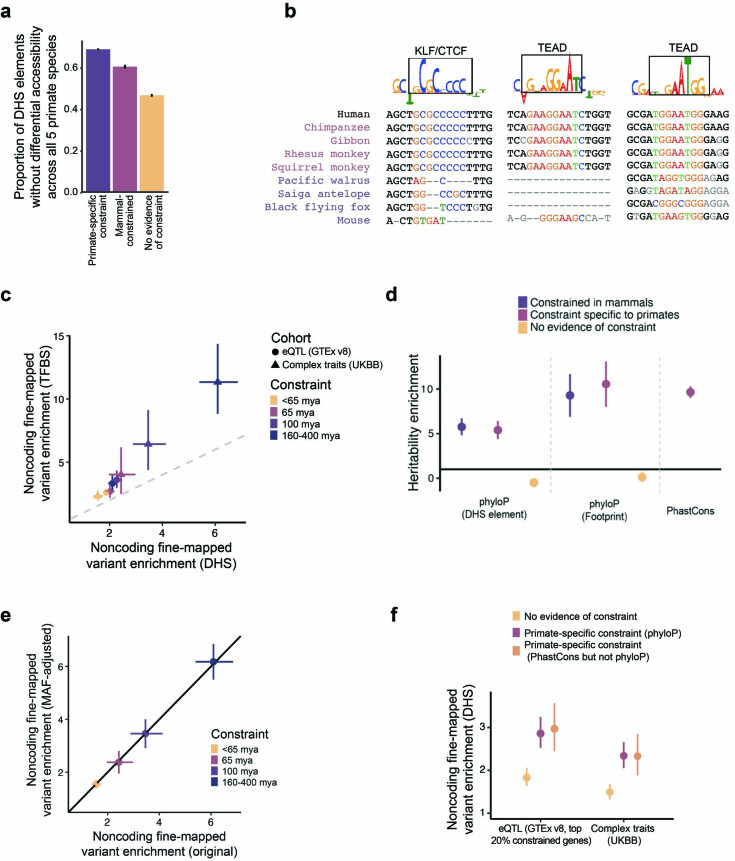
Noncoding DNA is central to our understanding of human gene regulation and complex diseases1,2, and measuring the evolutionary sequence constraint can establish the functional relevance of putative regulatory elements in the human genome3-9. Identifying the genomic elements that have become constrained specifically in primates has been hampered by the faster evolution of noncoding DNA compared to protein-coding DNA10, the relatively short timescales separating primate species11, and the previously limited availability of whole-genome sequences12. Here we construct a whole-genome alignment of 239 species, representing nearly half of all extant species in the primate order. Using this resource, we identified human regulatory elements that are under selective constraint across primates and other mammals at a 5% false discovery rate. We detected 111,318 DNase I hypersensitivity sites and 267,410 transcription factor binding sites that are constrained specifically in primates but not across other placental mammals and validate their cis-regulatory effects on gene expression. These regulatory elements are enriched for human genetic variants that affect gene expression and complex traits and diseases. Our results highlight the important role of recent evolution in regulatory sequence elements differentiating primates, including humans, from other placental mammals.


Conflict of interest statement

L.F.K.K., J.C.U., S.R., M.A., L.S., A.J.C., H.G., A.K., F.A., J.G.S. and K.K.-H.F. were employees of Illumina Inc. as of the initial submission of this manuscript.

Figures

Fig. 1
Fig. 1. MSA of 239 primate species.
a, Cladogram of primate species included in the MSA. The number of sampled species per family is given in parenthesis. b, Ideogram of the human genome depicting the average number of species covered by the MSA at 500-kb resolution. Telomeric, centromeric and heterochromatic regions (light blue) are indicated. c, Cumulative primate species coverage of the human genome in the 239-way primate MSA. d, Per-base mismatch rate between newly generated short-read contigs and species with previously published high-quality reference assemblies. A linear regression fit with a corresponding 95% confidence interval ribbon is shown. e, Enrichment of primate phastCons elements for coding and noncoding genomic elements. The size of the circle represents the fraction of the human genome. The dashed grey line indicates an odds ratio (OR) of 1. CDS, coding sequence; TF, transcription factor; UTR, untranslated region. (f) Codon periodicity in the mean primate phyloP scores across 482 protein-coding exons exactly 130 nucleotides in length. Coding sequences are shown in dark blue and flanking intronic sequences in beige.
Fig. 2
Fig. 2. Identification of noncoding regulatory elements with primate-specific constraint.
a, Example of a primate-specific constrained DHS element in the GRIA4 locus (hg38; chromosome (chr.) 11:105608279–105612792). Assay for transposase-accessible chromatin with sequencing (ATAC-seq) insertions from human, chimpanzee and mouse iPS cells and phyloP constraint in primates and mammals. A putative TEAD4 binding motif that better matches primate sequences than non-primate mammal sequences is indicated. b, Proportion of constrained DHS elements across clades. c, Number of primate-specific constrained footprints (TFBSs) in DHS elements, stratified by constraint across the entire DHS. Error bars represent 95% confidence intervals. d, Average chromatin accessibility and the number of accessible cell types is higher at more constrained DHS elements. Colours indicate constraint categories from b. Error bars represent 95% confidence intervals. CPM, counts per million. e, A saturation mutagenesis experiment (MPRA) of a DHS element at chr. 2:191049304–191045304 (hg38). Average effects of substitutions at each nucleotide on transcriptional activity are correlated with phyloP scores from primates but not from mammals. f, Heat map of normalized correlation values (Spearman’s ρ) between primate phyloP and sequence-based Enformer predictions of regulatory activity across 438 ENCODE cell types. Categories of similar cell types corresponding to specific tissues are indicated. g, Normalized luciferase reporter activity in human iPS cells for three selected sets of primate-specific constrained DHS elements at orthologous primate and mouse sequences. Colours indicate constraint categories from b. Bars represent mean and error bars represent 95% confidence intervals; n = 36 across 3 elements. P values: 1.4 × 10−5 (left), 2.8 × 10−4 (middle) and 0.54 (right). Raw data are provided in Supplementary Data 6. h, Average chromatin accessibility in fibroblasts for five primate species at orthologous sequence elements stratified by sequence constraint. Colours indicate constraint categories from b. Error bars represent 95% confidence intervals; n = 90,827 DHS elements. i, Average Spearman ρ of H3K27ac levels at orthologous CREs for three pairs of species. Colours indicate constraint categories from b. Error bars represent 95% confidence intervals. n = 12 for human versus mouse, n = 10 for all other comparisons. ***P < 0.001; NS, not significant.
Fig. 3
Fig. 3. Characterization of constrained regulatory elements.
a, Predicted target genes have fewer loss-of-function mutations in humans than expected at constrained DHS elements. Error bars represent 95% confidence intervals. b, Constrained DHS elements have fewer mutations in human populations than unconstrained elements. Error bars represent 95% confidence intervals. c, Enrichment of allele-specific regulatory activity (MPRA) for 27,023 common variants, stratified by type of constraint. A colour legend for constraint categories is shown in d. Error bars represent 95% confidence intervals, the central dot represents point estimates; n = 27,023 variants. d, Proportion of constrained DHS elements across 16 broad cellular contexts. Error bars represent 95% confidence intervals, centre represents proportion. n = 1,029,688 DHS elements. Dev., development; endo., endothelial; epi., epithelial. e, Scatter plot of mean primate and mammal phyloP scores at DHS elements, stratified by cell types. A linear fit is shown with a corresponding 95% confidence interval ribbon. Putative outlier cell types with higher primate phyloP than mammal phyloP scores are indicated. f, Differences in the proportion of primate and mammalian constrained footprints in human DHS elements, for each of 283 transcription factor family motifs. Positive values indicate a higher proportion of constrained TFBSs in primates, negative values indicate a lower proportion of constrained TFBSs in primates. Transcription factors that are the least constrained in primates compared to mammals are labelled, and significantly different transcription factors are coloured in magenta (FDR < 5%). Error bars represent 95% confidence intervals.
Fig. 4
Fig. 4. Enrichment of complex trait variants at constrained noncoding CREs.
a, Enrichment of fine-mapped GWAS variants from 96 UK Biobank (UKBB) complex traits and clinical phenotypes (red) or eQTLs for 49 GTEx tissues (blue) in DHS elements, stratified by sequence constraint of the element. Approximate split times for vertebrates (160–400 Ma), placental mammals (100 Ma) and primates (65 Ma) are shown. Enrichments are computed as the ratio of the proportion of variants with PIP > 0.5 compared to the proportion of variants with PIP < 0.01. Ribbons represent 95% confidence intervals and the centre represents the point estimate. The grey dashed line indicates an OR of 1. b, Enrichment of fine-mapped eQTL variants within DHS elements as in a, with genes separated into five bins based on their selective population constraint (LOEUF). Ribbons represent 95% confidence intervals and the centre represents the point estimate. c, Total count of fine-mapped variants for 96 UK Biobank phenotypes in protein-coding exons or accessible chromatin sites, stratified by extent of constraint as in a. d, Example of a fine-mapped variant (rs686030) for HDL-C and cholelithiasis at a primate-specific constrained DHS element. GWAS signal at the locus, fine-mapping probability, DNase signal, CEBPα chromatin immunoprecipitation with sequencing (ChIP–seq) signal, constraint scores and MSAs of primate (blue) and mammal (green) species are shown.
Extended Data Fig. 1
Extended Data Fig. 1. Genome assemblies and constraint metrics.
(a) Distribution of genome assembly span and contiguity for newly assembled primate species in this project. The cluster with assembly spans <2.3 Gb corresponds to Strepsirrhines, which have smaller genomes sizes then remaining primate species. (b) ROC-curves for coding benchmark across mammal and primate phyloP, comparing codon positions 2 (CD2) as putatively constrained positive cases, and human four-fold degenerate sites (4D) as negative cases. Both primate and mammal phyloP distinguish well between non-synonymous CD2 and 4-fold degenerate sites, while mammal phyloP achieves expectedly higher performance due to the larger total branch-length covered by the MSA. (c) Scatterplot showing the proportion of bases in the human genome with missing data in the filtered MSA, after excluding ambiguous alignments and duplications for a given species, versus the pairwise phylogenetic distance to human. The proportion of resolved bases has a strong phylogenetic clustering, points are colored by the corresponding primate family following the color scheme presented in Fig. 1a. (d) Effect of alignment composition on phyloP scores for 3 different scenarios: Site 1 contains positions with perfectly matching alignments in 151-171 species and missing alignments in the remaining ones, Site 2 contains positions with perfectly matching alignments in 151-171 species but mismatches in over 50 species, Site 3 contains perfect alignments across all species. Distributions for Site1 and Site 2 are significantly different (P = 1.4 × 10−66, two-sided Rank Sum Test).
Extended Data Fig. 2
Extended Data Fig. 2. Regional and global substitution models.
(a) Comparison of neutral background models with genome-wide random sampling of ancestral repeats from all autosomes (green) versus regional modeling of substitution rates at a 1 Mb scale (purple). The upper panel shows median phyloP scores in 1 Mb windows along chromosome 1, the lower panel the corresponding standard deviations. Median scores and dispersion are very similar between global and regional neutral models, values of larger discrepancy tend to fall within windows that containe a limited number of ancestral repeat sequences used to calibrate the regional model, resulting in less reliable estimates of local substitution rates (<50 kb, annotated as purple crosses). (b) Comparison of performance of global versus regional model at separating codon position 2 (amino acid-altering positions) versus 4-fold degenerate sites (synonymous positions), and promoters versus matched distal non-coding sequence. Global and regional models achieve similar performance on both coding and non-coding benchmarks.
Extended Data Fig. 3
Extended Data Fig. 3. Constraint in human protein-coding exons.
(a) Average per-base mammal and primate phyloP scores for human canonical protein-coding exons classified by primate-specific constraint. (b) Distribution of constraint across clades for 185,275 protein-coding exons. Most human protein coding exons are deeply constrained. (c) Fraction of alternatively spliced exons for exons constrained either specifically in primates, or broadly across mammals. Exons with primate-specific constraint are alternatively spliced significantly more often than broadly constrained ones (OR = 1.35, P = 1.3 × 10−7, two-sided Fisher’s Exact Test). (d) Mean exon inclusion rates (PSI) of alternatively spliced exons across GTEx tissues. Exons constrained specifically in primates have significantly lower inclusion rates than broadly constrained ones (P = 8.6 × 10−6, two-sided Rank Sum Test, n = 28,127 exons). Boxes show mean and interquartile range (IQR), whiskers delimit +/− 1.5 x IQR.
Extended Data Fig. 4
Extended Data Fig. 4. Sensitivity analysis of constraint in DHS elements.
(a) Distribution of non-primate mammalian scaling factors for DHS elements stratified by clade-specificity of constraint. The dashed gray line denotes where the mammal-constrained and primate-specific constrained distributions intersect. (b) Distribution of primate scaling factors for DHS elements stratified by clade-specificity of constraint. (c) Proportion of DHS with primate-specific constraint for variable FDR cutoffs in mammals excluding primates. Primate FDR is fixed at 5%. (d) Proportion of constrained DHS elements across clades when modeling substitution rates at a 1 Mb scale, compare to Fig. 2b. The estimated proportions are robust to differences between neutral substitution rates modeled in a regional 1 Mb context and a genome-wide averaged model. (e) Normalized Robinson–Foulds distance between 1 Mb scale phylogeny and canonical phylogeny along human chromosome 1. (f) Venn diagram intersecting DHS elements on chr1 classified as constrained in primates using regional substitution rate models and a fixed, canonical topology, or regional substitution rate models and a variable, regional topology. Models that accounting for regional differences in topology due to e.g. incomplete lineage sorting are highly concordant to those that use a single genome-wide topology (OR = 806.5, P ≈ 0, two-sided Fisher’s Exact Test).
Extended Data Fig. 5
Extended Data Fig. 5. UCEs and constrained TF footprints.
(a) Overlap between ultraconserved elements as recently defined by Zoonomia (zooUCEs) and primate UCEs allowing up to 1% missing data. (b) Distribution of constraint across clades for TF footprints assessed in this study.
Extended Data Fig. 6
Extended Data Fig. 6. Extended characterization of constrained noncoding regulatory elements.
(a) Differential chromatin accessibility at orthologous sequence elements across 5 primate species. The y-axis indicates the proportion of elements where differential accessibility was not detected in (37), stratified by sequence constraint. (b) For elements tested by Luciferase reporter in Fig. 2g, multiple sequence alignments for select primate and mammal species are shown for a subsequence of tested elements. Subsequences with high DeepLift contribution scores that had matching TF motifs were selected and these data are shown. (c) Comparison between the enrichment of fine-mapped variants (PIP > 0.5) in DHS elements or further restricted to TFBSs is shown, related to Fig. 4a,b. Error bars represent 95% CIs, centers represent point estimates. A grey dashed line indicates y = x. The shape of the point indicates whether the enrichment is for eQTLs or complex traits. Colors indicate sequence constraint. n = 3,221 on x-axis and 3,447 on y-axis fine-mapped variants. (d) Heritability enrichment as measured by LD Score regression for 6 regulatory constraint annotations and primate Phastcons. n = 69 traits. Error bars represent 95% CIs. (e) Comparison of noncoding fine-mapped variant enrichment with and without adjustment for MAF distributions between the set of variants with PIP > 0.5 and the set with PIP < 0.01. Error bars represent 95% CIs, centers represent point estimates. n = 3,221 fine-mapped variants. (f) Enrichment of fine-mapped variants (PIP > 0.5) in DHS elements, related to Fig. 4a,b. Error bars represent 95% CIs, centers represent point estimates. Colors indicate sequence constraint, including primate specific constraint as defined by phyloP and by phastCons but not phyloP. n = 3,221 for UKBB and 48,183 for GTEx fine-mapped variants.

References

    1. Albert FW, Kruglyak L. The role of regulatory variation in complex traits and disease. Nat. Rev. Genet. 2015;16:197–212. doi: 10.1038/nrg3891. - DOI - PubMed
    1. Lappalainen T, MacArthur DG. From variant to function in human disease genetics. Science. 2021;373:1464–1468. doi: 10.1126/science.abi8207. - DOI - PubMed
    1. Dermitzakis ET, Clark AG. Evolution of transcription factor binding sites in mammalian gene regulatory regions: conservation and turnover. Mol. Biol. Evol. 2002;19:1114–1121. doi: 10.1093/oxfordjournals.molbev.a004169. - DOI - PubMed
    1. Thomas JW, et al. Comparative analyses of multi-species sequences from targeted genomic regions. Nature. 2003;424:788–793. doi: 10.1038/nature01858. - DOI - PubMed
    1. Boffelli D, Nobrega MA, Rubin EM. Comparative genomics at the vertebrate extremes. Nat. Rev. Genet. 2004;5:456–465. doi: 10.1038/nrg1350. - DOI - PubMed

Publication types

MeSH terms