Progression of Retinal Ganglion Cell and Nerve Fiber Layer Loss in Spinocerebellar Ataxia 3 Patients
- PMID: 38030858
- PMCID: PMC11269372
- DOI: 10.1007/s12311-023-01634-1
Progression of Retinal Ganglion Cell and Nerve Fiber Layer Loss in Spinocerebellar Ataxia 3 Patients
Abstract
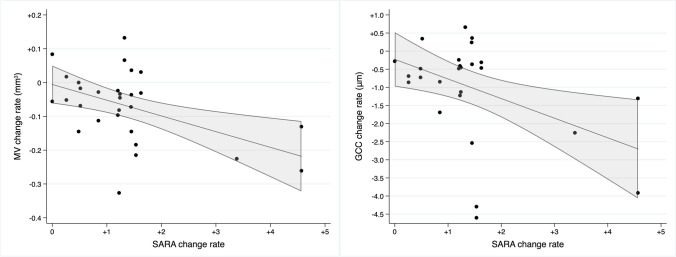
Spectral domain optical coherence tomography (SD-OCT) allows noninvasive measurements of retinal neuron layers. Here, we evaluate the relationship between clinical features and anatomical SD-OCT measurements in patients with spinocerebellar ataxia type 3 (SCA3) and how they change with time. A retrospective review was conducted on SCA3 patients. Clinical variables such as disease duration, number of CAG repeats, and the Scale for the Assessment and Rating of Ataxia (SARA) score were correlated with SD-OCT measurements, including retinal nerve fiber layer (RNFL) thickness, ganglion cell complex (GCC) thickness, macular volume (MV), and central macular thickness (CMT). Seventeen SCA3 patients with an average follow-up of 44.9 months were recruited. Clinical features with significant baseline correlations with SD-OCT measurements included disease duration (CMT r = - 0.590; GCC r = - 0.585), SARA score (CMT r = - 0.560; RNFL r = - 0.390), and number of CAG repeats (MV r = - 0.552; RNFL r = - 0.503; GCC r = - 0.493). The annual rate of change of the SARA score during follow-up was associated with that of both the MV (r = - 0.494; p = 0.005) and GCC thickness (r = - 0.454; p = 0.012). High disability (stages 2 and 3) was independently inversely associated with the annual change in MV (ß coefficient - 17.09; p = 0.025). This study provides evidence of an association between clinical features and objective anatomical measurements obtained by SD-OCT in SCA3 patients. MV and GCC thickness could serve as potential biomarkers of disease severity, as their rates of decrease seem to be related to a worsening in the SARA score. These findings highlight the potential of SD-OCT as a noninvasive tool for assessing disease severity and progression in SCA3 patients.
Keywords: Machado-joseph disease; Optical coherence tomography; Retinal ganglion cell; Spinocerebellar ataxia type 3.
© 2023. The Author(s).
Conflict of interest statement
The authors declare no competing interests.
Figures