. 2023 Nov 30;22(1):192.
doi: 10.1186/s12943-023-01905-9.

Immunosignatures associated with TP53 status and co-mutations classify prognostically head and neck cancer patients

Affiliations

Immunosignatures associated with TP53 status and co-mutations classify prognostically head and neck cancer patients

Andrea Sacconi et al. Mol Cancer. .

Abstract

Background: Immune checkpoint inhibitors (ICIs) are a therapeutic strategy for various cancers although only a subset of patients respond to the therapy. Identifying patients more prone to respond to ICIs may increase the therapeutic benefit and allow studying new approaches for resistant patients.

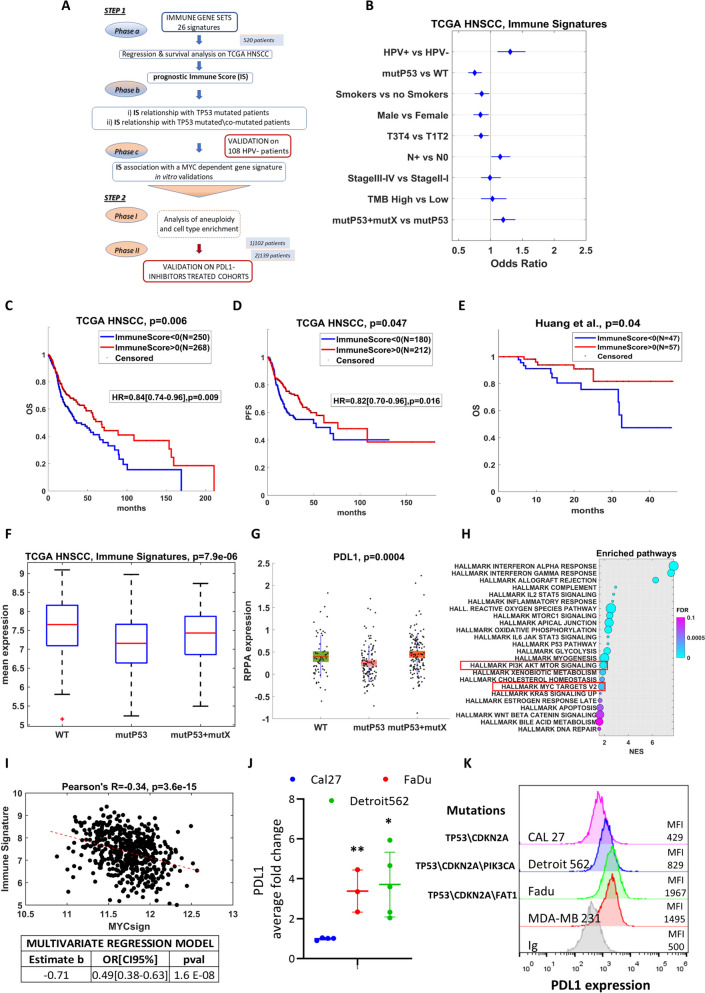
Methods: We analyzed the TCGA cohort of HNSCC patients in relation to their activation of 26 immune gene expression signatures, as well as their cell type composition, in order to define signaling pathways associated with resistance to ICIs. Results were validated on two cohorts of 102 HNSCC patients and 139 HNSCC patients under treatment with PD-L1 inhibitors, respectively, and a cohort of 108 HNSCC HPV negative patients and by in vitro experiments in HNSCC cell lines.

Results: We observed a significant association between the gene set and TP53 gene status and OS and PFS of HNSCC patients. Surprisingly, the presence of a TP53 mutation together with another co-driver mutation was associated with significantly higher levels of the immune gene expression, in comparison to tumors in which the TP53 gene was mutated alone. In addition, the higher level of TP53 mutated-dependent MYC signature was associated with lower levels of the immune gene expression signature. In vitro and three different patient cohorts validation analyses corroborated these findings.

Conclusions: Immune gene signature sets associated with TP53 status and co-mutations classify with more accuracy HNSCC patients. These biomarkers may be easily implemented in clinical setting.

Keywords: HNSCC; Immune checkpoint inhibitor; Immunotherapy; PDL1; PI3K; c-MYC; p53.


Conflict of interest statement

He authors declare no competing interests.

Figures

Fig. 1
Fig. 1
A Workflow of the main analyses. B Forest plot representing the association of average expression of 125 genes included in the 26 immune gene sets and the clinical variables in 520 HNSCC patients from TCGA. Results of the linear regressions are shown as Odds Ratio with confidence intervals at 95%. C-D Kaplan–Meier curves of HNSCC patients from TCGA cohort with high or low Immune Scores evaluated for overall survival and progression free survival (panels C and D, respectively). Differences between curves were evaluated by logrank test. Hazard ratios with 95% confidence intervals were assessed by Cox Hazard regression models. Immune Scores were evaluated as the positive and negative z-scores of the average expression of the 125 genes composing the immune gene sets. E Overall Survival in a cohort of 108 HPV-negative HNSCC patients (Huang et al.). Patients were divided based on high and low levels of the Immune Score. Differences between curves were evaluated by log-rank test. F Distributions of the gene signature composed by the average expression of 125 genes of the immune gene sets by TP53 mutation and TP53 mutation carried on other mutations among FAT1, CDKN2A and PIK3CA in HNSCC patients (106 WT, 171 TP53 and 189 TP53 + mutX). P-values were evaluated by KruskalWallis test. G Distributions of the PDL1 protein among different mutational status subgroups from a set of 339 HNSCC patients evaluated by reverse phase protein array (RPPA) in the TCGA cohort. H Gene set enrichment analysis of co-mutated patients versus TP53 mutated patients in the TCGA HNSCC cohort. The size of the circles indicates the percentage of genes included in the pathway. Pathways are sorted by False Discovery Rate and normalized enrichment score (NES). The PI3K pathway and the MYC pathway activity were highlighted. For the analysis, we used the GSEA 4.2 software (https://www.gsea-msigdb.org/gsea/index.jsp) run in pre-ranked mode with HALLMARK pathways. I Pearson’s correlation between the mean expression of 26 immune gene sets (upper panel) and PD-L1 expression values (bottom panel) with the levels of expression of a 22 genes signature MYC dependent (Ganci et al.) in HNSCC patients from TCGA. A Multivariate regression models were built to adjust the differences of the genes between patients with high and low MYC signature. The models include T status, TP53 mutation, gender, smoking status and, HPV status. High and low expression of the MYC signature were evaluated by positive and negative z-scores of the mean gene expression, respectively. J qRT-PCR analysis of PD-L1 in Cal27, FaDu and Detroit 562 cell lines. Statistics (t-test): * p < 0.01, ** p < 0.005. K Flow cytometry analysis of PD-L1 surface expression in cell lines. Representative cell lines (color-coded) were harvested from their cultures and stained with CD274-PE mAb or control Ig for 30 min at 4 °C. Surface expression was assessed on single, live cells on the Attune NxT cytometer. Mean fluorescence intensity is shown. The staggered plot depicts cell line expression according their mutational status
Fig. 2
Fig. 2
A The Spearman’s correlation coefficient reveals a negative association between aneuploidy score and immune signature. B Spearman's correlation of PDL1 with aneuploidy scores in TCGA HNSCC patients. C Spearman's correlation of the 22-gene MYC signature (Ganci et al.). D Distributions of the aneuploidy scores between TP53 mutated patients, WT patients and co-mutated patients. Co-mutated patients show lower aneuploidy than TP53 mutated patients. Statistical significance was evaluated by Wilcoxon test. E Forest plot and multivariate regression model to assess the weights in the immune gene sets prediction of the aneuploidy score and the TP53 co-mutational status. The variables resulted to be independent predictors of the immune signature. F Cell types enrichment analysis by comparing 64 cell type signatures in subgroups of HNSCC patients with TP53 mutation, TP53 mutation with other mutations and wild type patients. Heatmap representing the normalized average scores obtained from Xcell software, reflecting the cell type abundance of the most significant modulated cell types among the three subgroups. The statistical significance (p < 0.05) was assessed by KruskalWallis test. G Overall survival (left panel) and Progression free survival (right panel) of 102 patients treated with PDL1 inhibitors from GEO database (GSE159067). Patients were split basing on the Immune Score. The high\low levels of Immune Score were obtained considering the positive and negative z-scores of the average expression of the 26 immune gene sets, respectively. Differences between curves were evaluated by logrank test. The multivariate Cox Hazard regression analysis was adjusted for gender and HPV status. H Average expression of the 26 immune gene sets and MYC signature distribution in 102 patients treated with PDL1 inhibitors (GSE159067, left and right panel, respectively). The immune gene sets expression was evaluated in patients with complete or partial response and patients with stable disease or progression disease after treatment (Fig. 2H, left panel). The MYC signature expression was evaluated according to the phenotype classification (“COLD” and “HOT” patients) obtained from Foy JP and colleagues (Fig. 2H, right panel). Differences were evaluated by Wilcoxon test. I The overall survival of 139 HNSCC patients in Samstein's cohort (MSKCC) who underwent ICI treatment was analyzed based on their mutational status. P-values were assessed using the logrank test

References

    1. Sung H, Ferlay J, Siegel RL, Laversanne M, Soerjomataram I, Jemal A, Bray F. Global cancer statistics 2020: GLOBOCAN estimates of incidence and mortality worldwide for 36 cancers in 185 countries. Ca-a Cancer Journal for Clinicians. 2021;71:209–249. doi: 10.3322/caac.21660. - DOI - PubMed
    1. Curry JM, Sprandio J, Cognetti D, Luginbuhl A, Bar-ad V, Pribitkin E, Tuluc M. Tumor Microenvironment in Head and Neck Squamous Cell Carcinoma. Semin Oncol. 2014;41:217–234. doi: 10.1053/j.seminoncol.2014.03.003. - DOI - PubMed
    1. Marur S, Forastiere AA. Head and neck cancer: changing epidemiology, diagnosis, and treatment. Mayo Clin Proc. 2008;83:489–501. doi: 10.4065/83.4.489. - DOI - PubMed
    1. Borcoman E, Marret G, Le Tourneau C. Paradigm Change in First-Line Treatment of Recurrent and/or Metastatic Head and Neck Squamous Cell Carcinoma. Cancers (Basel). 2021;13(11):2573. - PMC - PubMed
    1. Machiels JP, Rene Leemans C, Golusinski W, Grau C, Licitra L, Gregoire V, secretariat@ehns.org EEBEa, clinicalguidelines@esmo.org EGCEa, info@estro.org EEBEa. Squamous cell carcinoma of the oral cavity, larynx, oropharynx and hypopharynx: EHNS-ESMO-ESTRO Clinical Practice Guidelines for diagnosis, treatment and follow-up. Ann Oncol. 2020;31:1462–75. - PubMed

Publication types

Substances