. 2023 Nov 29;22(1):191.
doi: 10.1186/s12943-023-01908-6.

A bispecific Clec9A-PD-L1 targeted type I interferon profoundly reshapes the tumor microenvironment towards an antitumor state

Affiliations

A bispecific Clec9A-PD-L1 targeted type I interferon profoundly reshapes the tumor microenvironment towards an antitumor state

Sandra Van Lint et al. Mol Cancer. .

Abstract

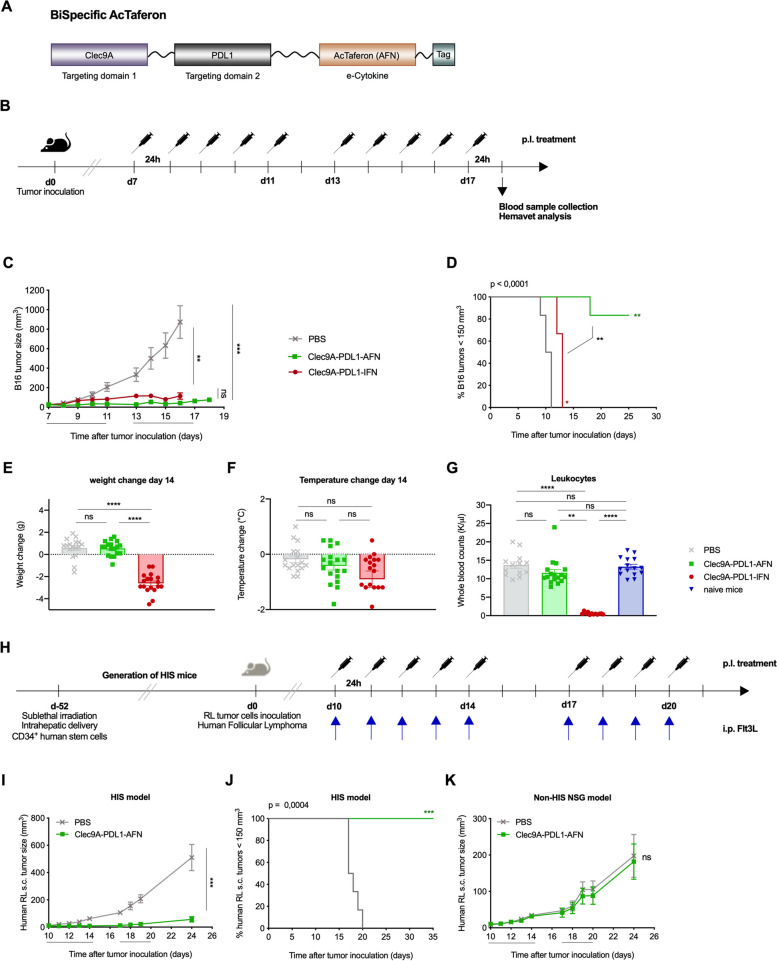
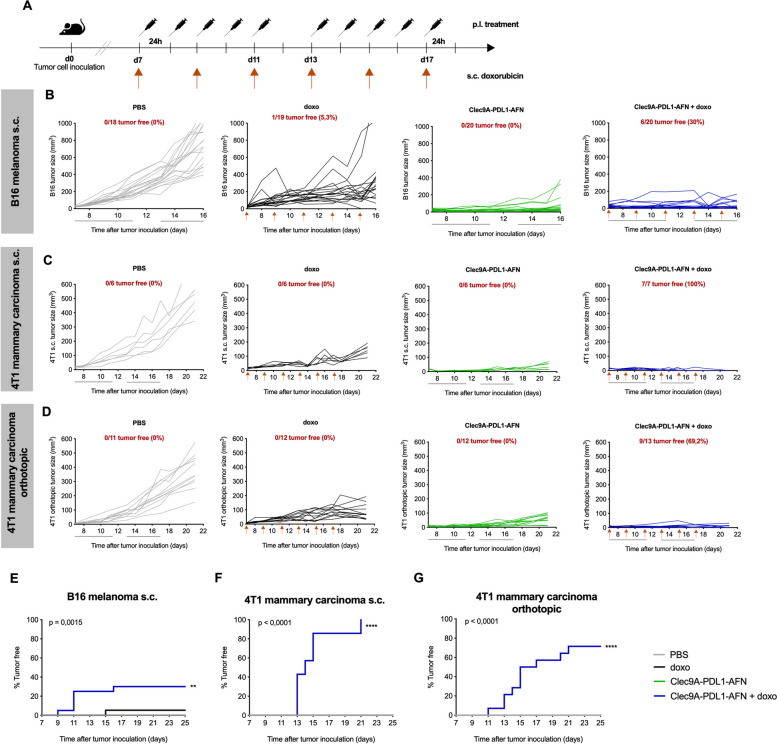
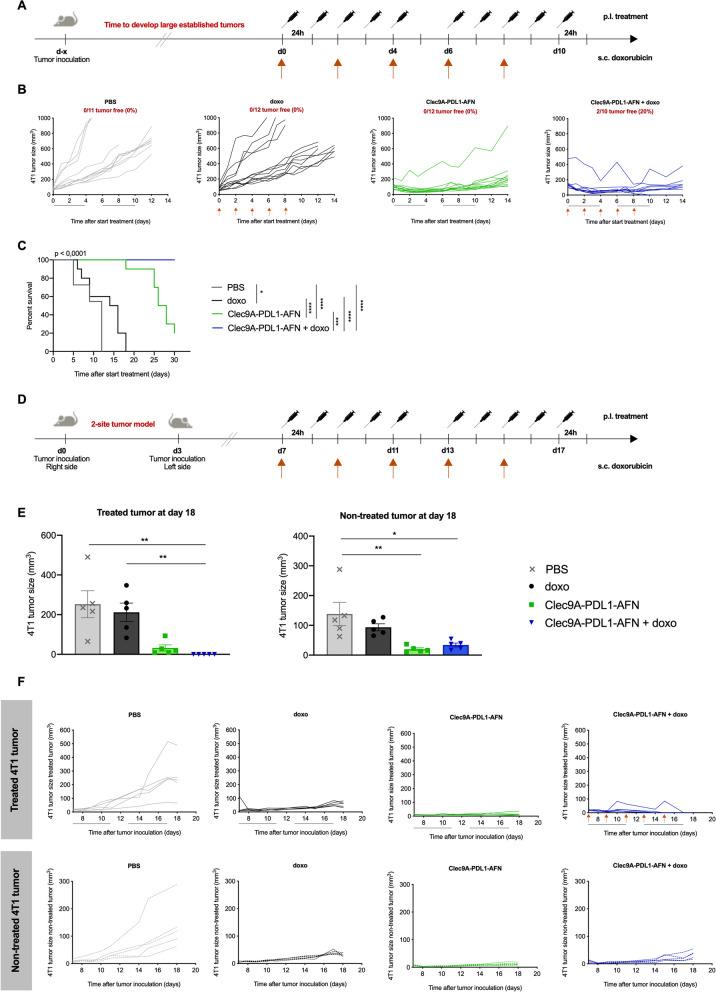
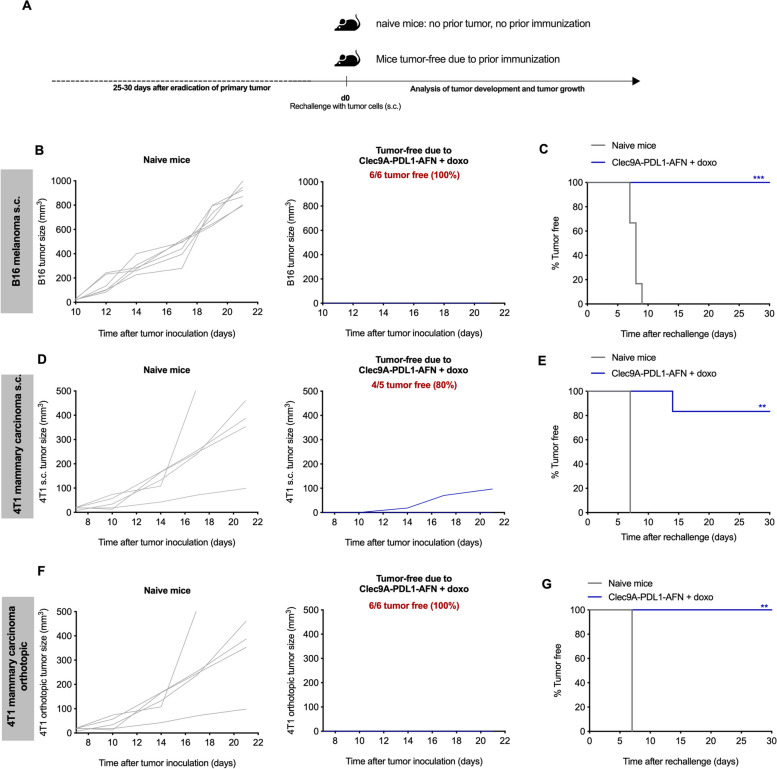
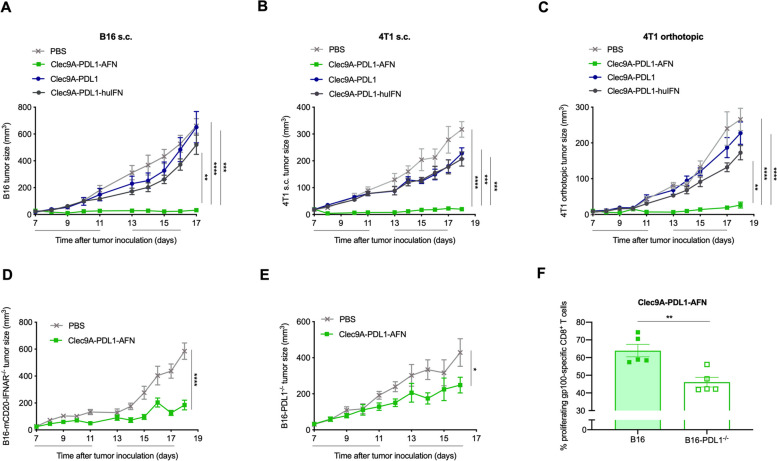
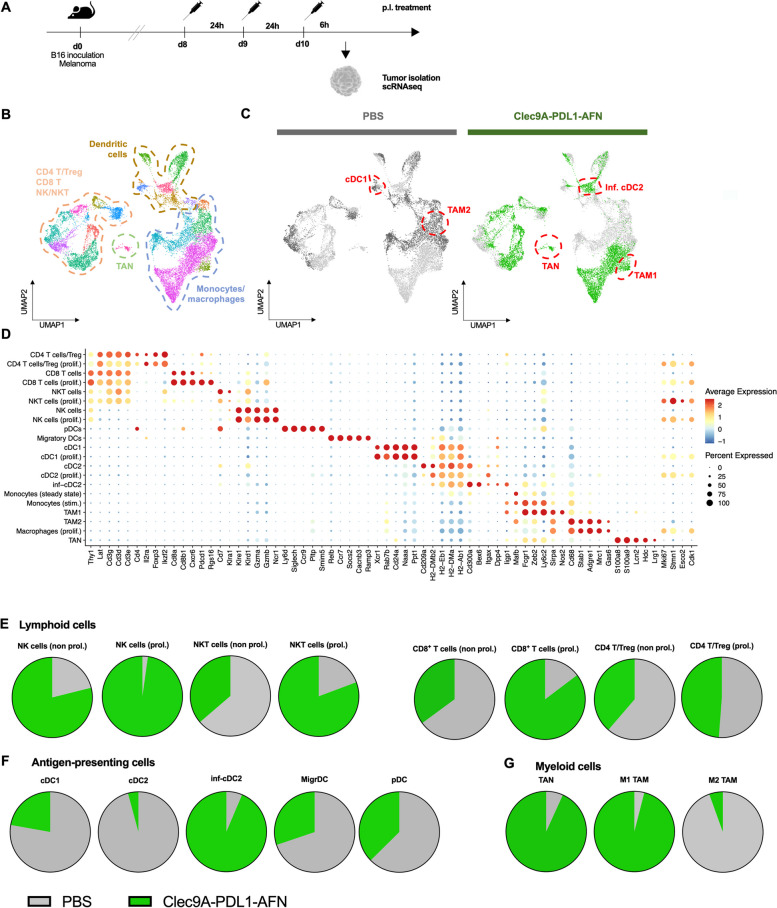
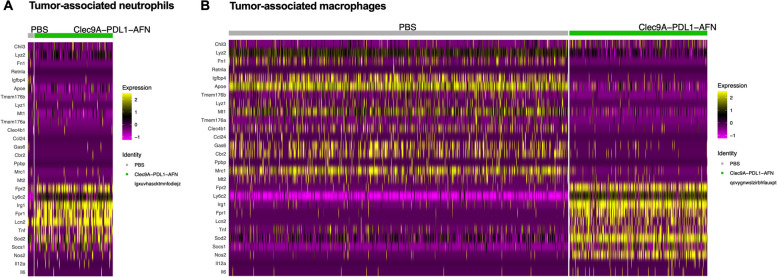
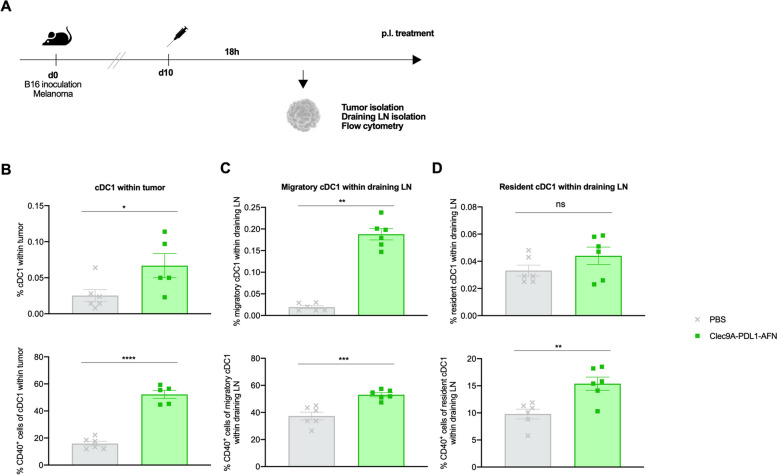
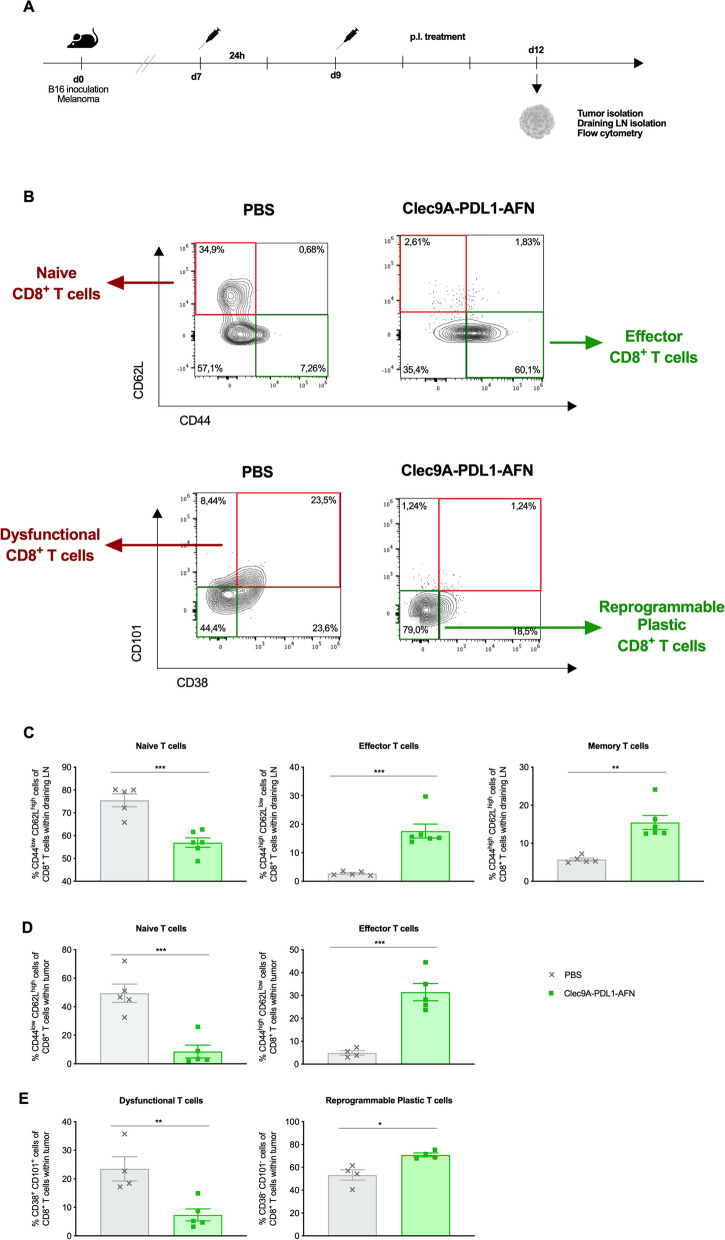
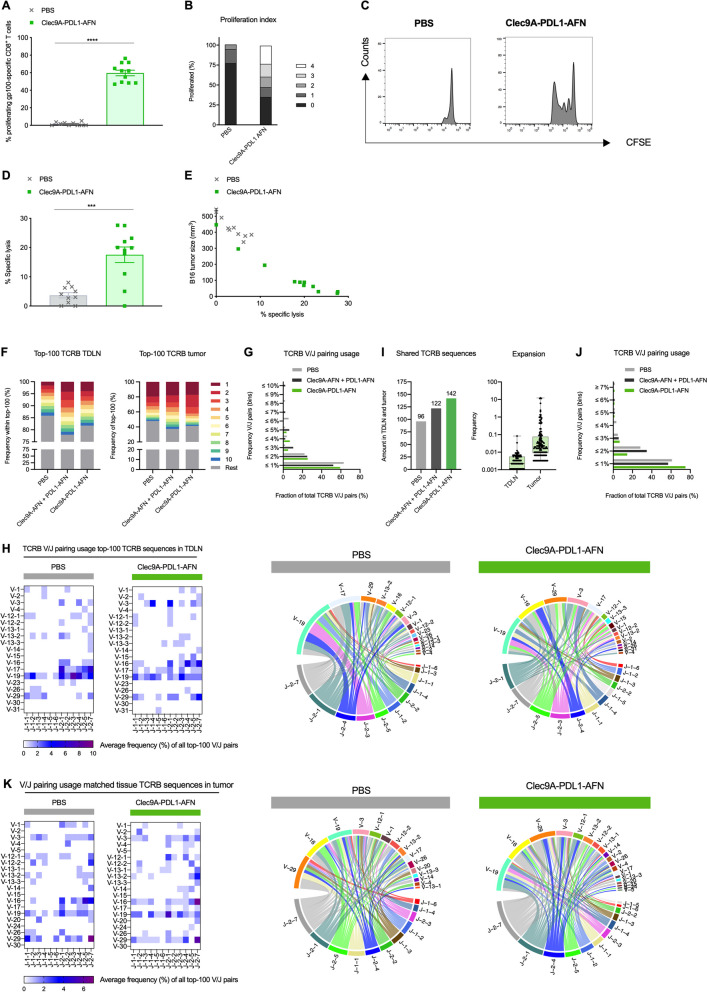
Despite major improvements in immunotherapeutic strategies, the immunosuppressive tumor microenvironment remains a major obstacle for the induction of efficient antitumor responses. In this study, we show that local delivery of a bispecific Clec9A-PD-L1 targeted type I interferon (AcTaferon, AFN) overcomes this hurdle by reshaping the tumor immune landscape.Treatment with the bispecific AFN resulted in the presence of pro-immunogenic tumor-associated macrophages and neutrophils, increased motility and maturation profile of cDC1 and presence of inflammatory cDC2. Moreover, we report empowered diversity in the CD8+ T cell repertoire and induction of a shift from naive, dysfunctional CD8+ T cells towards effector, plastic cytotoxic T lymphocytes together with increased presence of NK and NKT cells as well as decreased regulatory T cell levels. These dynamic changes were associated with potent antitumor activity. Tumor clearance and immunological memory, therapeutic immunity on large established tumors and blunted tumor growth at distant sites were obtained upon co-administration of a non-curative dose of chemotherapy.Overall, this study illuminates further application of type I interferon as a safe and efficient way to reshape the suppressive tumor microenvironment and induce potent antitumor immunity; features which are of major importance in overcoming the development of metastases and tumor cell resistance to immune attack. The strategy described here has potential for application across to a broad range of cancer types.

Keywords: AcTakine; Cancer immunotherapy; Immune checkpoint; Tumor microenvironment; Type I Interferon.


Conflict of interest statement

NK and JT are affiliated with Orionis Biosciences NV and hold equity interests. NK and JT have no additional financial interests. The following patent applications are related to the work presented in this paper: WO/2017/134305, Bispecific signaling agents and uses thereof. Applicants: VIB-Ghent University and Orionis Biosciences N.V. Inventors: N.K., J.T., S.V.L., A.C. The remaining authors declare no competing interests.

Figures

Fig. 1
Fig. 1
Tumor control by Bispecific AcTaferon shows ample potential and is completely safe. A Design and layout of the Bispecific AcTaferon (AFN) construct. Targeting domains are N-terminally connected to the mutated cytokine. A HIS-tag was added for easy purification. B Schematic representation of the experimental setup. Mice were s.c. inoculated with 6 × 105 B16 tumor cells. When palpable tumor was detected (day 7 after tumor inoculation) mice were treated 10 times with a perilesional administration with PBS (grey), 30 μg of the Bisp-AFN Clec9A-PDL1-AFN (green) or 30 μg of the Clec9A-PDL1-IFN wild type (red) according to the indicated arrows above the timeline. C, D Figures show tumor growth (C) as well as time to reach a B16 tumor volume of 150 mm3 (D). One representative experiment out of three is shown (6/group/experiment). EF Weight change (E) and body temperature (F) are depicted at day 14 after B16 tumor inoculation. Values are relative to day 7, representing the start of the treatment schedule. The graphs show individual values ± SEM of 3 independent experiments (6/group/experiment). G One day after the last treatment in the B16 model, blood was collected, and hematological analysis (Hemavet) was performed. Leukocyte analysis is shown as a summary of individual values ± SEM of three independent experiments (6/group/experiment). H Schematic representation of the experimental layout using a Humanized Immune System (HIS) mouse model. Mice were s.c. inoculated with RL tumor cells. When palpable tumor was detected mice were treated with a perilesional administration with PBS (grey) or 30 μg of the fully humanised Bisp-AFN Clec9A-PDL1-AFN (green) according to the indicated arrows above the timeline. Intraperitoneal administration of Flt3L is indicated by the blue arrows underneath the timeline. I-J Figures show tumor growth (I) as well as time to reach an RL tumor volume of 150 mm3 (J) in an HIS setting. K The graph shows RL tumor growth in absence of a human immune system (Non-HIS NSG mice). One representative experiment out of two is shown (5–6/group/experiment). Tumor growth (C) was analyzed using Two-way ANOVA with Tukey’s multiple comparisons test. For the HIS/non-HIS model (I, K), tumor growth was analyzed at day 24 using unpaired two-tailed student t-test. Black lines underneath the X-axis depict the treatment time. Time to reach a specific tumor size (D, J) is represented in a Kaplan Meier plot compared by log-rank (Mantel-Cox) test. Bar plots (E, F, G) were analyzed using One-way ANOVA Kruskal–Wallis test with Dunn’s multiple comparisons test. * < 0.05; ** < 0.01; *** < 0.001; **** < 0.0001
Fig. 2
Fig. 2
Combination therapy with doxorubicin leads to complete tumor cure. A Schematic representation of the experimental setup. B, E B16 melanoma cells were s.c. inoculated. Results show a summary of three independent experiments (6–8/group/experiment). C, F 4T1 mammary carcinoma cells were s.c. inoculated. Shown is one experiment (n = 6). D, G Orthotopic 4T1 mammary carcinoma model. Results show a summary of two independent experiments (6/group/experiment). Tumor growth progression is depicted for the individual mice in each group (B-D). Kaplan Meier graphs (EG) show tumor free mice. When palpable tumors were detected, mice were treated with PBS (grey), doxo (black), 30 μg of Bisp-AFN Clec9A-PDL1-AFN (green) or a combination of Clec9A-PDL1-AFN with doxo (blue). Black lines underneath the X-axis depict the treatment time, while orange arrows indicate s.c. administration of doxo. Kaplan Meier plots depicting % tumor free mice (EG) were analyzed using log-rank (Mantel-Cox) test with * p < 0.05; ** p < 0.01; *** p < 0.001; **** p < 0.0001
Fig. 3
Fig. 3
Combination therapy with doxorubicin leads to therapeutic immunity and systemic effects. A Schematic representation of the experimental setup. Treatment was started when large established tumors were reached (120–150 mm3). B, C Figures show 4T1 tumor growth of individual mice in each group (B) as well as survival (C) (one experiment was performed with n = 12/group). D Schematic representation of the experimental setup for a two-site tumor model. Primary tumors were inoculated at the right flank followed by a second tumor inoculation at the contralateral flank. Primary tumors were p.l. treated whereupon systemic effects of local treatment were analyzed on disseminated non-treated tumors (left flank). E The graphs show s.c. 4T1 tumor volume of individual values ± SEM at day 18 (n = 5). F Tumor growth curves of both treated (upper panel) and non-treated (lower panel) tumors of individual mice using the s.c. 4T1 mammary carcinoma model. Mice were treated with PBS (grey), doxo (black), 30 μg of Bisp-AFN Clec9A-PDL1-AFN (green) or a combination of Clec9A-PDL1-AFN with doxo (blue). Black lines underneath the X-axis depict the treatment time, while orange arrows indicate s.c. administration of doxo. Kaplan Meier plots depicting % survival (C) were analyzed using log-rank (Mantel-Cox) test. Bar plots (E) were analysed using One-way ANOVA Kruskal–Wallis test with Dunn’s multiple comparisons test (treated tumors) or using One-way ANOVA followed by bonferroni’s multiple comparison test (non-treated tumors) dependent on Shapiro–Wilk test for normal distribution of the data. * < 0.05; ** < 0.01; *** < 0.001; **** < 0.0001
Fig. 4
Fig. 4
Induction of immunological memory upon combined treatment with doxorubicin. A Schematic representation of the experimental layout. Tumor-free mice over the different experiments were re-challenged s.c. in the contralateral flank on day 25–30 after eradication of the primary tumor. For each tumor model, mice without prior tumor inoculation nor treatment, referred to as ‘naive mice’, were included and injected with the indicated tumor cells as a control for disease progression. B-E Mice cured from an s.c. primary tumor were s.c. re-challenged with 6 × 105 B16 cells (B-C) or 105 4T1 cells (D-E). F-G Mice in which the orthotopically implanted primary 4T1 tumor was completely cured were re-challenged s.c. with 105 4T1 cells. Figures show tumor growth measured of individual mice in each group (B, D, F) as well as % tumor free mice (C, E, G). Kaplan Meier graphs depicting % tumor free mice (C, E, G) were analyzed using log-rank (Mantel-Cox) test. * < 0.05; ** < 0.01; *** < 0.001; **** < 0.0001
Fig. 5
Fig. 5
Role of IFN signaling and PD-L1 expression. A-C Tumor cells were s.c. or orthotopically inoculated. Tumors were p.l. treated with PBS (grey), 30 μg of the Bisp-AFN (green), 30 μg of the bispecific construct carrying an in mouse non-functional human IFN (blue) or 30 μg of the Clec9A-PDL1 construct, lacking an IFN moiety (dark grey). Figures show tumor growth in the s.c. B16 model (A) (one representative experiment out of three, 6mice/group/experiment), s.c. 4T1 tumor model (B) (n = 6) and the orthotopic 4T1 tumor model (C) (n = 6). D Tumor growth of B16-mCD20-IFNAR−/− tumors p.l. treated with PBS (grey) or Bisp-AFN (green). Shown is a summary of two independent experiments (6/group/experiment). E Tumor growth of B16-PD-L1−/− tumors p.l. treated with PBS (grey) or Bisp-AFN (green). Shown is a summary of two independent experiments (6/group/experiment). F Flow cytometry analysis of gp100-specific CD8+ T cell proliferation in draining LN of B16 or B16-PD-L1−/− tumor-bearing mice p.l. injected with 30 μg Clec9A-PDL1-AFN at days 7 and 9 after tumor inoculation. One day prior to immunization, gp100-specific CD8+ T cells (pMel) were adoptively transferred in B16 tumor-bearing mice. Data show percentages of gp100-specific CD8.+ T cells that have undergone at least one division. Tumor growth (A-C) was analyzed using ANOVA with Tukey’s multiple comparisons test. Black lines underneath the X-axis depict the treatment time. Bar charts show individual values with mean ± SEM. Two-tailed unpaired t test was performed. * < 0.05; ** < 0.01; *** < 0.001; **** < 0.0001
Fig. 6
Fig. 6
scRNAseq reveals key shifts in both lymphoid and myeloid cells in the tumor microenvironment. A Schematic representation of the scRNA sequencing experiment. Data obtained upon administration of PBS are represented in grey while data obtained after Clec9A-PDL1-AFN administration are visualized in green. B, C UMAP visualization showing the overall CD45+ living cell population in B16 tumors (B) as well as for the individual treatment groups (C). D Annotation plot showing differentially expressed (DE) genes in the X-axis to determine the different clusters (Y-axis). The size of the dot indicates the number of cells that express the gene of interest. The color intensity reflects the expression level (red = high, blue = low). EG Parts of whole graphs showing relative distribution of immune cell types over the different treatments
Fig. 7
Fig. 7
scRNAseq data on myeloid cells in the B16 tumor microenvironment. A, B Heatmap plots displaying differentially expressed genes related to an immunogenic or tumorigenic phenotype within TAN (A) and TAM (B)
Fig. 8
Fig. 8
Bisp-AFN induces migration and potent maturation of dendritic cells. A Schematic representation of the experiment. Data obtained upon administration of PBS are represented in grey while data obtained after Clec9A-PDL1-AFN administration are visualized in green. B-D Presence and maturation status as determined by CD40 expression of cDC1 in B16 tumor (B) as well as migratory cDC1 (C) and resident cDC1 (D) in draining LN. cDCs were determined as CD45+ living cells, CD11c+MHC-II+. LN migratory cDCs are CD11cintermediateMHC-IIhigh while LN resident cDCs are CD11chighMHC-IIintermediate. cDC1 were determined as CD11bXCR1.+ cells within the described cDC population. Results show bar charts of individual values (B, C, D) with mean ± SEM. Graphs were analyzed using unpaired nonparametric Mann–Whitney t-test (migratory cDC1 within draining LN) or unpaired parametric t-test. * < 0.05; ** < 0.01; *** < 0.001; **** < 0.0001
Fig. 9
Fig. 9
Bisp-AFN induces a shift from naive and dysfunctional T cells towards effector and reprogrammable CTLs. A Schematic representation of the experiment. B Flow cytometry gating strategy to determine CD8+ T cells: CD45+ living cells, TCR-β+ T cells, CD8+CD4 T cells. Contour plots show the shift in expression of the indicated markers and cell populations over the different treatments. C, D Draining LN (C) and B16 tumors (D) were analyzed for CD44 and CD62L expression on CD8+ T cells. Naive cells were identified as CD44lowCD62Lhigh, effector T cells as CD44highCD62Llow and effector-memory T cells in draining LN as CD44highCD62Lhigh. E CD8+ T cells in B16 tumors were analyzed for CD38 and CD101 expression with dysfunctional T cells described as CD38+CD101+ and reprogrammable, plastic T cells as CD38CD101. Results show bar charts of individual values with mean ± SEM. Data obtained upon administration of PBS are represented in grey while data obtained after Clec9A-PDL1-AFN administration are visualized in green. Shown is one representative experiment. Graphs were analyzed using unpaired parametric t-test (draining LN naive T cells, tumor effector T cells, tumor dysfunctional and reprogrammable T cells) or unpaired nonparametric Mann–Whitney t-test (draining LN effector T cells, draining LN memory T cells, tumor naive T cells). * < 0.05; ** < 0.01; *** < 0.001; **** < 0.0001
Fig. 10
Fig. 10
Bisp-AFN is superior in the induction of tumor-specific CTLs. A-C Flow cytometry analysis of gp100-specific CD8+ T cell proliferation in draining LN of B16-bearing mice p.l. injected with PBS (grey) or Bisp-AFN (green) at days 7 and 9 after tumor inoculation. One day prior to immunization, gp100-specific CD8+ T cells (pMel) were adoptively transferred in B16 tumor-bearing mice. Data show percentages of gp100-specific CD8+ T cells that have undergone at least one division (A), stacked bar chart representing the percentage of cells per division peak (B) and representative flow cytometry proliferation profile for each treatment (C). Shown is a summary of two independent experiments (6/group/experiment). D, E B16-bearing mice were p.l. injected at days 7 and 9 after tumor inoculation with the indicated conditions. Five days after the first delivery, the killing potency of the induced tumor-specific CD8+ T cells was analyzed in draining LN by in vivo cytotoxicity assay (D). The correlation between tumor size at time of read out and % specific lysis was plotted (E). A summary of two independent experiments is shown (5–6/group/experiment). F Frequencies of the top-10 largest T cell clones within the top-100 most-abundant TCRB sequences in the draining LN (left) and tumor (right). Note that colors do not represent the same sequence in different bars. G, J Frequency distribution plots of TCRB V/J pairing usage within the top-100 most-abundant LN sequences (G) and tumors sequences that also appear in the LN (J). H, K Average TCRB V/J pairing usage frequencies within the top-100 most-abundant LN sequences (H) and tumors sequences that also appear in the LN (K). Corresponding circos plots for each treatment group are shown next to the heatmaps. I Amount of TCRB sequences from the draining LN that are also retrieved in the matched tumor (left) with relative frequencies of these sequences after treatment with Bisp-AFN. A summary of three mice per group was analysed. Results show bar charts of individual values with mean ± SEM (A, D). An unpaired nonparametric Mann–Whitney t-test (A) or parametric t-test (D) was performed depending on Shapiro Wilk normality test * < 0.05; ** < 0.01; *** < 0.001; **** < 0.0001

References

    1. Gajewski TF, et al. Immune resistance orchestrated by the tumor microenvironment. Immunol Rev. 2006;213:131–145. doi: 10.1111/j.1600-065X.2006.00442.x. - DOI - PubMed
    1. Pinzon-Charry A, Maxwell T, López JA. Dendritic cell dysfunction in cancer: a mechanism for immunosuppression. Immunol Cell Biol. 2005;83:451–461. doi: 10.1111/j.1440-1711.2005.01371.x. - DOI - PubMed
    1. Munn DH, Bronte V. Immune suppressive mechanisms in the tumor microenvironment. Curr Opin Immunol. 2016;39:1–6. doi: 10.1016/j.coi.2015.10.009. - DOI - PMC - PubMed
    1. Thommen DS, Schumacher TN. T Cell dysfunction in cancer. Cancer Cell. 2018;33:547–562. doi: 10.1016/j.ccell.2018.03.012. - DOI - PMC - PubMed
    1. Riva A, Chokshi S. Immune checkpoint receptors: homeostatic regulators of immunity. Hepatol Int. 2018;12:223–236. doi: 10.1007/s12072-018-9867-9. - DOI - PMC - PubMed

Publication types