. 2024 Jan;11(4):e2303575.
doi: 10.1002/advs.202303575. Epub 2023 Nov 30.

Motile Living Biobots Self-Construct from Adult Human Somatic Progenitor Seed Cells

Affiliations

Motile Living Biobots Self-Construct from Adult Human Somatic Progenitor Seed Cells

Gizem Gumuskaya et al. Adv Sci (Weinh). 2024 Jan.

Abstract

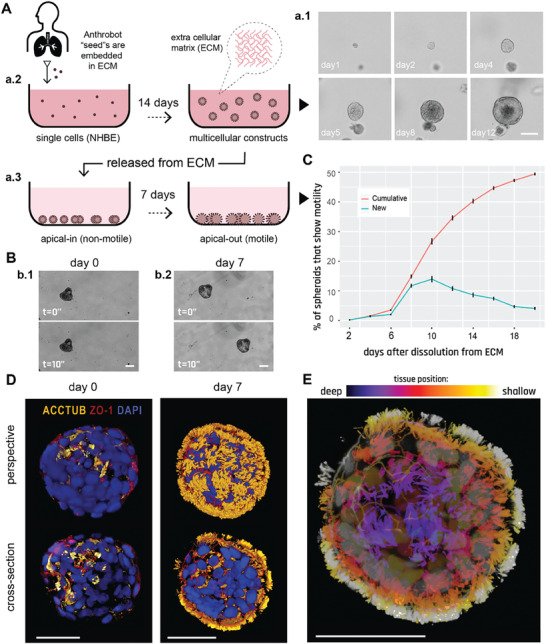
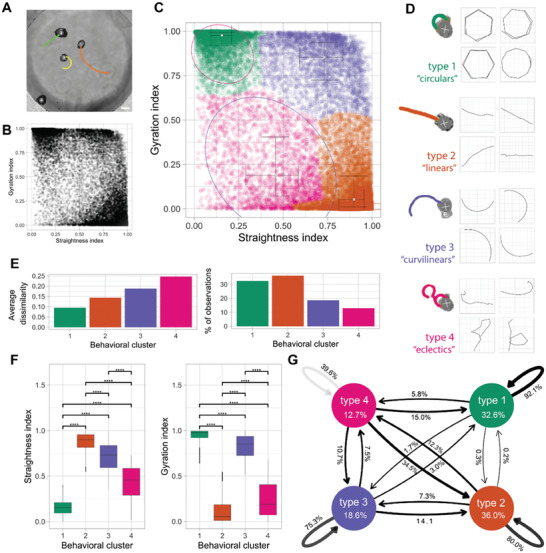
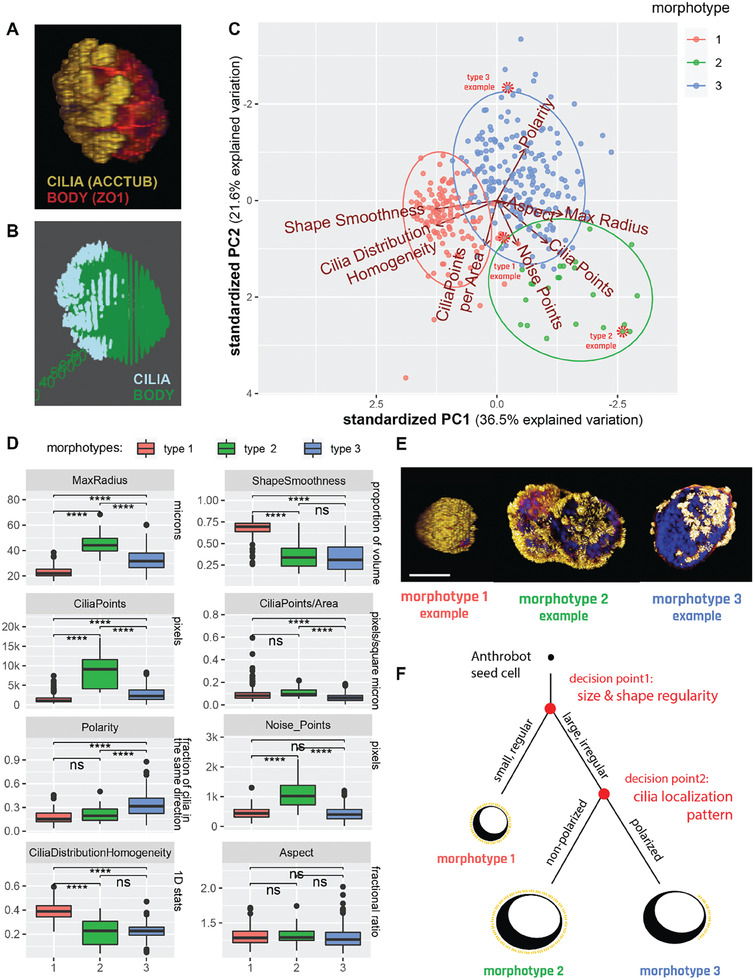
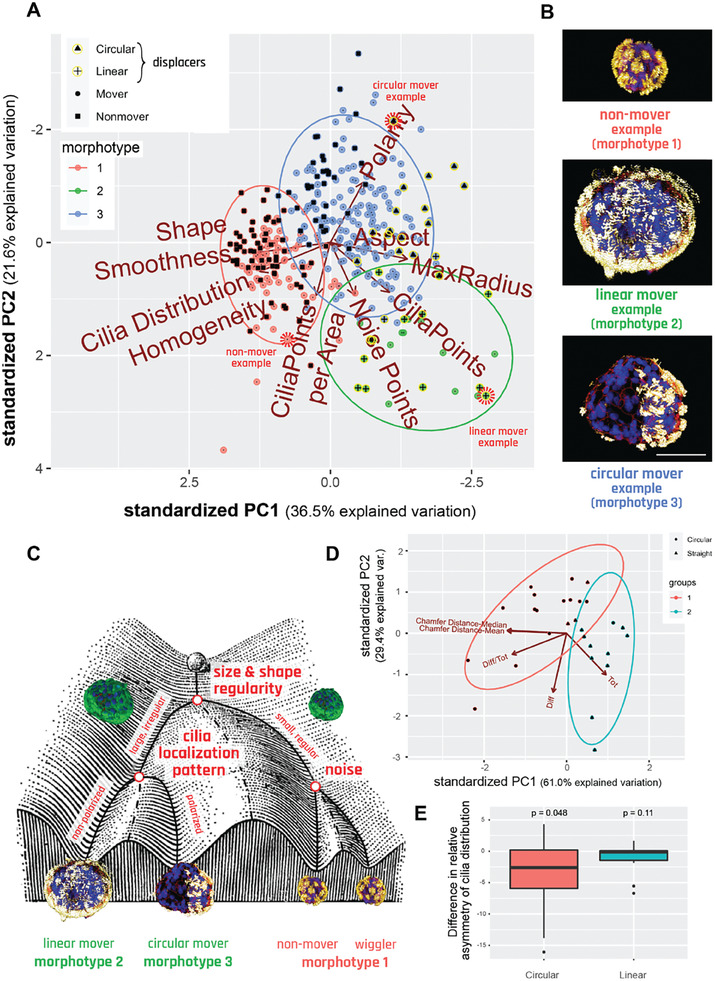
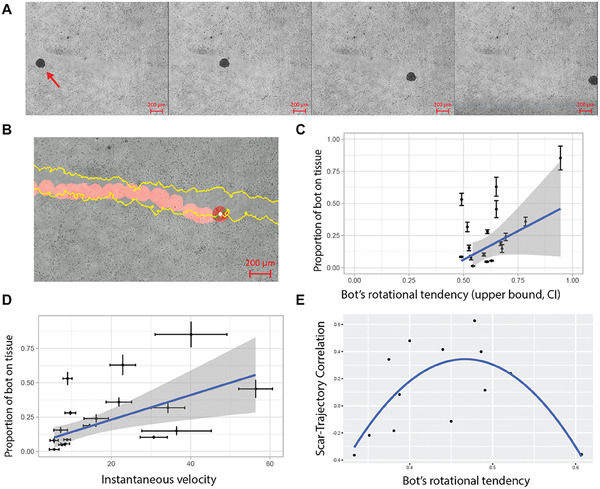
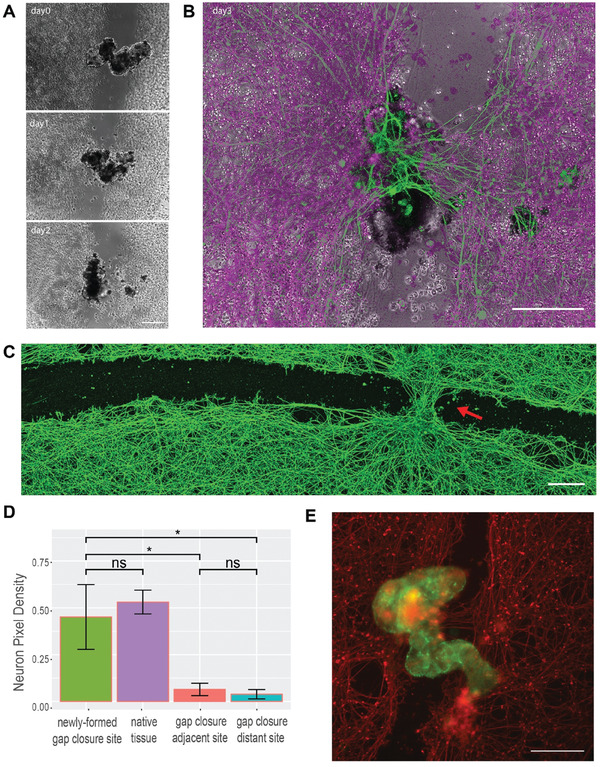
Fundamental knowledge gaps exist about the plasticity of cells from adult soma and the potential diversity of body shape and behavior in living constructs derived from genetically wild-type cells. Here anthrobots are introduced, a spheroid-shaped multicellular biological robot (biobot) platform with diameters ranging from 30 to 500 microns and cilia-powered locomotive abilities. Each Anthrobot begins as a single cell, derived from the adult human lung, and self-constructs into a multicellular motile biobot after being cultured in extra cellular matrix for 2 weeks and transferred into a minimally viscous habitat. Anthrobots exhibit diverse behaviors with motility patterns ranging from tight loops to straight lines and speeds ranging from 5-50 microns s-1 . The anatomical investigations reveal that this behavioral diversity is significantly correlated with their morphological diversity. Anthrobots can assume morphologies with fully polarized or wholly ciliated bodies and spherical or ellipsoidal shapes, each related to a distinct movement type. Anthrobots are found to be capable of traversing, and inducing rapid repair of scratches in, cultured human neural cell sheets in vitro. By controlling microenvironmental cues in bulk, novel structures, with new and unexpected behavior and biomedically-relevant capabilities, can be discovered in morphogenetic processes without direct genetic editing or manual sculpting.

Keywords: biobot; bioengineering; emergence; morphogenesis; repair; self-assembly.


Conflict of interest statement

This work is partially funded by a sponsored research agreement between Tufts University and a company called Astonishing Labs; co‐author Levin is a scientific co‐founder of Astonishing Labs.

Figures

Figure 1
Figure 1
Human bronchial epithelial cells self‐construct into multicellular motile living architectures. A) Workflow for producing Anthrobots. NHBE cells’ apical‐in to apical‐out transition is facilitated by first culturing them in extra cellular matrix (ECM) under appropriate differentiation‐inducing conditions, during which time apical‐in spheroids self‐construct from single cells a.1), and upon the completion of this 14 day period a.2) by releasing mature spheroids from the ECM a.3) and continuing to culture them in low‐adhesive environment. B) Phase contrast images of an apical‐in b.1) and apical‐out b.2) spheroids, captured immediately after dissolution from ECM (day 0) and 7 days after dissolution (day 7), respectively. Day 0 spheroids show no motility, whereas day 7 spheroids show drastically increased motility. C) Percentage of cumulative (total fraction of motile spheroid since day 0) and newly motile spheroids (fraction of motile spheroid that reached motility since the previous time point) in the 3 weeks following dissolution. Out of the 2281 spheroids characterized total, ≈50% consistently showed no signs of motility (despite most having cilia) within this 3‐week period and are referred to as non‐movers. The data shown on this graph only include the motile bots, N = 1127. D) Immunostaining of two separate spheroids from day 0 and day 7 with a‐tubulin (cilia marker), Zonula occludens (ZO)‐1 (tight junction marker), and the nuclear stain 4',6‐diamidino‐2‐phenylindole (DAPI). Amount of multiciliate cells on the spheroid surface show a drastic increase by day 7. E) A day 7 Anthrobot with depth information to show full cilia coverage. Bots in panels D,E were immunostained with α‐tubulin (cilia marker), ZO‐1 (tight junction marker), and DAPI (nuclear stain). Colors represent tissue depth. All scalebars on this figure feature 50 um.
Figure 2
Figure 2
Anthrobots self‐organize into discrete movement types. A) Anthrobots display different movement types. Scalebar 100 uM. B) Distribution of all 30‐second periods in the analysis plotted by their straightness and gyration indices, showing signs of clustering near three of the 4 corners of the plot. C) Clustered scatter plot of all 30 s periods with centers of cluster marked and colored. D) Prototypical examples from each cluster with 30 s sample trajectories. E) Quantitative comparison of key characteristics of the four clusters in terms of intra‐cluster homogeneity “average dissimilarity”) and occurrence frequency (“% of observations”) which show that the largest clusters 1 and 2 have relatively low dissimilarity indicating these are the most consistent behavioral patterns. F) Comparison of gyration and straightness indices for each cluster with significance levels indicated, showing that each cluster occupies a unique, quantifiable position in the sample space. P‐value range after pairwise 2‐sample t‐test of 0 to 0.0001 corresponded to ****, 0.0001 to 0.001 corresponded to ***, 0.001 to 0.01 corresponded to **, 0.01 to 0.05 corresponded to * and 0.05 to 1 corresponded to ns. Cluster one had 6004 30 s periods, cluster two had 6700, cluster three had 3436 and cluster 4 had 2384. G) Markov chain showing state transitions between different clusters (same as in Figure 2F) and the degree of commitment to a given behavior (persistence), with the circular bots (type 1) as the most committed category with 92.1% chance of the next period being a circular if the current period is a circular. It is followed by linear and curvilinear, which are also relatively consistent at 80.0% and 75.3% respectively. Cluster 4, or the eclectics, as expected, are very unstable, with a consistency of only 39.6%. Cluster 4 seems to act as a sort of intermediate, since there is a substantial chance of the eclectics converting to linear (34.5%) or to a lesser degree circular (15.0%) or curvilinear (10.7%). The transition probability between circulars and linear and vice versa is the lowest and almost nonexistent, at 0.3% and 0.2% respectively. Linear, curvilinear, and circulars rarely convert into eclectics with a probability of 12.3%, 7.5%, 5.8% respectively (and when they do, it is most likely due to collisions or using eclectics as an intermediary).
Figure 3
Figure 3
Anthrobots self‐organize into distinct morphological types. A) Anthrobot immunocytochemistry enables morphological classification pipeline. Sample immunological stain for cilia (acctub, i.e., acetylated α‐tubulin) and apical layer marked by the tight junction marker (ZO1) acquired as a complete 3D Z‐stack showing the Anthrobot body boundaries and cilia localization on the body. B) Binarized version of the sample immunological data, used as input to the morphological characterization pipeline. C) Binarized body and cilia information from 350 Anthrobots plotted along 8 morphological indices on an 8D cloud and clustered with the unsupervised Ward.D2 method, which identify global clusters based on the proximity of the centroids of locally emerging clusters and merging them together when applicable. PCA showing the three morphotypical clusters on the highest variation plane, marked by PC1 and PC2. Red dashed circles point to specific examples featured in panel E, selected from the cluster edges for distinct representation. D) Distinct morphotypes translate with significance to differences in real‐life morphological metrics, characterized by 8 variables from which the PCA was computed. P‐value range of 0 to 0.0001 corresponded to ****, 0.0001 to 0.001 corresponded to ***, 0.001 to 0.01 corresponded to **, 0.01 to 0.05 corresponded to * and 0.05 to 1 corresponded to ns. Cluster 1,2 and 3 in the analysis corresponded to the clusters in the PCA, with n = 125, 24 and 201 respectively. We ran a two‐sided, two‐sample t‐test on all pairs of clusters, for all 8 variables, which are then plotted here. E) Sample morphotype examples for Type 1, 2 and 3 chosen for their ability to best represent the cluster. Type 1 Anthrobots are small, regularly shaped, tightly and uniformly covered by cilia. Type 2 and 3 bots are larger, more irregularly shaped and have less tightly‐knit cilia patterns, with type 3 bots featuring significantly more polarized cilia coverage. Scalebar 50 uM. F) Decision tree of Anthrobot morphogenesis with two major checkpoints as revealed by the PCA hierarchy: first decision point is size/shape (has equal impact), second decision point is cilia localization pattern.
Figure 4
Figure 4
Distinct movement types and morphotypes are highly correlated. A) PCA of 350 bots forming 3 morphotypical clusters, showing that there is significant overlap between these clusters and the separately marked non‐movers, linear and circulars. Red dashed circles mark specific examples featured in panel B, selected from the cluster edges for distinct representation. B) Sample morphotype examples from each cluster, corresponding to Cluster 1, 2 and 3 and Nonmover, Linear, and Circular, respectively chosen for their ability to best represent the morphotype versus movement type mapping. Scalebar 50 uM and applies to all three bots. C) Waddington landscape illustrating the logic of determination of bot behavior and their relation to morphotypical indices with end behavioral products, as well as the potential states possible at each level of bifurcation of the bots’ development. (Waddington Landscape image modified from J. Ferrell, 2012.) D) PCA and unsupervised clustering showing the polarization among linear and circular bots in respect to bilateral symmetry metrics. E) Difference in asymmetry of cilia distribution between the movement axis and its 90‐degree offset axis. Here, n = 15 and 13 for Circulars and Linear respectively, with p = 0.0482 and 0.1116 done by one‐sample t‐test for each with alternative hypothesis.
Figure 5
Figure 5
Anthrobots can move across living monolayers in vitro. A) A representative timelapse video of an Anthrobot as it moves along a neural scratch in vitro. B) Sample tracking video output with scratch edge highlighted in yellow and bot path in red. The rotation of the bot is measured through the change in the orientation of the green and red bars attached to the center of the bot in white. C) The significant (p = 0.017, slope 1.15, n = 17, t‐test for slope) positive relationship between bot gyration index and proportion of bot's body in contact with scratch suggest that circular bots cover the edges of the scratch more as they move along the scratch. D) The significant (p = 0.031, slope 0.0082, n = 17, t‐test for slope) positive relationship between bot speed and proportion of bot's body in contact with scratch further suggest that faster bots also cover the edges of the scratch more as they move along the scratch. E) For a subset of bots (dataset constrained to non‐stalling bots with rotational tendencies between 0.33 and 0.7 and viable tracking videos), the quadratic (alternative curves were insignificant) relationship (p = 0.006, n = 13, t‐test) between bot gyration index and scratch‐trajectory similarity metric suggests that there is a goldilocks zone for the bot rotational tendency for maximum scratch area exploration. This quadratic relationship was revealed when we initially tested for a linear relationship between these two metrics by plotting the residuals against the fitted values for the model, and observed a clear quadratic trend among the residuals (see Figure S9, Supporting Information), which strongly suggested the fitting of a quadratic model instead, which is shown here. Consistent with these statistical analyses, in the experimental space we observed that bots with very low rotational tendencies interacted minimally with the scar edges while bots with very high rotational tendencies skidded in place or was prone to veering off the scratch edge. There appears to be an optimal amount of rotation for a bot to move across the scratch while faithfully following the scratch edge.
Figure 6
Figure 6
Anthrobots can promote gap closures on scratched live neuronal monolayers. A) sample micrograph of a bridge across a neural scratch over time from bridge inoculation day (day0) to days 1 and 2. B) An overlay of a bridge bot and the induced “stitch” (i.e., gap closure site) at the end of the observation on day 3. C) Immunological staining of neurons with Beta III Tubulin (Tuj1) upon fixation on day 3 after the bots were introduced to the system, showing an induced neural gap closure at the site of bot settlement. D) Among N = 10 experimental replicates, 50% of the Anthrobot bridges have maintained connectivity to both sides of the scratch area across all three days of the experiment (i.e., fully connected bridges), and among these bridges, 100% has yielded gap closure underneath at the neuronal scratch site. Shown here is a quantification of the resulting tissue on day 3 of all fully connected bridges measured by average proportion of neuronal coverage by pixel counts for each positional category: gap closure site, unscratched native tissue (calculated by the average of the two neuron‐heavy area pixel coverage), adjacent and distant sites to the gap closure. Difference between gap closure site and native tissue is insignificant (p = 0.37), while the difference between the gap closure site and both adjacent and distal scratch sites are significant (w/ p = 0.006 and p = 0.005, respectively); that suggests the tissue at the gap closure site is as dense as the native tissue, and the gap closure effect follows a crisp profile as opposed to a gradient profile. P‐value range of 0 to 0.0001 corresponded to ****, 0.0001 to 0.001 corresponded to ***, 0.001 to 0.01 corresponded to **, 0.01 to 0.05 corresponded to * and 0.05 to 1 corresponded to ns. See methods section for example frame of a sampling region. Scratch lengths varied between 150–500 um E) Immunological staining of another sample bridge superbot (green) and the neuronal tissue (red). All scalebars on this figure feature 200 microns.

References

    1. Pezzulo G., Levin M., Integr. Biol. 2015, 7, 1487. - PMC - PubMed
    1. a) Kamm R. D., Bashir R., Ann. Biomed. Eng. 2014, 42, 445; - PMC - PubMed
    2. b) Kamm R. D., Bashir R., Arora N., Dar R. D., Gillette M. U., Griffith L. G., Kemp M. L., Kinlaw K., Levin M., Martin A. C., Mcdevitt T. C., Nerem R. M., Powers M. J., Saif T. A., Sharpe J., Takayama S., Takeuchi S., Weiss R., Ye K., Yevick H. G., Zaman M. H., APL Bioeng. 2018, 2, 040901; - PMC - PubMed
    3. c) Ebrahimkhani M.o R., Levin M., iScience 2021, 24, 102505; - PMC - PubMed
    4. d) Doursat R., Sánchez C., Soft Robot 2014, 1, 110;
    5. e) Doursat R., Sayama H., Michel O., Nat. Comput. 2013, 12, 517.
    1. a) Andrianantoandro E., Basu S., Karig D. K., Weiss R., Mol. Syst. Biol. 2006, 2, 0028; - PMC - PubMed
    2. b) Teague B. P., Guye P., Weiss R., Cold Spring Harb. Perspect. Biol. 2016, 8, a023929; - PMC - PubMed
    3. c) Davies J. A., J. Anat. 2008, 212, 707; - PMC - PubMed
    4. d) Santorelli M., Lam C., Morsut L., Curr. Opin. Biotechnol. 2019, 59, 130; - PMC - PubMed
    5. e) Johnson M. B., March A. R., Morsut L., Curr. Opin. Biomed. Eng. 2017, 4, 163; - PMC - PubMed
    6. f) Ho C., Morsut L., Stem Cell Rep. 2021, 16, 1051; - PMC - PubMed
    7. g) Hoffman T., Antovski P., Tebon P., Xu C., Ashammakhi N., Ahadian S., Morsut L., Khademhosseini A., Adv. Funct. Mater. 2020, 30, 1909882;
    8. h) Aydin O., Passaro A. P., Raman R., Spellicy S. E., Weinberg R. P., Kamm R. D., Sample M., Truskey G. A., Zartman J., Dar R. D., Palacios S., Wang J., Tordoff J., Montserrat N., Bashir R., Saif M. T. A., Weiss R., APL Bioeng. 2022, 6, 010903; - PMC - PubMed
    9. i) Ebrahimkhani M. R., Ebisuya M., Curr. Opin. Chem. Biol. 2019, 9, 9; - PubMed
    10. j) Toda S., Frankel N. W., Lim W. A., Curr. Opin. Chem. Biol. 2019, 52, 31; - PubMed
    11. k) Gumuskaya G., Massachusetts Institute of Technologuy 2018;
    12. l) Morsut L., Roybal K. T., Xiong X., Gordley R. M., Coyle S. M., Thomson M., Lim W. A., Cell 2016, 164, 780; - PMC - PubMed
    13. m) Toda S., Blauch L. R., Tang S. K. Y., Morsut L., Lim W. A., Science 2018, 361, 156; - PMC - PubMed
    14. n) Toda S., Mckeithan W. L., Hakkinen T. J., Lopez P., Klein O. D., Lim W. A., Science 2020, 370, 327; - PMC - PubMed
    15. o) Karig D., Martini K. M., Lu T., Delateur N. A., Goldenfeld N., Weiss R., Proc. Natl. Acad. Sci. USA 2018, 115, 6572; - PMC - PubMed
    16. p) Gumuskaya G., Int. J. Archit. Comput. 2021, 19, 121;
    17. q) Basu S., Gerchman Y., Collins C. H., Arnold F. H., Weiss R., Nature 2005, 434, 1130; - PubMed
    18. r) Basu S., Mehreja R., Thiberge S., Chen M.‐T., Weiss R., Proc. Natl. Acad. Sci. USA 2004, 101, 6355. - PMC - PubMed
    1. a) Ricotti L., Trimmer B., Feinberg A. W., Raman R., Parker K. K., Bashir R., Sitti M., Martel S., Dario P., Menciassi A., Sci Robot 2017, 2, eaaq0495; - PubMed
    2. b) Menciassi A., Takeuchi S., Kamm R. D., APL Bioeng. 2020, 4, 020401. - PMC - PubMed
    1. a) Sakar M. S., Neal D., Boudou T., Borochin M. A., Li Y., Weiss R., Kamm R. D., Chen C. S., Asada H. H., Lab Chip 2012, 12, 4976; - PMC - PubMed
    2. b) Chan V., Park K., Collens M. B., Kong H., Saif T. A., Bashir R., Sci. Rep. 2012, 2, 857; - PMC - PubMed
    3. c) Nawroth J. C., Lee H., Feinberg A. W., Ripplinger C. M., Mccain M. L., Grosberg A., Dabiri J. O., Parker K. K., Nat. Biotechnol. 2012, 30, 792; - PMC - PubMed
    4. d) Raman R., Cvetkovic C., Uzel S. G. M., Platt R. J., Sengupta P., Kamm R. D., Bashir R., Proc. Natl. Acad. Sci. USA 2016, 113, 3497; - PMC - PubMed
    5. e) Park S.‐J., Gazzola M., Park K. S., Park S., Di Santo V., Blevins E. L., Lind J. U., Campbell P. H., Dauth S., Capulli A. K., Pasqualini F. S., Ahn S., Cho A., Yuan H., Maoz B. M., Vijaykumar R., Choi J.‐W., Deisseroth K., Lauder G. V., Mahadevan L., Parker K. K., Science 2016, 353, 158. - PMC - PubMed

Publication types

LinkOut - more resources