. 2024 Jan 23;9(2):e162771.
doi: 10.1172/jci.insight.162771.

Neuronal deletion of the circadian clock gene Bmal1 induces cell-autonomous dopaminergic neurodegeneration

Affiliations

Neuronal deletion of the circadian clock gene Bmal1 induces cell-autonomous dopaminergic neurodegeneration

Michael F Kanan et al. JCI Insight. .

Abstract

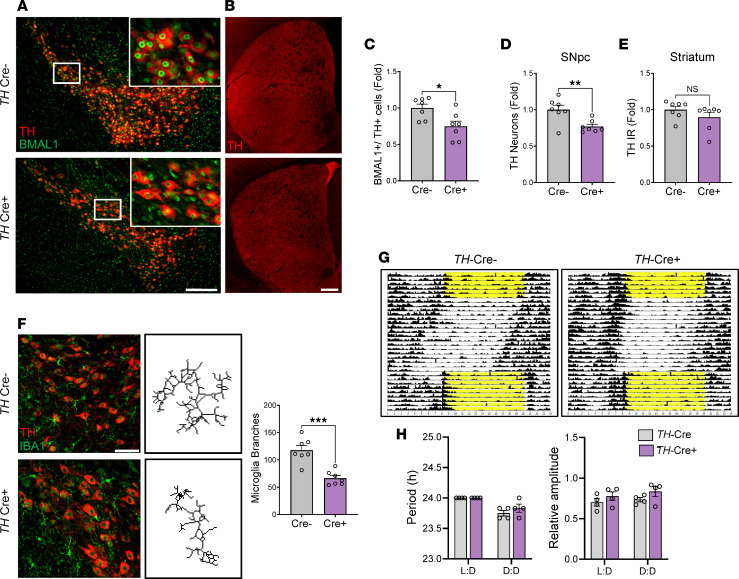
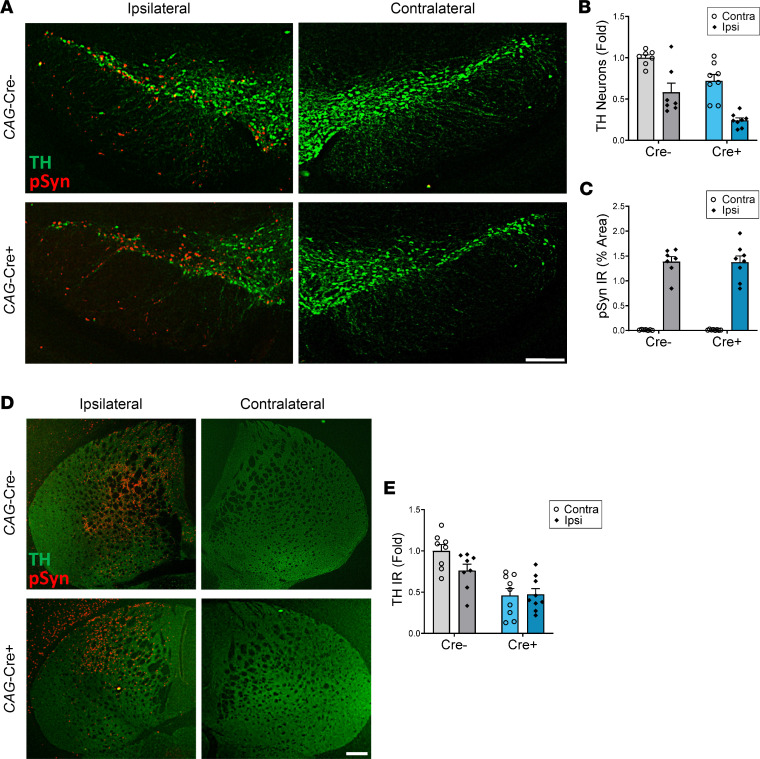
Circadian rhythm dysfunction is a hallmark of Parkinson disease (PD), and diminished expression of the core clock gene Bmal1 has been described in patients with PD. BMAL1 is required for core circadian clock function but also serves nonrhythmic functions. Germline Bmal1 deletion can cause brain oxidative stress and synapse loss in mice, and it can exacerbate dopaminergic neurodegeneration in response to the toxin MPTP. Here we examined the effect of cell type-specific Bmal1 deletion on dopaminergic neuron viability in vivo. We observed that global, postnatal deletion of Bmal1 caused spontaneous loss of tyrosine hydroxylase+ (TH+) dopaminergic neurons in the substantia nigra pars compacta (SNpc). This was not replicated by light-induced disruption of behavioral circadian rhythms and was not induced by astrocyte- or microglia-specific Bmal1 deletion. However, either pan-neuronal or TH neuron-specific Bmal1 deletion caused cell-autonomous loss of TH+ neurons in the SNpc. Bmal1 deletion did not change the percentage of TH neuron loss after α-synuclein fibril injection, though Bmal1-KO mice had fewer TH neurons at baseline. Transcriptomics analysis revealed dysregulation of pathways involved in oxidative phosphorylation and Parkinson disease. These findings demonstrate a cell-autonomous role for BMAL1 in regulating dopaminergic neuronal survival and may have important implications for neuroprotection in PD.

Keywords: Aging; Neurodegeneration; Neuroscience; Parkinson disease.


Figures

Figure 1
Figure 1. Global and brain-specific Bmal1 deletion induces degeneration of dopaminergic neurons in the SNpc.
(A) Representative images of TH (green) and NeuN (red) staining within the SNpc of Cre;Bmal1fl/fl control (CAG-Cre) and CAG-Cre+;Bmal1fl/fl global Bmal1-KO mice (CAG-Cre+). Scale bar: 150 μm. (B) Representative images of TH staining in striatum of CAG-Cre and Cre+ mice. Scale bar: 200 μm. (C) Stereological counts of TH+ cells in the SNpc of CAG-Cre controls and CAG-Cre+ Bmal1-KO mice. n = 5–6 mice per genotype. Fold change normalized to average of Cre condition. (D) Quantification of striatal TH immunoreactivity (IR) intensity from images in B. Fold change normalized to average of Cre condition. (E) Quantification of NeuN IR (% area) in the SNpc of CAG-Cre controls and CAG-Cre+ Bmal1-KO mice. n = 6 mice per genotype. Fold change normalized to average of Cre condition. (F) Representative images of SNpc TH staining (brown) with H&E counterstaining (purple) in the SNpc of Nestin-Cre;Bmal1fl/fl control and Nestin-Cre+;Bmal1fl/fl brain-specific Bmal1-KO mice. Scale bar: 150 μm. (G) Representative images of TH staining in striatum of Nestin-Cre and Cre+ mice. Scale bar: 200 μm. (H) Stereological counts of TH+ cells in the SNpc and Nestin-Cre control (Cre) and Nestin-Cre+ brain-specific Bmal1-KO mice (Cre+). n = 5 mice per genotype. (I) Striatal TH IR intensity quantified from images in G. For CE, H, and I, each circle represents averaged counts from a single mouse, and fold change was normalized to average of Cre condition. In all panels, data represent mean ± SEM. *P < 0.05, **P < 0.01 by 2-tailed t test.
Figure 2
Figure 2. Light-induced circadian disruption does not induce TH+ neuron loss in the SNpc.
(A) Representative actograms showing mouse activity (detected by infrared motion sensor) from mice subjected to control lighting (12-hour/12-hour [12:12] L:D) or 10:10 L:D circadian disruption paradigm. Double plotted; yellow indicates lights on. (B) Representative images of TH (brown) and cresyl violet (purple) staining in WT mice subjected to 10:10 or 12:12 lighting schedules from age 3 months old to 6 months old. Scale bar: 150 μm. (C) Stereological counts of TH+ cells within the SNpc of mice from A. n = 4–5 mice per group. ns, not significant by 2-tailed t test (P > 0.1). Each circle represents data from a single mouse. Fold change was normalized to the average of 12:12 condition. Data are shown as mean ± SEM.
Figure 3
Figure 3. Deletion of Bmal1 in neurons, but not astrocytes, induces dopaminergic neuron loss.
(A) Representative images of TH (brown) and cresyl violet staining in the SNpc of Cre;Bmalfl/fl control and Camk2a-iCre+;Bmalfl/fl neuron-specific Bmal1-KO mice. Scale bar: 150 μm. (B) Quantification of stereological counts of TH+ cells within the SNpc of 4- and 10-month cohorts of Cre control and Cre+ neuron-specific Bmal1-KO mice. n = 3–4 mice per group. Two-way ANOVA showed a significant main effect of Cre genotype (F[1,11] = 24.78, P = 0.0004) but no significant main effect of age or interaction (F[1,11] = 0.1217, P = 0.734). (C) Representative images of TH (brown) and cresyl violet staining in the SNpc of Cre;Bmalfl/fl control and Aldh1l1-CreERT2+;Bmalfl/fl astrocyte-specific Bmal1-KO mice, 2 months after tamoxifen. Scale bar: 150 μm. (D) Quantification of stereological counts of TH+ cells within the SNpc of Cre control and Cre+ astrocyte-specific Bmal1-KO mice. n = 3 mice per group. NS indicates P > 0.1 by 2-tailed t test. For B and D, each circle represents averaged counts from a single mouse, and fold change was normalized to average of Cre condition. In all panels, data represent mean ± SEM.
Figure 4
Figure 4. Transcriptomics analysis of midbrain tissue from Bmal1-KO mice reveals dysregulation of pathways related to Parkinson disease and oxidative phosphorylation.
(A) Expression of known BMAL1 transcriptional targets in cortex from Cre;Bmalfl/fl control and Camk2a-iCre;Bmalfl/fl neuron-specific Bmal1-KO mice at 4 months old. n = 3 mice/genotype. (B) Volcano plot showing differentially expressed genes (DEGs) in cortex tissue from Camk2a-iCre;Bmalfl/fl neuron-specific Bmal1-KO mice, as compared with Cre controls. DEGs with fold change > 2 and uncorrected P < 0.05 are shown in red. Data are derived from n = 3 mice/genotype. (C) KEGG pathway analysis of all DEGs which were up- or downregulation in Camk2a-iCre;Bmalfl/fl cortex with multiple-comparison adjusted P < 0.05. (D) Exploratory volcano plot showing DEGs (DEGs) in midbrain tissue from CAG-CreERt2+;Bmal1fl/fl mice, as compared with Cre controls. DEGs with fold change > 2 and uncorrected P < 0.05 are shown in red. Fabp7 is not shown but is highly significant and upregulated off scale. Data are derived from n = 3 Cre and n = 2 Cre+ mice. (E) Exploratory KEGG pathway analysis of all DEGs that were up- or downregulation in Cre+ midbrain samples with multiple-comparison adjusted P < 0.05.
Figure 5
Figure 5. Tyrosine hydroxylase–specific Bmal1 deletion induces dopaminergic neuron degeneration and increased microgliosis.
(A) TH (red) and BMAL1 (green) staining in the SNpc of Cre;Bmalfl/fl control and TH-Cre;Bmalfl/fl TH-specific Bmal1-KO mice. Insets show loss of nuclear BMAL1 staining in a subset of TH+ neurons from Cre+ mice. Scale bar: 150 μm. (B) TH staining in striatum of TH-Cre and Cre+ mice. Scale bar: 200 μm. (C) Quantification of BMAL1+/TH+ neurons within the SNpc of Cre control and Cre+ TH-specific Bmal1-KO mice. n = 6 mice per genotype. (D) Stereological counts of TH+ cells within the SNpc of Cre control and Cre+ TH-specific Bmal1-KO mice. n = 6 mice per genotype. (E) Quantification of TH immunoreactivity (IR) in striatum, as shown in B. n = 6 mice per genotype. (F) Representative images of TH+ neurons (red) and microglia (Iba1, green) within the SNpc of Cre control and Cre+ TH-specific Bmal1-KO mice. Representative skeletonized microglia reconstructions are shown in the right panels. Scale bar: 60 μm. Graph indicates average branches per microglial cell within the SNpc of Cre control and Cre+ TH-specific Bmal1-KO mice. n = 6 mice per genotype, n = 9–10 microglia per mouse. (G) Representative actrograms showing activity rhythms of TH-Cre and Cre+ mice over 32 days. Yellow indicates lights on. (H) Quantification of period (left) and relative amplitude (right) from actigraphy in G, calculated using data from the 12:12 lights on (L:D) or constant darkness (D:D) periods. For Period and Relative amplitude, no significant main effect of Cre genotype or interaction were observed by 2-way ANOVA. n = 5 mice/genotype. For all panels, each circle represents average data from a single mouse. For CF, *P < 0.05, **P < 0.01, ***P < 0.001 by 2-tailed t test. In all panels, data represent mean ± SEM. All fold changes normalized to average of Cre condition.
Figure 6
Figure 6. Global Bmal1-KO mice does not enhance αSyn-induced dopaminergic neurodegeneration.
(A) Representative images of TH and phospho-αSyn (pSyn) staining in SNpc of Cre;Bmal1fl/fl control (CAG-Cre) and CAG-Cre+;Bmal1fl/fl global Bmal1-KO (CAG-Cre+) 3-month-old mice. after unilateral striatal injection of αSyn PFFs. Scale bar: 150 μm. (B) Quantification of TH+ neurons within the ipsilateral and contralateral SNpc of the mice in A. n = 7–8 mice per genotype, 4 images per mouse. Black diamonds indicate side ipsilateral to PFF injection. Fold change normalized to average of Cre, contralateral condition. Significant main effect of injection side — ipsilateral versus contralateral (F[1,26] = 41.59, P < 0.0001) and Cre genotype (F[1,26] = 19.83, P = 0.0001) were detected by 2-way ANOVA, but interaction was not significant (F[1,26] = 0.1887, P = 0.667). n = 7–8 mice/genotype. (C) Quantification of pSyn staining (% area) in the SNpc of the mice in A. n = 7–8 mice per genotype, with 2 images averaged per mouse. Black diamonds indicate side ipsilateral to PFF injection. Main effect of injection side (ipsilateral versus contralateral) was significant (F[1,26] = 271.0, P < 0.0001) by 2-way ANOVA, but genotype (F[1,26] = 0.005, P = 0.9447) and interaction (F[1,26] = 0.005, P = 0.0940) were not significant. (D) Representative images of TH (green) and pSyn (red) immunoreactivity (IR) in the striatum of Cre;Bmal1fl/fl control (CAG-Cre) and CAG-Cre+;Bmal1fl/fl global Bmal1-KO (CAG-Cre+) 3-month-old mice after unilateral striatal injection of α-synuclein PFFs. Scale bar: 200 μm. (E) Quantification of striatal TH IR intensity from images in D. n = 7–8 mice/genotype. Fold change normalized to average of Cre condition. Main effect of genotype was significant (F[1,30] = 29.13, P < 0.0001) by 2-way ANOVA, but main effect of side of injection (F[1,30] = 2.171, P = 0.1510) and interaction (F[1,30] = 2.712, P < 0.1100) were not significant. In all panels, data represent mean ± SEM, and each circle indicates 1 animal.

References

    1. Hood S, Amir S. The aging clock: circadian rhythms and later life. J Clin Invest. 2017;127(2):437–446. doi: 10.1172/JCI90328. - DOI - PMC - PubMed
    1. Musiek ES, Holtzman DM. Mechanisms linking circadian clocks, sleep, and neurodegeneration. Science. 2016;354(6315):1004–1008. doi: 10.1126/science.aah4968. - DOI - PMC - PubMed
    1. Mohawk JA, et al. Central and peripheral circadian clocks in mammals. Annu Rev Neurosci. 2012;35:445–462. doi: 10.1146/annurev-neuro-060909-153128. - DOI - PMC - PubMed
    1. Bunger MK, et al. Mop3 is an essential component of the master circadian pacemaker in mammals. Cell. 2000;103(7):1009–1017. doi: 10.1016/S0092-8674(00)00205-1. - DOI - PMC - PubMed
    1. Yu EA, Weaver DR. Disrupting the circadian clock: gene-specific effects on aging, cancer, and other phenotypes. Aging (Albany NY) 2011;3(5):479–493. doi: 10.18632/aging.100323. - DOI - PMC - PubMed

Publication types