. 2023 Nov 30;134(3):e173280.
doi: 10.1172/JCI173280.

Sustained hyperglycemia specifically targets translation of mRNAs for insulin secretion

Sustained hyperglycemia specifically targets translation of mRNAs for insulin secretion

Abigael Cheruiyot et al. J Clin Invest. .

Abstract

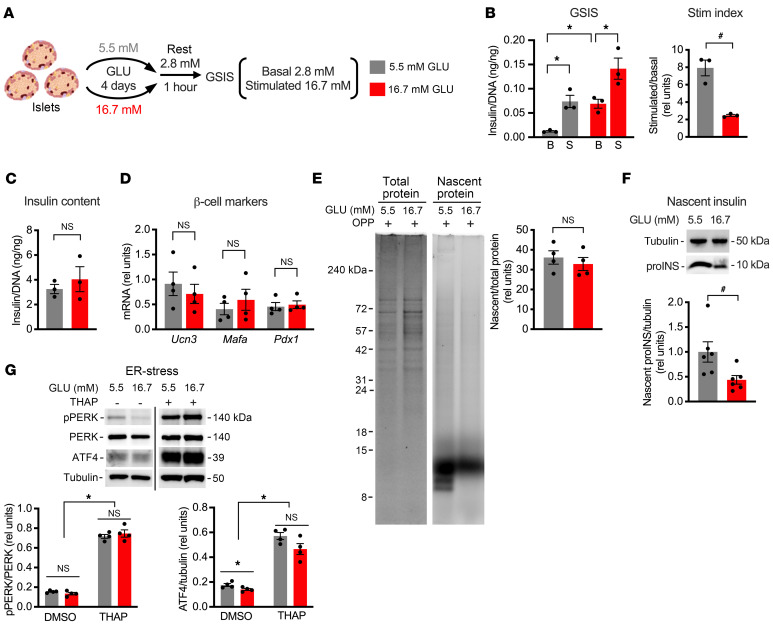
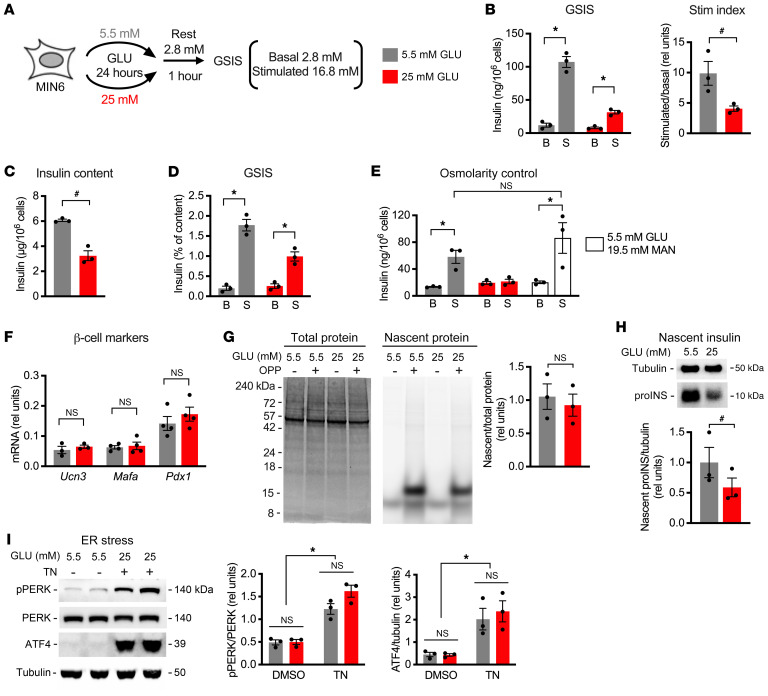
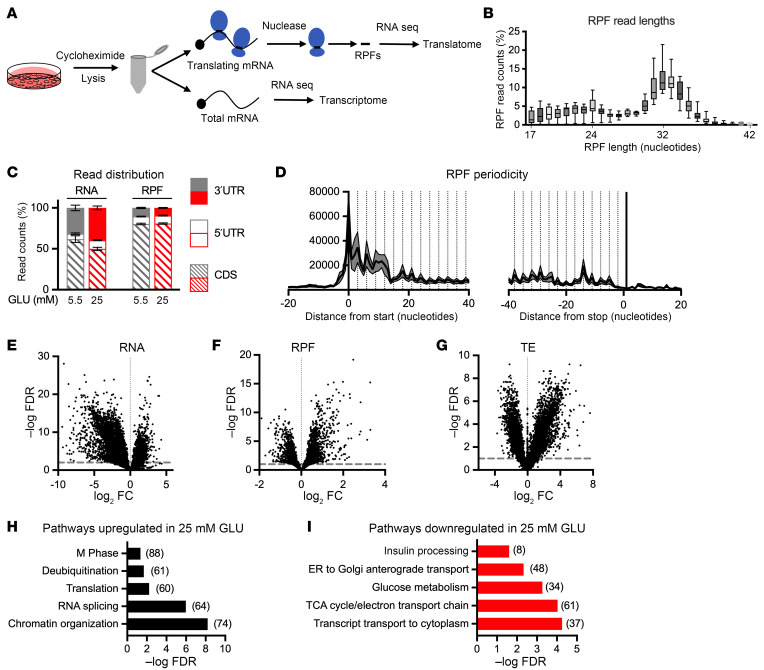
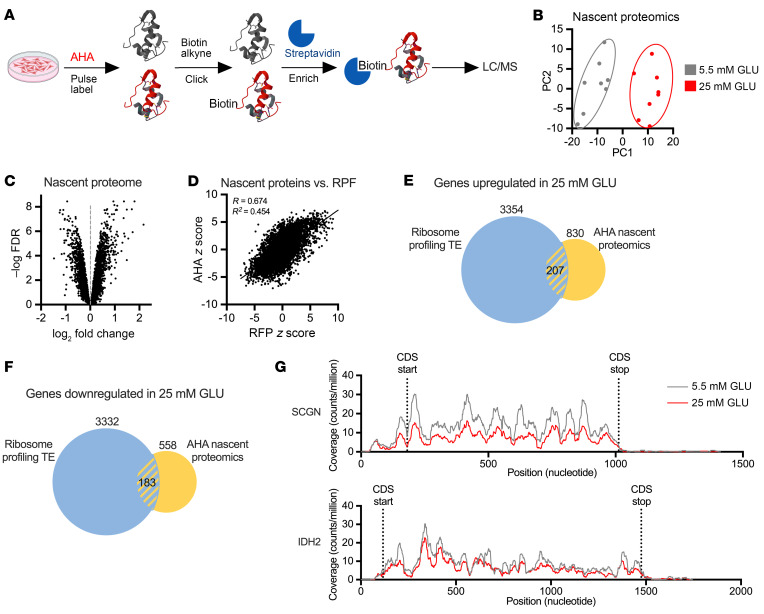
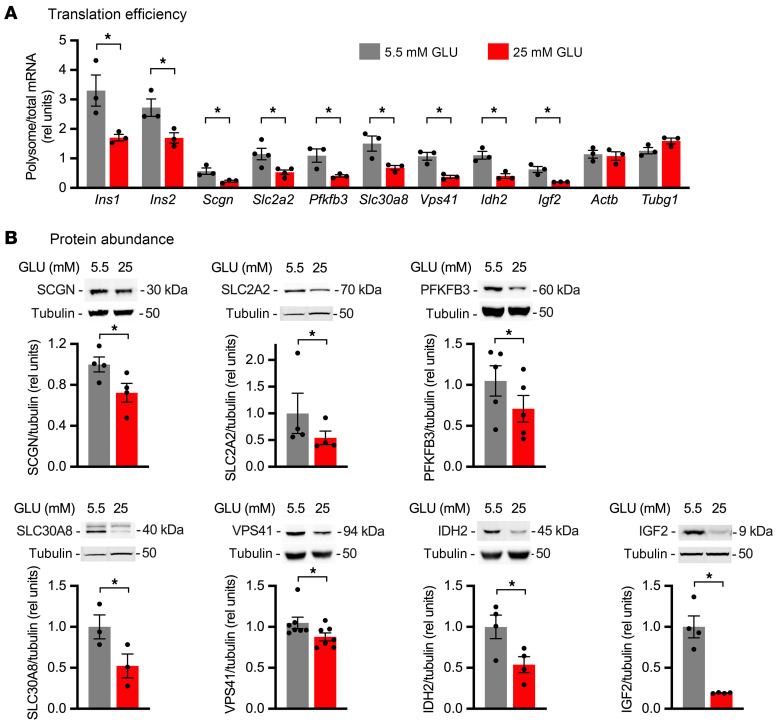
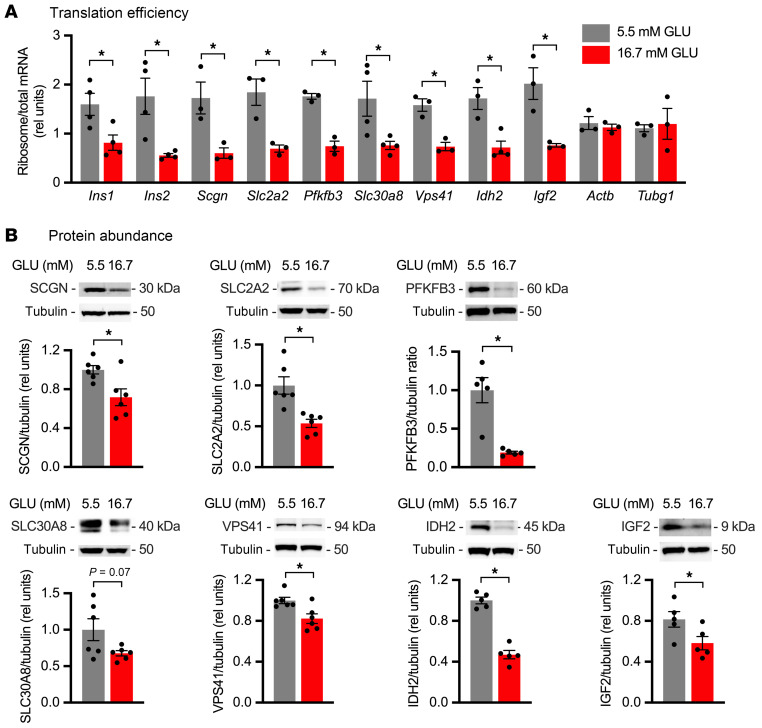
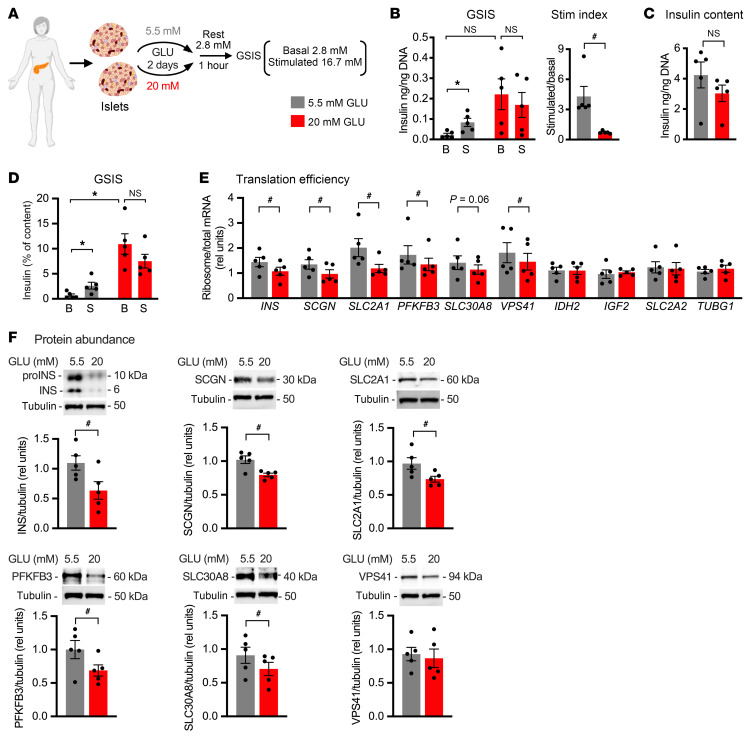
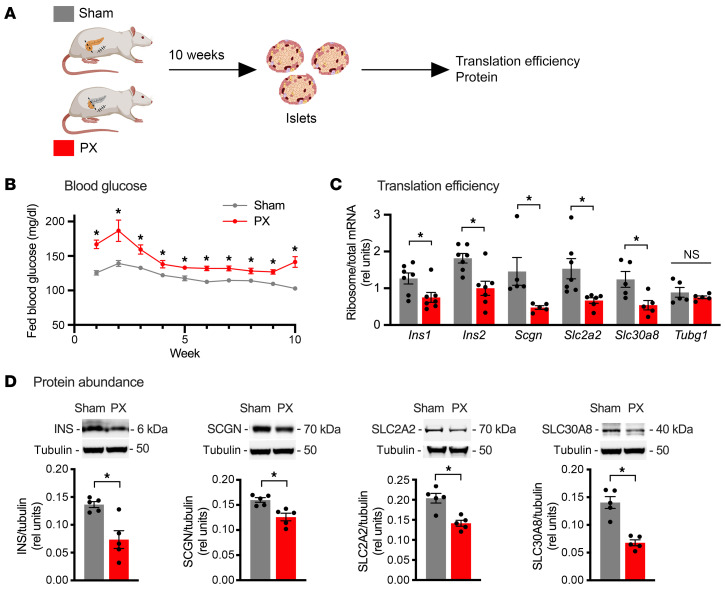
Pancreatic β cells are specialized for coupling glucose metabolism to insulin peptide production and secretion. Acute glucose exposure robustly and coordinately increases translation of proinsulin and proteins required for secretion of mature insulin peptide. By contrast, chronically elevated glucose levels that occur during diabetes impair β cell insulin secretion and have been shown experimentally to suppress insulin translation. Whether translation of other genes critical for insulin secretion is similarly downregulated by chronic high glucose is unknown. Here, we used high-throughput ribosome profiling and nascent proteomics in MIN6 insulinoma cells to elucidate the genome-wide impact of sustained high glucose on β cell mRNA translation. Before induction of ER stress or suppression of global translation, sustained high glucose suppressed glucose-stimulated insulin secretion and downregulated translation of not only insulin, but also mRNAs related to insulin secretory granule formation, exocytosis, and metabolism-coupled insulin secretion. Translation of these mRNAs was also downregulated in primary rat and human islets following ex vivo incubation with sustained high glucose and in an in vivo model of chronic mild hyperglycemia. Furthermore, translational downregulation decreased cellular abundance of these proteins. Our study uncovered a translational regulatory circuit during β cell glucose toxicity that impairs expression of proteins with critical roles in β cell function.

Keywords: Beta cells; Endocrinology; Islet cells; Metabolism; Translation.


Conflict of interest statement

Conflict of interest: The authors have declared that no conflict of interest exists.

Figures

Figure 1
Figure 1. Sustained high glucose decreases basal insulin translation in isolated rat islets.
Hand-picked islets from adult Sprague-Dawley rats were cultured for 4 days in medium containing 5.5 mM (gray) or 16.7 mM (red) glucose (GLU). (A) One hour of resting in 2.8 mM GLU was followed by GSIS quantified at 2.8 mM (basal, B) and 16.7 mM (stimulated, S) GLU. (B) GSIS normalized by DNA with stimulation (Stim) index quantified as stimulatory/basal secretion. (C) Insulin content normalized to DNA. (D) Quantification of β cell markers Ucn3, Mafa, and Pdx1 relative to 18S rRNA by quantitative PCR (qPCR). (E) Cells were pulse-labeled with O-propargyl-puromycin (OPP) and analyzed by SDS-PAGE. Total protein was quantified by Coomassie stain (left), and newly synthesized protein was quantified by click-addition of Alexa Fluor 647 (right). Representative images with quantification. (F) Metabolic labeling with OPP was followed by click-biotin addition and streptavidin pull-down of nascent proteins. Immunoblot analysis of newly synthesized proinsulin (proINS) with tubulin control. (G) Representative immunoblots and quantification for ER stress markers with thapsigargin-treated (THAP-treated) control. Mean ± SEM for n = 3–4 independent experiments. *Adjusted P value (Padj) < 0.05, 2-way ANOVA with Bonferroni’s post hoc correction (B [GSIS], D, and G). #P < 0.05, unpaired t test (B [Stim index], C, and E) or ratio-paired t test (F).
Figure 2
Figure 2. Sustained high glucose decreases insulin synthesis in MIN6 cells.
MIN6 cells were incubated in medium containing 5.5 mM (gray) or 25 mM (red) GLU for 24 hours. (A) One hour of resting in 2.8 mM GLU was followed by GSIS quantified at 2.8 mM (B) and 16.8 mM (S) GLU. (B) GSIS normalized by cell number with stimulation index quantified as stimulatory/basal secretion. (C) Insulin content per 106 cells. (D) GSIS normalized to cellular insulin content. (E) GSIS normalized by cell number following incubation in 5.5 mM GLU, 25 mM GLU, or 5.5 mM GLU with 19.5 mM mannitol (MAN, open bars). (F) qPCR quantification of β cell markers Ucn3, Mafa, and Pdx1 relative to 18S rRNA. (G) OPP pulse labeling and SDS-PAGE. Total protein was quantified by Coomassie stain, and newly synthesized protein was quantified by click-addition of Alexa Fluor 647. Representative images with quantification. (H) OPP labeling, click-biotin addition, and streptavidin pull-down of nascent proteins. Immunoblot for newly synthesized proINS and tubulin control. (I) Representative immunoblots and quantification for ER stress markers with tunicamycin-treated (TN-treated) control. Mean ± SEM for n = 3–4 independent experiments. *Padj < 0.05, 2-way ANOVA with Bonferroni’s post hoc correction (B [GSIS], D, E, and I). #P < 0.05, unpaired t test (B [Stim index], C, and G) or ratio-paired t test (H).
Figure 3
Figure 3. Sustained high glucose treatment has genome-wide impact on translation.
MIN6 cells incubated in medium containing 5.5 mM (gray) or 25 mM (red) GLU for 24 hours were analyzed by ribosome profiling. (A) Workflow for RNA sequence analysis of ribosome-protected footprints (RPFs; translatome) and total RNA (transcriptome). (B) RPF read lengths. Boxes indicate 25th to 75th percentiles, line in middle of box is the median, and whiskers go from smallest to largest values. (C) Distribution of reads to coding sequence (CDS; hatched), 5′-UTR (open), and 3′-UTR (filled) for RNAs and RPFs. (D) Triplet periodicity of RPFs near CDS start and stop. (EG) Volcano plots of –log FDR versus log2 fold change (FC), calculated for 25 mM versus 5.5 mM GLU for RNA (E; dotted line FDR = 0.01), RPF (F; dotted line FDR = 0.1), and translation efficiency (TE = RPF/RNA; G; dotted line FDR = 0.1). (H and I) Representative Reactome gene sets overrepresented at a significance threshold FDR < 0.05 as upregulated (H) and downregulated (I) by 25 versus 5.5 mM glucose. Numbers of regulated genes in pathways indicated by numbers in parentheses. n = 8 independent samples per condition.
Figure 4
Figure 4. Sustained high glucose treatment has genome-wide impact on nascent proteome.
MIN6 cells incubated for 24 hours in medium containing 5.5 mM (gray) or 25 mM (red) GLU were analyzed by nascent proteomics. (A) Workflow. (B) Surrogate variable principal component analysis. (C) Volcano plots of –log FDR versus log2 FC, calculated for 25 versus 5.5 mM GLU. (D) Correlation analysis of nascent proteomics z scores versus RPF z scores. (E and F) Overlap of proteins upregulated (E) or downregulated (F) by 25 mM versus 5 mM GLU in both TE and nascent proteomics data sets. –log FDR > 1 and log2 FC > 20%. (G) Representative RPF gene coverage plots for SCGN and IDH2, showing no evidence for new upstream open reading frames or pausing in 25 mM GLU. n = 8 independent samples per condition. CDS, coding sequence.
Figure 5
Figure 5. Translational regulation by sustained high glucose impacts protein abundance in MIN6 cells.
MIN6 cells were incubated for 24 hours in medium containing 5.5 mM (gray) or 25 mM (red) GLU. (A) qPCR quantification of polysome and total RNA for Ins1, Ins2, Scgn, Slc2a2, Pfkfb3, Slc30a8, Vps41, Idh2, and Igf2, relative to 18S rRNA. Actb and Tubg1 as controls. Mean ± SEM for n = 3–4 independent experiments. (B) Immunoblot of cell lysates for SCGN, SLC2A2, PFKFB3, SLC30A8, VPS41, IDH2, and IGF2. Tubulin loading control. Tubulin for the SLC2A2 panel and tubulin for the SLC30A8 panel are identical, since they were the same lanes on the gel. Representative blots with quantification of mean ± SEM for n = 3–7 independent experiments. *P < 0.05, unpaired t test (A) or ratio-paired t test (B).
Figure 6
Figure 6. Translational regulation by sustained high glucose impacts protein abundance in rat islets.
Primary rat islets were incubated for 4 days in medium containing 5.5 mM (gray) or 16.7 mM (red) GLU. (A) qPCR quantification of ribosome-associated and total RNA for Ins1, Ins2, Scgn, Slc2a2, Pfkfb3, Slc30a8, Vps41, Idh2, and Igf2, relative to 18S rRNA. Actb and Tubg1 as controls. Mean ± SEM for n = 3–4 rats. (B) Representative immunoblots of islet lysates for SCGN, SLC2A2, PFKFB3, SLC30A8, VPS41, IDH2, and IGF2. Tubulin loading control. Tubulin for the SLC2A2 panel and tubulin for the SLC30A8 panel are identical, since they were the same lanes on the gel. Quantification of mean ± SEM for n = 5–6 rats. *P < 0.05, unpaired t test (A) or ratio-paired t test (B).
Figure 7
Figure 7. Translational regulation by sustained high glucose impacts protein abundance in human islets.
Human cadaveric islets were cultured for 2 days in medium containing 5.5 mM (gray) or 20 mM (red) GLU. (A) One hour of resting in 2.8 mM GLU was followed by GSIS quantified at 2.8 mM (B) and 16.7 mM (S) GLU. (B) GSIS normalized by DNA with stimulation index quantified as stimulatory/basal secretion. (C) Insulin content normalized to DNA. (D) GSIS normalized to cellular insulin content. (E) qPCR quantification of ribosome-associated and total RNA for INS, SCGN, SLC2A1, PFKFB3, SLC30A8, VPS41, IDH2, IGF2, and SLC2A2, relative to 18S rRNA. TUBG1 as control. (F) Representative immunoblots of islet lysates for INS, SCGN, SLC2A1, PFKFB3, SLC30A8, and VPS41. Tubulin as control. Tubulin for the SCGN panel and tubulin for the VPS41 panel are identical, since they were the same lanes on the gel. Quantification of mean ± SEM for n = 5 donors. *Padj < 0.05, pre-planned paired t test (Bonferroni’s post hoc correction, B [GSIS] and D). #P < 0.05, unpaired t test (B [Stim index] and C), paired t test (E), or ratio-paired t test (F).
Figure 8
Figure 8. Translational regulation by hyperglycemia impacts protein abundance in partial pancreatectomy model of hyperglycemia.
(A) Islets were isolated from Sprague-Dawley rats 10 weeks after sham (gray) or 90% pancreatectomy (PX, red) surgery. (B) Fed blood glucose. Mean ± SEM for n = 21 sham rats, n = 29 PX rats. (C) qPCR quantification of ribosome-associated and total islet RNA for Ins1, Ins2, Scgn, Slc2a2, and Slc30a8, relative to 18S rRNA. Tubg1 as control. Mean ± SEM for n = 5–7 samples, each pooled from 2–3 rats. (D) Representative immunoblots of islet lysates for INS, SCGN, SLC2A2, and SLC30A8 with tubulin as control. Tubulin for INS panel, SCGN panel, and SLC30A8 panel is identical, since these were the same lanes on the gel. Quantification of mean ± SEM for n = 5 samples, each pooled from 2–3 rats. *P < 0.05, unpaired t test (BD).

Update of

References

    1. Halban PA, et al. β-cell failure in type 2 diabetes: postulated mechanisms and prospects for prevention and treatment. Diabetes Care. 2014;37(6):1751–1758. doi: 10.2337/dc14-0396. - DOI - PMC - PubMed
    1. Evans-Molina C, et al. β Cell dysfunction exists more than 5 years before type 1 diabetes diagnosis. JCI Insight. 2018;3(15):e120877. doi: 10.1172/jci.insight.120877. - DOI - PMC - PubMed
    1. [No authors listed] Effect of intensive therapy on residual beta-cell function in patients with type 1 diabetes in the Diabetes Control and Complications trial. A randomized, controlled trial. The Diabetes Control and Complications Trial Research Group. Ann Intern Med. 1998;128(7):517–523. doi: 10.7326/0003-4819-128-7-199804010-00001. - DOI - PubMed
    1. Chen HS, et al. Beneficial effects of insulin on glycemic control and beta-cell function in newly diagnosed type 2 diabetes with severe hyperglycemia after short-term intensive insulin therapy. Diabetes Care. 2008;31(10):1927–1932. doi: 10.2337/dc08-0075. - DOI - PMC - PubMed
    1. Garvey WT, et al. The effect of insulin treatment on insulin secretion and insulin action in type II diabetes mellitus. Diabetes. 1985;34(3):222–234. doi: 10.2337/diab.34.3.222. - DOI - PubMed

Publication types