. 2023 Dec 15;4(4):102734.
doi: 10.1016/j.xpro.2023.102734. Epub 2023 Nov 29.

Deep phenotyping characterization of human unconventional CD8+NKG2A/C+ T cells among T and NK cells by spectral flow cytometry

Affiliations

Deep phenotyping characterization of human unconventional CD8+NKG2A/C+ T cells among T and NK cells by spectral flow cytometry

Aurelio Orta-Resendiz et al. STAR Protoc. .

Abstract

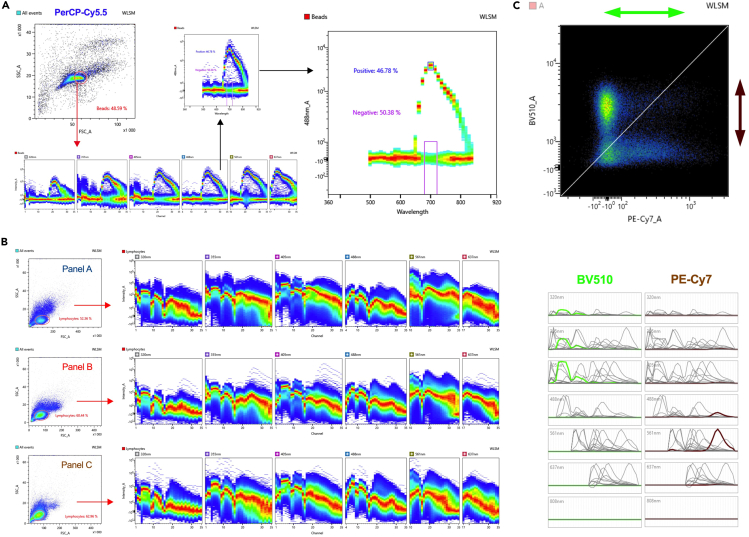
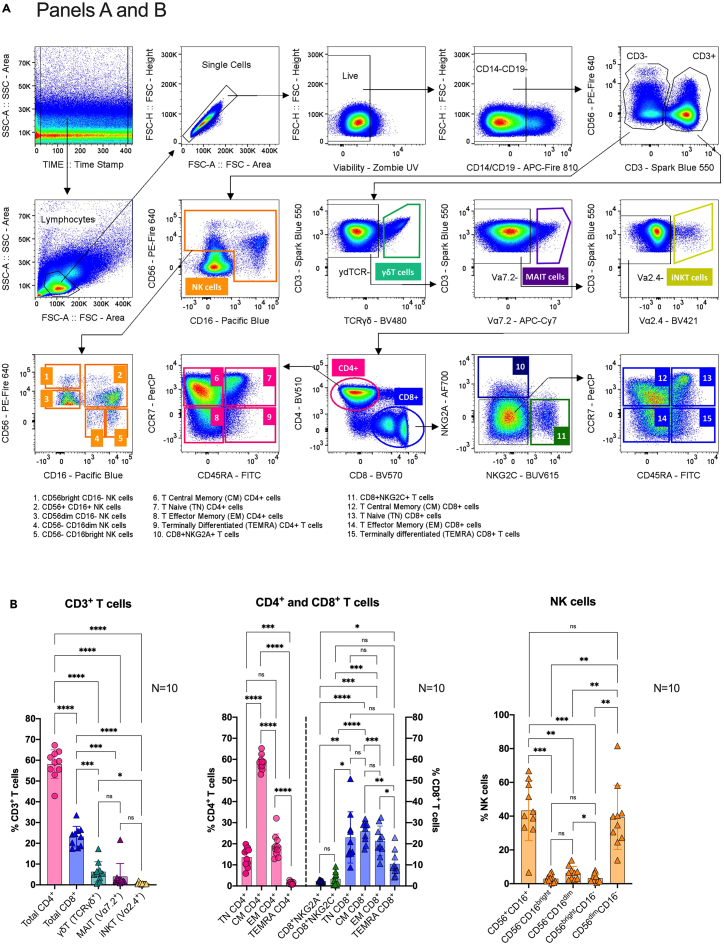
Here, we present a protocol for setting three spectral flow cytometry panels for the characterization of human unconventional CD8+NKG2A/C+ T cells as well as other T and natural killer cell subsets. We describe steps for standardizing, preparing, and staining the cells, the experimental setup, and the final data analysis. This protocol should be advantageous in various settings including immunophenotyping of limited samples, immune function evaluation/monitoring, as well as research in oncology, autoimmune, and infectious diseases.

Keywords: Antibody; Flow Cytometry; Immunology.


Conflict of interest statement

Declaration of interests The authors declare no competing interests.

Figures

None
Graphical abstract
Figure 1
Figure 1
Overview of the panel’s design according to fluorochromes combination (A) Spectrum viewer showing the expected emission for every dye across the channels for the panels (A, B, and C) and their corresponding complexity matrix representing the full spectrum signature similarities for every dye combination. Values inside the matrix (similarity index) closer to zero indicate very different signatures between the two dyes implicated while values closer to one indicate very similar signatures (which might be more difficult to discriminate). (B) Spectrum viewer showing the expected dye emission for PE-Cy5 and PE-Fire 640, which are the ones with the more similar signatures according to the matrix in panel B (similarity index of 0.94). However, in the experimental standardization, both fluorochromes were properly identified and unmixed, allowing the identification of the markers (CD56 and granzyme B) in the final fully stained samples as shown in the FlowJo plot gated on CD3-CD56+ NK cells.
Figure 2
Figure 2
Acquisition of single stained controls and fully stained samples (A) Example of single stained (PerCP-Cy5.5) control beads; the emission is detected across the lasers and then the positive and negative populations can be assigned. This should be done for every single stained control (including the viability marker) in order to run the unmixing algorithm. (B) Target population gated by morphology and ribbon plot examples of fully stained PBMCs showing data acquisition across the channels in every laser. (C) Spectral reference viewer/adjuster (top figure) showing BV510 versus PE-Cy7 dyes. This tool allows (if required) to manually adjusting the positive populations (following the direction of the adjacent arrows) after data acquisition and unmixing. Correspondingly, emission signatures of both fluorochromes are simultaneously shown during adjustment (bottom figure).
Figure 3
Figure 3
Main general gating strategies for panels A and B (A) After time lapse, lymphocyte morphology, single and live events selection, samples are gated to exclude CD14+ and CD19+ cells (monocytes and B cells). Subsequently, CD3-CD56+ cells are gated for further natural killer (NK) cells analysis using CD56 versus CD16 markers. On the other hand, CD3+ cells are gated to discriminate unconventional TCRγδ+ (γδT cells), TCRVα7.2+ (MAIT cells) and TCRVα2.4+ (iNKT cells) lymphocytes. From the remaining T cell population, cells are gated by CD4+ versus CD8+ cells. NKG2A+NKG2C- (CD8+NKG2A+) and NKG2A-NKG2C+ (CD8+NKG2C+) cells are then identified from the CD8+ T cell population. Then, the NKG2A-NKG2C- CD8+ subset as well as the total CD4+ cells are gated according to differentiation markers; CD45+CCR7+ T naïve (TN) cells, CD45-CCR7+ central memory (CM) cells, CD45RA-CCR7- effector memory (EM) cells, and CD45RA+CCR7- terminally differentiated (TEMRA) cells. (B) Correspondingly, example graphs showing manually gated major populations (bottom figures) as proportions from their parent CD3+ T cell population (left), CD4+CD8- and CD4-CD8+ T cells (center), and NK cells (right).Bar graphs represent the means; error bars represent the standard deviation; and dots represent individual donors (N=10). One-way ANOVA with Tukey’s multiple comparison test. Significance is indicated as ∗∗∗∗P ≤ 0.0001, ∗∗∗P ≤ 0.001, ∗∗P ≤ 0.01, ∗P ≤ 0.05, or P > 0.05 (not significant (ns)).
Figure 4
Figure 4
Main gating strategy for panel C (A) Following the positive selection of time lapse, the lymphocyte morphology, and single and live events. Then, to exclude CD14+CD19+ cells. Then, CD3+ cells are gated by CD4+ versus CD8+ cells. Then, CD4+ lymphocytes are subsequently gated to identify CD4+CD25+FOXP3+ regulatory T cells (Treg), CD161+CCR6+ T helper 17 cells (Th17), and CD45RA-CXCR5+ circulating T follicular helper cells (cTfh). The remaining CD4+ cells are further gated on; CD45+CCR7+ T naive (TN) cells, CD45-CCR7+ central memory (CM) cells, CD45RA-CCR7- effector memory (EM) cells, and CD45RA+CCR7- terminally differentiated (TEMRA) cells. (B) Correspondingly, example graph (right) showing manually gated populations as proportions from their CD4+CD8- T cell parent population. Bar graphs represent the means; error bars represent the standard deviation; and dots represent individual donors (N=10). One-way ANOVA with Tukey’s multiple comparison test. Significance is indicated as ∗∗∗∗P ≤ 0.0001, ∗∗∗P ≤ 0.001, ∗∗P ≤ 0.01, ∗P ≤ 0.05, or P > 0.05 (not significant (ns)).
Figure 5
Figure 5
Clustering analysis and expression of markers between the CD3+NKG2A+ and CD3+NKG2C+ T lymphocytes (A) We gated on CD3+NKG2A+NKG2C- (CD3+NKG2A+) and CD3+NKG2CA-NKG2C+ (CD3+NKG2C+) populations (shown in blue and green gates respectively), from single events of live CD14- and CD19- lymphocytes, with the aim to corroborate our previous exclusion gating strategy by running an unsupervised clustering analysis. (B) Using such gating strategy, we concatenated ∼40,000 events for each population from fully stained PBMCs (N = 10). After, we run tSNE analyses with 3,000 iterations selecting all fluorescent parameters except for those previously gated (viability, CD3, CD14, CD19, NKG2A, and NKG2C). Relative expression of markers from panels A and B are shown across the maps for both analyzed subsets (CD3+NKG2A+ and CD3+NKG2C+ T cells). Clusters of CD8+ T cells independent from CD4+, TCRγδ+, TCRVα7.2+, and TCRVα2.4+ T cells can be identified.
Figure 6
Figure 6
Expression analysis of T and NK cell populations Heat maps showing the relative expression of markers (individually normalized MFI) across every subpopulation (∼10,000-concatenated events each) of T and NK cells following the gating strategy from Figures 3 and 4. TN, T naïve cells; CM, central memory cells; EM, effector memory cells; TEMRA, terminally differentiated cells; iNKT, invariant natural killer cells; MAIT, mucosal-associated invariant T cells; γδT, TCRγδ+ T cells; Th17, helper 17 cells; cTfh, circulating T follicular helper cells.

References

    1. Braud V.M., Allan D.S., O’Callaghan C.A., Söderström K., D’Andrea A., Ogg G.S., Lazetic S., Young N.T., Bell J.I., Phillips J.H., et al. HLA-E binds to natural killer cell receptors CD94/NKG2A, B and C. Nature. 1998;391:795–799. - PubMed
    1. Walsh C.E., Ryan E.J., O’Farrelly C., Golden-Mason L., FitzGerald O., Veale D.J., Bresnihan B., Fearon U. Differential expression of NK receptors CD94 and NKG2A by T cells in rheumatoid arthritis patients in remission compared to active disease. PLoS One. 2011;6 - PMC - PubMed
    1. Katsurada T., Kobayashi W., Tomaru U., Baba T., Furukawa S., Ishizu A., Takeda K., Sakamoto N., Asaka M., Takeda H., Kasahara M. Decrease of peripheral and intestinal NKG2A-positive T cells in patients with ulcerative colitis. PLoS One. 2012;7 - PMC - PubMed
    1. Li W.-X., Pan H.-F., Hu J.-L., Wang C.-Z., Zhang N., Li J., Li X.-P., Xu J.-H., Ye D.-Q. Assay of T- and NK-cell subsets and the expression of NKG2A and NKG2D in patients with new-onset systemic lupus erythematosus. Clin. Rheumatol. 2010;29:315–323. - PubMed
    1. Kasakovski D., Zeng X., Lai J., Yu Z., Yao D., Chen S., Zha X., Li Y., Xu L. Characterization of KIR + NKG2A + Eomes- NK-like CD8+ T cells and their decline with age in healthy individuals. Cytometry B Clin. Cytom. 2021;100:467–475. - PubMed

Publication types