. 2023 Nov 30;18(11):e0294283.
doi: 10.1371/journal.pone.0294283. eCollection 2023.

A rapid, low-cost, and highly sensitive SARS-CoV-2 diagnostic based on whole-genome sequencing

Affiliations

A rapid, low-cost, and highly sensitive SARS-CoV-2 diagnostic based on whole-genome sequencing

Per A Adastra et al. PLoS One. .

Abstract

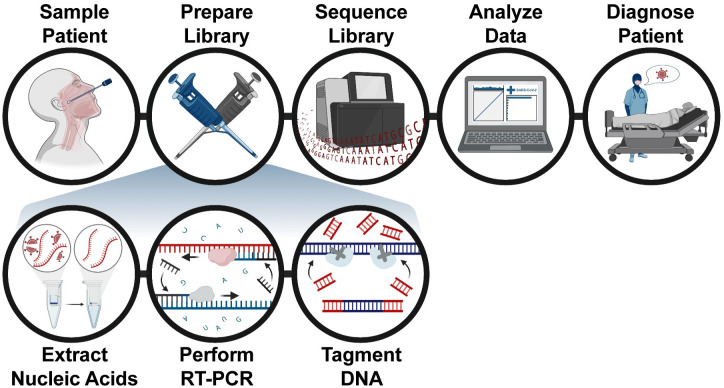
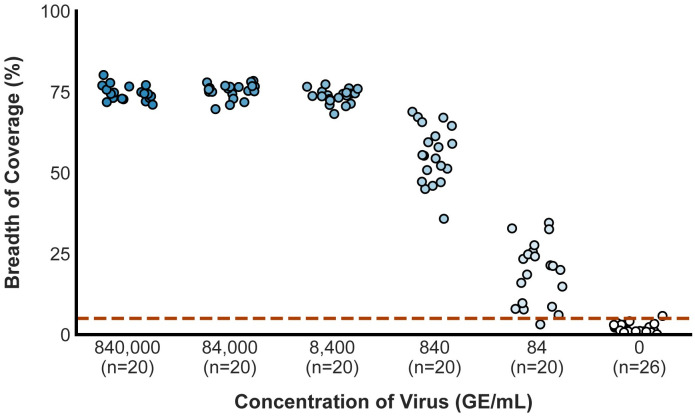
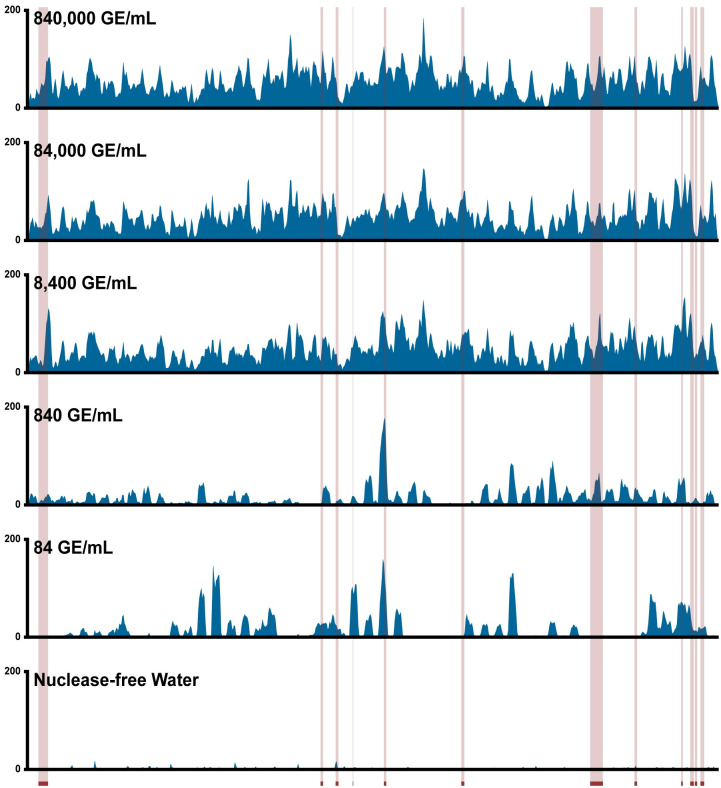
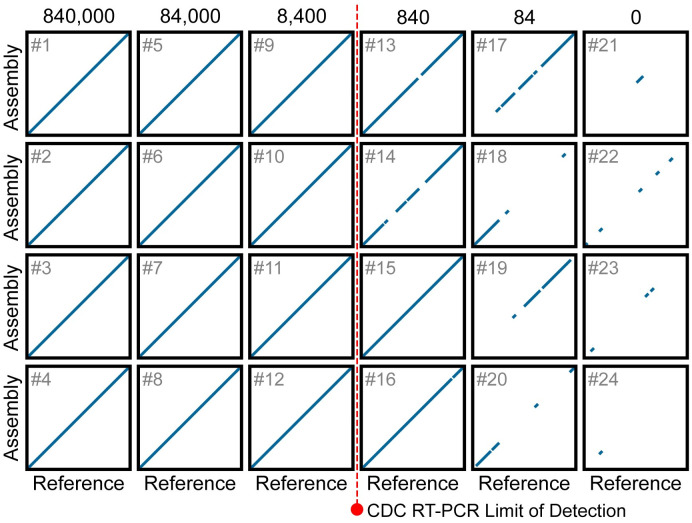
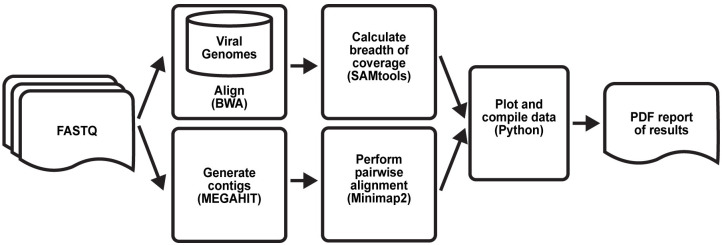
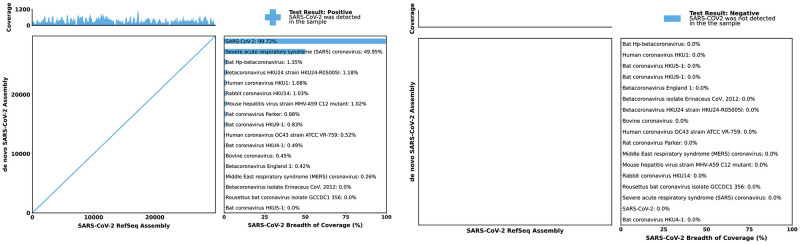
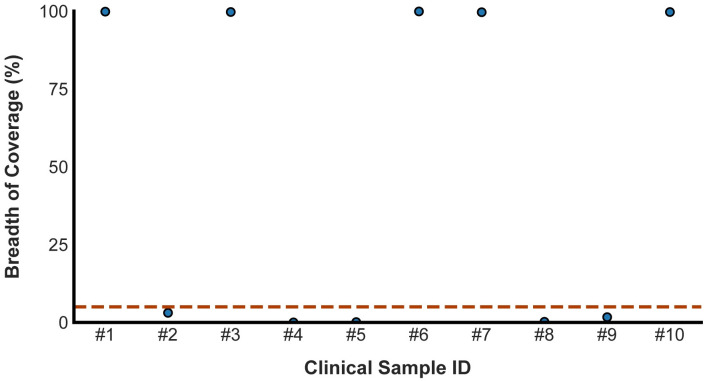
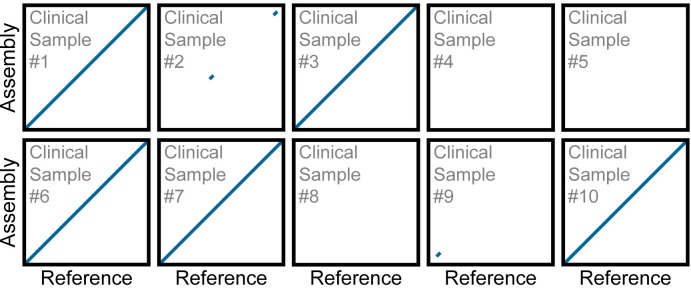
Early detection of SARS-CoV-2 infection is key to managing the current global pandemic, as evidence shows the virus is most contagious on or before symptom onset. Here, we introduce a low-cost, high-throughput method for diagnosing and studying SARS-CoV-2 infection. Dubbed Pathogen-Oriented Low-Cost Assembly & Re-Sequencing (POLAR), this method amplifies the entirety of the SARS-CoV-2 genome. This contrasts with typical RT-PCR-based diagnostic tests, which amplify only a few loci. To achieve this goal, we combine a SARS-CoV-2 enrichment method developed by the ARTIC Network (https://artic.network/) with short-read DNA sequencing and de novo genome assembly. Using this method, we can reliably (>95% accuracy) detect SARS-CoV-2 at a concentration of 84 genome equivalents per milliliter (GE/mL). The vast majority of diagnostic methods meeting our analytical criteria that are currently authorized for use by the United States Food and Drug Administration with the Coronavirus Disease 2019 (COVID-19) Emergency Use Authorization require higher concentrations of the virus to achieve this degree of sensitivity and specificity. In addition, we can reliably assemble the SARS-CoV-2 genome in the sample, often with no gaps and perfect accuracy given sufficient viral load. The genotypic data in these genome assemblies enable the more effective analysis of disease spread than is possible with an ordinary binary diagnostic. These data can also help identify vaccine and drug targets. Finally, we show that the diagnoses obtained using POLAR of positive and negative clinical nasal mid-turbinate swab samples 100% match those obtained in a clinical diagnostic lab using the Center for Disease Control's 2019-Novel Coronavirus test. Using POLAR, a single person can manually process 192 samples over an 8-hour experiment at the cost of ~$36 per patient (as of December 7th, 2022), enabling a 24-hour turnaround with sequencing and data analysis time. We anticipate that further testing and refinement will allow greater sensitivity using this approach.


Conflict of interest statement

The authors have declared that no competing interests exist.

Figures

Fig 1
Fig 1. Pathogen-oriented low-cost assembly & re-sequencing method overview.
The patient is sampled in the clinic, and the total RNA from this sample is extracted and reverse-transcribed into DNA. The sample is then enriched for SARS-CoV-2 sequence using a SARS-CoV-2 specific primer library. The amplicons then undergo a rapid tagmentation-mediated library preparation. Data is then analyzed and used to report patient results the next day.
Fig 2
Fig 2. The breadth of coverage across starting concentrations of SARS-CoV-2.
The scatter plot shows the breadth of coverage for samples from lower replicate dilution series and negative controls. The dashed red line represents the empirically determined breadth of coverage threshold for positive samples. Alternative approaches to calculate this threshold are described in the supplement and do not differ significantly from this value.
Fig 3
Fig 3. Genome coverage of SARS-CoV-2 across starting concentrations using POLAR.
Coverage tracks demonstrate sequencing depth across the SARS-CoV-2 genome produced by our method from samples with a range of starting SARS-CoV-2 genome concentrations. Red-highlighted regions represent viral loci detected by RT-PCR-based diagnostic tests in use or development.
Fig 4
Fig 4. Dot plots showing the alignment of chromosome-length contigs from de novo assemblies to the SARS-CoV-2 reference.
Each rescaled genome dot plot (black boxes numbered 1 to 24) compares a de novo SARS-CoV-2 assembly (Y-axes) to the SARS-CoV-2 reference genome (X-axes). Columns contain replicate assemblies at a given SARS-CoV-2 concentration. The de novo assemblies displayed on the Y-axes have been ordered and oriented to match the reference viral genome to facilitate comparison. Each line segment represents the position of an individual contig from the de novo assembly that aligned to the reference genome. The dotted red line represents the limit of detection for the Center for Disease Control RT-PCR-based diagnostic tests currently used to detect SARS-CoV-2. For rescaled dot plots, contigs were sorted, and unmapped contigs were removed, leaving all remaining aligning contigs lying along the diagonal. Each de novo assembly was generated using 150,000 75-PE reads.
Fig 5
Fig 5. Dot plots showing the alignment of contigs from de novo assemblies of non-SARS-CoV-2 viruses to their respective reference.
Genome dot plots comparing de novo assemblies and reference genomes for test samples spiked with non-SARS-CoV-2: Avian Coronavirus, Human Coronavirus strain 229E, Porcine Respiratory Coronavirus, and Human Coronavirus NL63. The de novo assembly is placed on the Y-axis, and the species-matched reference genomes are on the X-axis. The de novo assemblies displayed on the Y-axes have been ordered and oriented to match the reference viral genomes to facilitate comparison.
Fig 6
Fig 6. Bioinformatics evaluation of assembly and re-sequencing pipeline overview.
Workflow diagram describing the one-click analysis pipeline. The pipeline aligns the sequenced reads to a database of coronaviruses; if run on a cluster, this is done in parallel. Separately, the pipeline creates contigs from the sequenced reads. The resulting de novo assembly is then pairwise aligned to the SARS-CoV-2 reference genome. A custom Python script then analyzes these data to determine the test result and compiles the dot plot and alignment percentages into a single PDF.
Fig 7
Fig 7. Bioinformatics evaluation of assembly and re-sequencing report examples.
Each report includes a genome dot plot of the de novo assembly against the SARS-CoV-2 reference genome, with a coverage track of sequenced reads aligned to the SARS-CoV-2 reference genome above the dot plot. The report also includes the breadth of coverage of sequenced reads aligned to 17 different Betacoronaviruses. Finally, the diagnostic answer is given in the form of a “+” or “-” symbol and “Positive” or “Negative” for SARS-CoV-2 coronavirus in the top right corner of the report.
Fig 8
Fig 8. The breadth of coverage across clinical samples.
The Scatter plot shows the breadth of coverage for all ten clinical samples. The dashed red line represents the breadth of coverage threshold for positive samples. The breadth of coverage of each library was calculated using 150, 000 75-PE reads.
Fig 9
Fig 9. Dot plots show contig alignment from de novo assemblies generated from clinical samples to the SARS-CoV-2 reference.
Each rescaled genome dot plot compares the de novo SARS-CoV-2 assembly (Y-axes) created directly from a clinical sample to the SARS-CoV-2 reference genome (X-axes). The de novo assemblies displayed on the Y-axes have been ordered and oriented to match the reference viral genome to facilitate comparison. Each line segment represents the position of an individual contig from the de novo assembly aligned to the reference genome. For rescaled dot plots, contigs were sorted, and unmapped contigs were removed, leaving all remaining aligning contigs lying along the diagonal. Each de novo assembly was generated using 150,000 75-PE reads.

References

    1. Worldometers.info. COVID Live—Coronavirus Statistics—Worldometer. 9 Nov 2022 [cited 7 Nov 2022]. https://www.worldometers.info/coronavirus/.
    1. He X, Lau EHY, Wu P, Deng X, Wang J, Hao X, et al.. Temporal dynamics in viral shedding and transmissibility of COVID-19. Nature Medicine 2020 26:5. 2020;26: 672–675. doi: 10.1038/s41591-020-0869-5 - DOI - PubMed
    1. To KKW, Tsang OTY, Leung WS, Tam AR, Wu TC, Lung DC, et al.. Temporal profiles of viral load in posterior oropharyngeal saliva samples and serum antibody responses during infection by SARS-CoV-2: an observational cohort study. Lancet Infect Dis. 2020;20: 565–574. doi: 10.1016/S1473-3099(20)30196-1 - DOI - PMC - PubMed
    1. SARS-CoV-2 Viral Mutations: Impact on COVID-19 Tests | FDA. [cited 8 Dec 2022]. https://www.fda.gov/medical-devices/coronavirus-covid-19-and-medical-dev....
    1. Zimmerman PA, King CL, Ghannoum M, Bonomo RA, Procop GW. Molecular Diagnosis of SARS-CoV-2: Assessing and Interpreting Nucleic Acid and Antigen Tests. Pathog Immun. 2021;6: 135–156. doi: 10.20411/pai.v6i1.422 - DOI - PMC - PubMed