. 2023 Nov 16:14:1309138.
doi: 10.3389/fimmu.2023.1309138. eCollection 2023.

Optimal combination of MYCN differential gene and cellular senescence gene predicts adverse outcomes in patients with neuroblastoma

Affiliations

Optimal combination of MYCN differential gene and cellular senescence gene predicts adverse outcomes in patients with neuroblastoma

Jiaxiong Tan et al. Front Immunol. .

Abstract

Introduction: Neuroblastoma (NB) is a common extracranial tumor in children and is highly heterogeneous. The factors influencing the prognosis of NB are not simple.

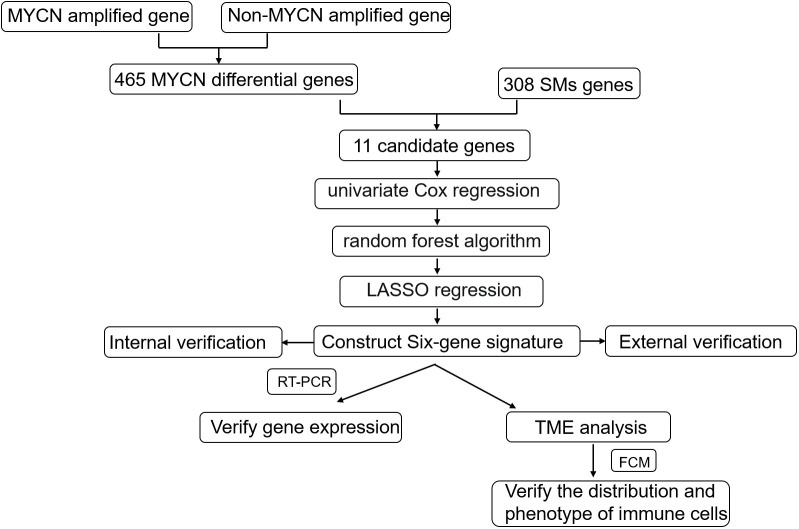
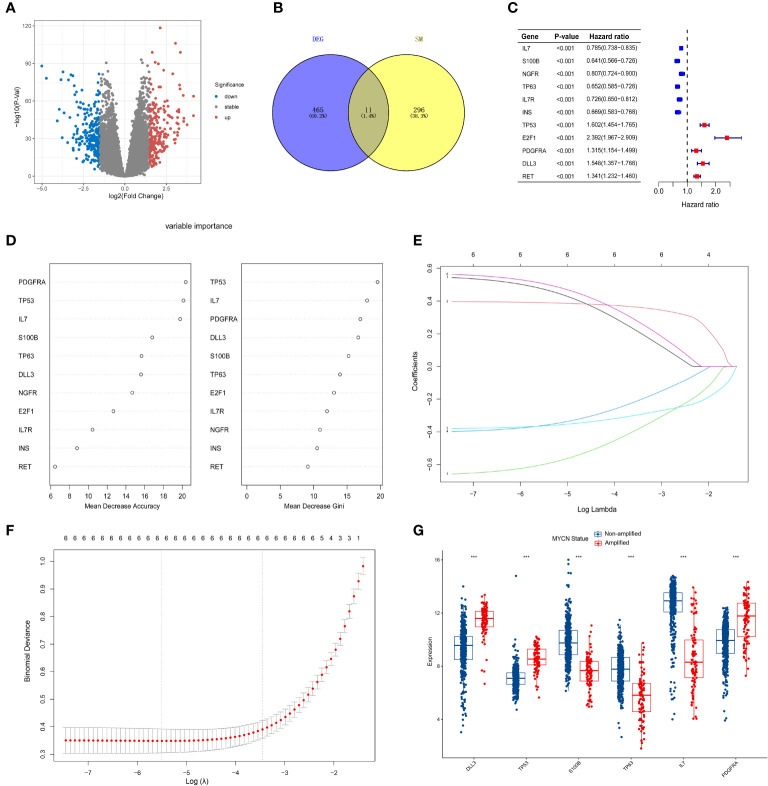
Methods: To investigate the effect of cell senescence on the prognosis of NB and tumor immune microenvironment, 498 samples of NB patients and 307 cellular senescence-related genes were used to construct a prediction signature.

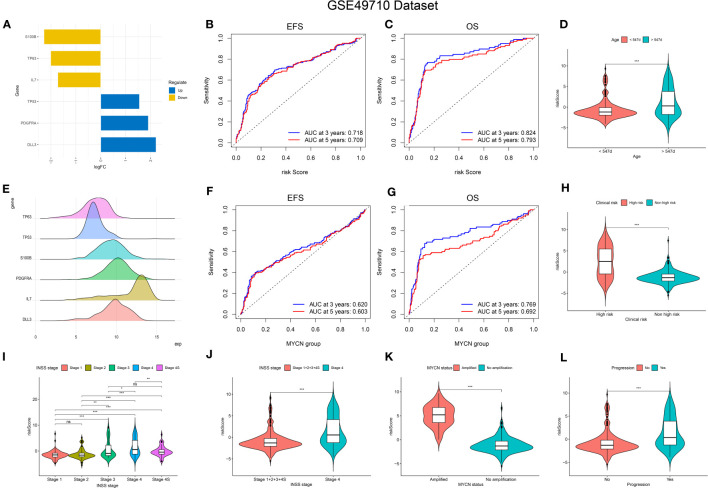
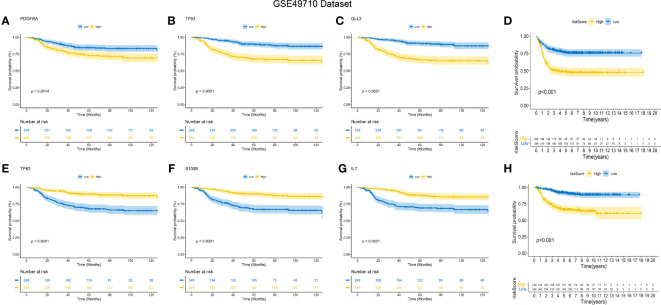
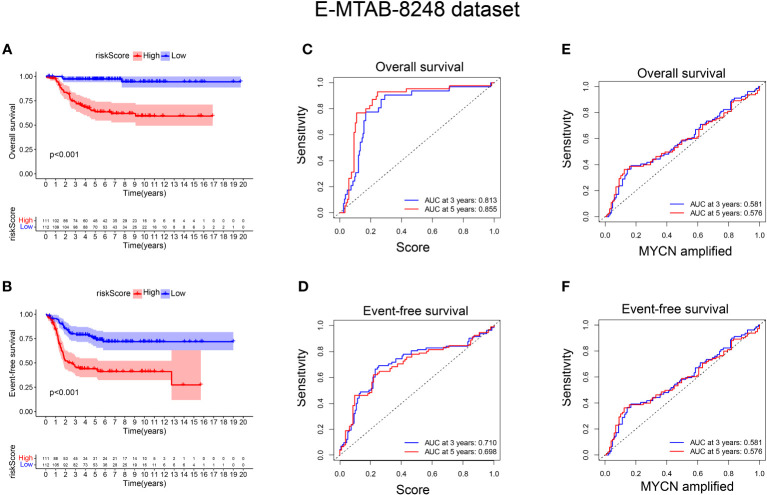
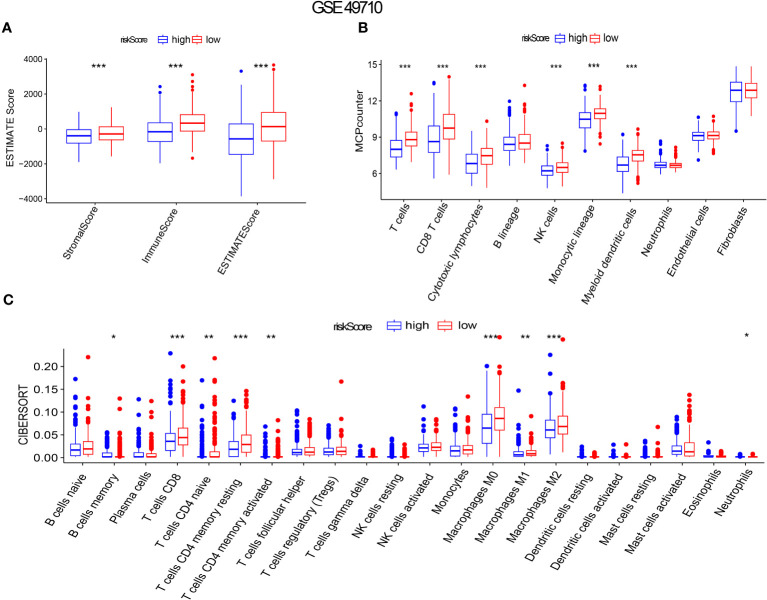
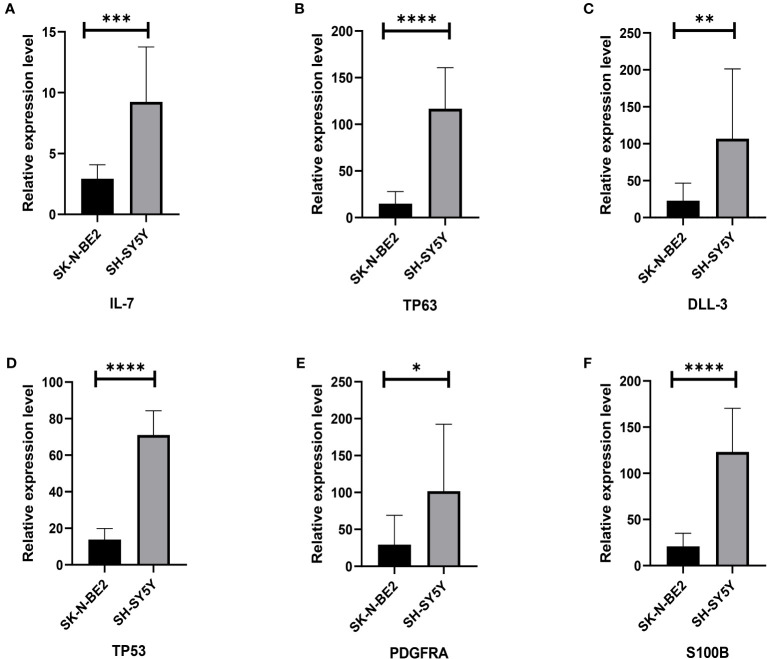
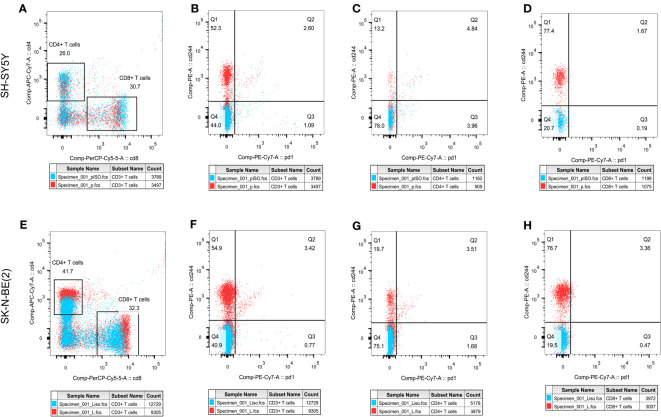
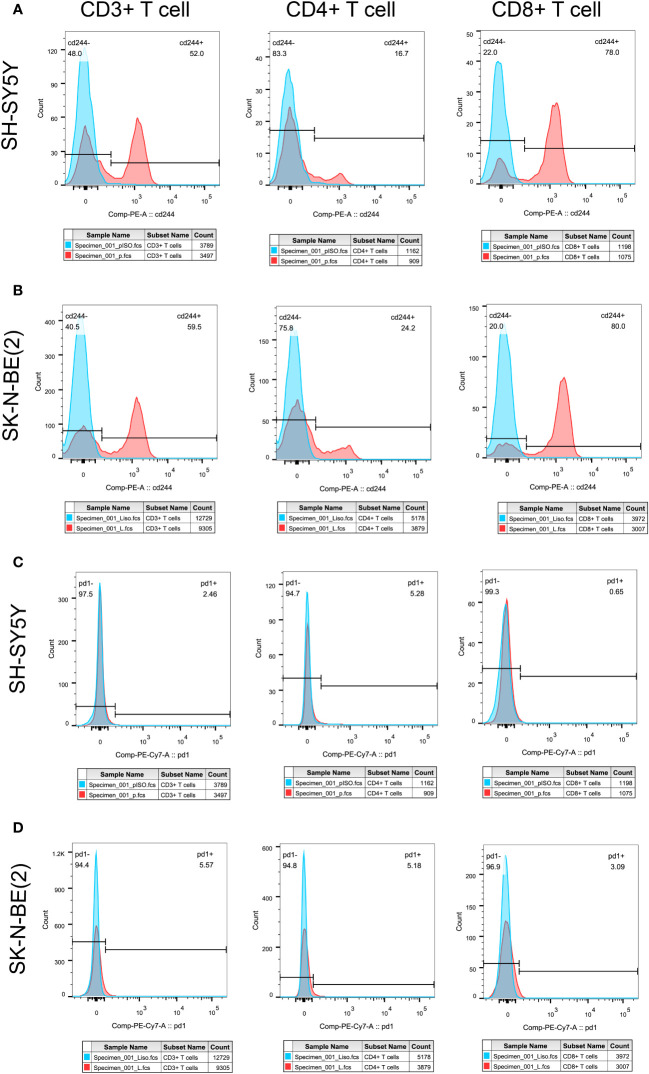
Results: A signature based on six optimal candidate genes (TP53, IL-7, PDGFRA, S100B, DLL3, and TP63) was successfully constructed and proved to have good prognostic ability. Through verification, the signature had more advantages than the gene expression level alone in evaluating prognosis was found. Further T cell phenotype analysis displayed that exhausted phenotype PD-1 and senescence-related phenotype CD244 were highly expressed in CD8+ T cell in MYCN-amplified group with higher risk-score.

Conclusion: A signature constructed the six MYCN-amplified differential genes and aging-related genes can be used to predict the prognosis of NB better than using each high-risk gene individually and to evaluate immunosuppressed and aging tumor microenvironment.

Keywords: COLD TUMOR; cellular senescence; neuroblastoma; prognosis; tumor microenvironment.


Conflict of interest statement

The authors declare that the research was conducted in the absence of any commercial or financial relationships that could be construed as a potential conflict of interest.

Figures

Figure 1
Figure 1
Schematic diagram of the study design. Gene expression and clinical information from 498 primary NBs were obtained from the GSE49710 dataset and internal verification through the same database;308 cellular senescence-related genes were obtained from the Cell-Age database; 223 sample data from the E-MTAB-8248 dataset were used for external validation. The internal verification included the relationship between 11 candidate genes and NB prognosis, the relationship between the constructed signature and NB prognosis, and the relationship between age, INSS stratification, clinical risk, and MYCN status; External validation focused on the relationship between signature and NB prognosis and the fit degree of prognosis prediction.
Figure 2
Figure 2
Screening of candidate genes and construction of signature (A) The volcano plot for differentially expressed genes (DEGs) (|log2FC| > 1.5 and adjusted p < 0.05), and the red, gray and blue circles indicate up- regulated, stable expressed and down-regulated of MYCN genes, respectively. (B) The blue regions represent 465 MYCN-amplified differential genes, while the yellow regions represent 308 SMs genes. (C) Forest diagram displaying the univariate Cox proportional hazard regression model for eleven genes and all candidate genes were associated with poor OS in GSE49710 datasets. (D) random forest algorithm results of 11 genes. (E, F) Results of LASSO regression analysis of the top six genes. (G) Differences between the MYCN amplified and non-amplified groups of six candidate genes and the risk-score signature constructed based on the candidate genes. ***p < 0.01.
Figure 3
Figure 3
Relationship of signature with age, MYCN-status, clinical prognosis, and INSS grading. (A, E), Expression trends and amounts of six genes included in the model; (B, C, F, G): the ROC curve of the signature and MYCN status regarding EFS and OS; (D, H, I-L), The relationship between risk-score and age, clinical prognosis stratification, INSS grading, MYCN status and disease aggressiveness were analyzed respectively. *p < 0.1; **p < 0.05; ***p < 0.01, respectively.
Figure 4
Figure 4
K-M Curve for Prognostic Prediction in NB. (A-C, E-G) Survival curves of the relationship between TP53, IL-7, PDGFRA, S100B, DLL3 and TP63 genes and the prognosis of NB patients, respectively. The blue curve indicates low gene expression, while the yellow curve indicates high gene expression. (D, H) are the survival curves of EFS and OS of NB patients in the dataset. Blue is the low-risk score, and red is the high-risk score.
Figure 5
Figure 5
External verification of the relationship between risk score and prognosis of NB patients. (A, B) The OS and EFS curves of 223 NB patients were respectively presented, with the blue curve representing patients with low-risk score and the red curve representing patients with high-risk score; (C, D) ROC curve shows the value of risk score in evaluating OS and EFS; (E, F) ROC curve shows the value of MYCN status in evaluating OS and EFS.
Figure 6
Figure 6
Aging gene score to evaluate immune infiltration in NB tumor microenvironment. (A-C) ESTIMATE Score, MICP-counter and CIBERSPORT were used to evaluate immune cell infiltration. The red box represents low-risk score group, while the blue box represents high-risk score group. *p < 0.1; **p < 0.05; ***p < 0.01, respectively.
Figure 7
Figure 7
Relative gene expression of 6 included genes A: The (A–F) shows qRT-PCR results of IL-7, TP63, DLL3, TP53, PDGFRA and S100B genes in two neuroblastoma cell lines, SH-SY5Y and SK-N-BE (2), respectively. The black column represents the relative expression of gene in SH-SY5Y, and the gray column represents the relative expression of gene in SK-N-BE (2). *p < 0.1; **p < 0.05; ***p < 0.01; ****p < 0.001, respectively.
Figure 8
Figure 8
T cell subpopulation distribution and phenotypic changesThe effect of different antigen stimulation on the distribution of T cell subsets and the co-expression of PD-1 and CD244 in different T cell subsets were shown. (A, E) show the proportion of CD4+T cell distribution and CD8+T cell distribution after stimulation by SH-SY5Y and SK-N-BE(2), respectively. (B–D) reflects the co-expression of CD244 and PD-1 in CD3+, CD4+ and CD8+T cell subsets after SH-SY5Y stimulation. (F–H) reflects the co-expression of CD244 and PD-1 in CD3+, CD4+ and CD8+T cell subsets after SK-N-BE(2) stimulation, respectively.
Figure 9
Figure 9
Tumor antigens on T cell exhausted molecules and aging phenotypesT cell exhaustion was shown by the expression ratio of PD-1 molecule, while CD244 was used as the phenotype of T cell senescence. Differential expression of PD-1 and CD244 in CD3+, CD4+ and CD8+T cells were shown. (A, C) showed the separate expression of CD244 and PD-1 in CD3+, CD4+, and CD8+T cell subsets after SH-SY5Y stimulation, respectively. (B, D) showed the separate expression of CD244 and PD-1 in CD3+, CD4+, and CD8+T cell subsets after SK-N-BE(2) stimulation, respectively. The blue crest comes from the Isotype control, the red crest comes from the fully dyed sample, and all the gates are set according to the Isotype control.

Similar articles

Cited by

References

    1. Anderson J, Majzner RG, Sondel PM. Immunotherapy of neuroblastoma: facts and hopes. Clin Cancer Res (2022) 28(15):3196–206. doi: 10.1158/1078-0432.CCR-21-1356 - DOI - PMC - PubMed
    1. Liu Z, Yu X, Xu L, Li Y, Zeng C. Current insight into the regulation of PD-L1 in cancer. Exp Hematol Oncol (2022) 11(1):44. doi: 10.1186/s40164-022-00297-8 - DOI - PMC - PubMed
    1. Alborzinia H, Florez AF, Kreth S, Bruckner LM, Yildiz U, Gartlgruber M, et al. . MYCN mediates cysteine addiction and sensitizes neuroblastoma to ferroptosis. Nat Cancer (2022) 3(4):471–85. doi: 10.1038/s43018-022-00355-4 - DOI - PMC - PubMed
    1. Zafar A, Wang W, Liu G, Wang X, Xian W, McKeon F, et al. . Molecular targeting therapies for neuroblastoma: Progress and challenges. Medicinal Res Rev (2021) 41(2):961–1021. doi: 10.1002/med.21750 - DOI - PMC - PubMed
    1. Croteau N, Nuchtern J, LaQuaglia MP. Management of neuroblastoma in pediatric patients. Surg Oncol Clinics North America (2021) 30(2):291–304. doi: 10.1016/j.soc.2020.11.010 - DOI - PubMed

Publication types

MeSH terms

Substances