Carbon Dioxide Monitoring Demonstrates Variations in the Quality of Ventilation on Public Transportation Buses and University Student Shuttle Vans and Identifies Effective Interventions
- PMID: 38035133
- PMCID: PMC10686372
- DOI: 10.20411/pai.v8i1.619
Carbon Dioxide Monitoring Demonstrates Variations in the Quality of Ventilation on Public Transportation Buses and University Student Shuttle Vans and Identifies Effective Interventions
Abstract
Background: There is a risk for transmission of severe acute respiratory syndrome 2 (SARS-CoV-2) and other respiratory viruses in motor vehicles, particularly if ventilation is inadequate.
Methods: We used carbon dioxide monitoring to examine the quality of ventilation in several public transportation buses and in university student shuttle vans in the Cleveland metro area during peak and non-peak travel times. Carbon dioxide levels above 800 parts per million (ppm) were considered an indicator of suboptimal ventilation for the number of people present. In the shuttle vans, we evaluated the impact of an intervention to improve ventilation.
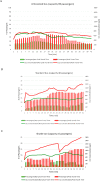
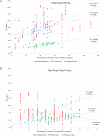
Results: In large articulated buses with 2 ventilation systems, carbon dioxide concentrations never exceeded 800 ppm, whereas in standard buses with 1 ventilation system concentrations rose above 800 ppm during peak travel times and on some trips during non-peak travel times. In shuttle vans, the ventilation system was not turned on during routine operation, and carbon dioxide levels rose above 800 ppm on all trips during peak and non-peak travel times. In the shuttle vans, an intervention involving operation of the existing ventilation system resulted in a significant reduction in carbon dioxide levels (mean concentration, 1,042 no intervention versus 785 with intervention; P < 0.001).
Conclusions: Our findings demonstrate substantial variability in the quality of ventilation in public transportation buses and university shuttle vans. There is a need for efforts to assess and optimize ventilation in motor vehicles used for public transportation to reduce the risk for aerosol-mediated transmission of respiratory viruses. Carbon dioxide monitoring may provide a useful tool to assess and improve ventilation.
Keywords: COVID-19; SARS-CoV-2; carbon dioxide; transportation; ventilation.
Copyright © 2023 Pathogens and Immunity.
Conflict of interest statement
C.J.D has received research grants from Clorox, Pfizer, and Ecolab. All other authors report no conflicts of interest relevant to this article.
Figures


References
-
- Cadnum JL, Donskey CJ.. If you can't measure it, you can't improve it: Practical tools to assess ventilation and airflow patterns to reduce the risk for transmission of severe acute respiratory syndrome coronavirus 2 and other airborne pathogens. Infect Control Hosp Epidemiol. 2022;43(7):915–7. doi: 10.1017/ice.2022.103. PubMed PMID: 35379373; PMCID: PMC9021581. - DOI - PMC - PubMed
-
- Wang CC, Prather KA, Sznitman J, Jimenez JL, Lakdawala SS, Tufekci Z, Marr LC.. Airborne transmission of respiratory viruses. Science. 2021;373(6558). doi: 10.1126/science.abd9149. PubMed PMID: 34446582; PMCID: PMC8721651. - DOI - PMC - PubMed
-
- Ventilation in buildings Centers for Disease Control and Prevention [updated May 12, 2023]. Available from: https://www.cdc.gov/coronavirus/2019-ncov/community/ventilation.html.
-
- Improving ventilation in buildings Centers for Disease Control and Prevention [updated May 11, 2023]. Available from: https://www.cdc.gov/coronavirus/2019-ncov/prevent-getting-sick/improving....
-
- Gettings J, Czarnik M, Morris E, Haller E, Thompson-Paul AM, Rasberry C, Lanzieri TM, Smith-Grant J, Aholou TM, Thomas E, Drenzek C, MacKellar D.. Mask Use and Ventilation Improvements to Reduce COVID-19 Incidence in Elementary Schools - Georgia, November 16-December 11, 2020. MMWR Morb Mortal Wkly Rep. 2021;70(21):779–84. doi: 10.15585/mmwr.mm7021e1. PubMed PMID: 34043610; PMCID: PMC8158891. - DOI - PMC - PubMed
LinkOut - more resources
Full Text Sources
Miscellaneous
