. 2023 Sep 25;4(11):100847.
doi: 10.1016/j.patter.2023.100847. eCollection 2023 Nov 10.

MANGEM: A web app for multimodal analysis of neuronal gene expression, electrophysiology, and morphology

Affiliations

MANGEM: A web app for multimodal analysis of neuronal gene expression, electrophysiology, and morphology

Robert Hermod Olson et al. Patterns (N Y). .

Abstract

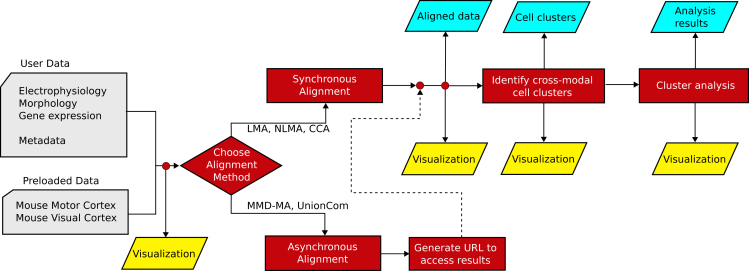
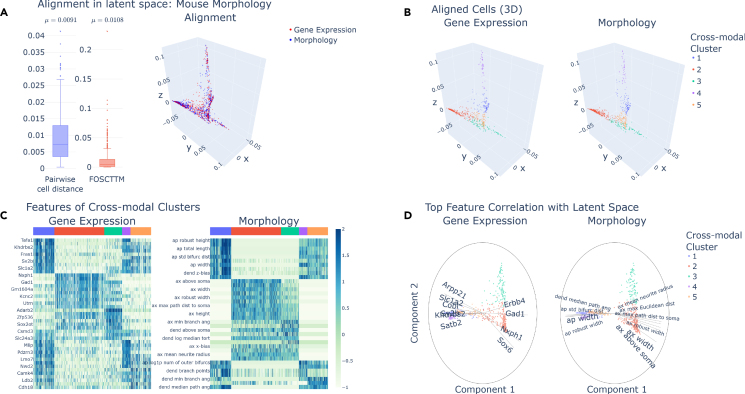
Single-cell techniques like Patch-seq have enabled the acquisition of multimodal data from individual neuronal cells, offering systematic insights into neuronal functions. However, these data can be heterogeneous and noisy. To address this, machine learning methods have been used to align cells from different modalities onto a low-dimensional latent space, revealing multimodal cell clusters. The use of those methods can be challenging without computational expertise or suitable computing infrastructure for computationally expensive methods. To address this, we developed a cloud-based web application, MANGEM (multimodal analysis of neuronal gene expression, electrophysiology, and morphology). MANGEM provides a step-by-step accessible and user-friendly interface to machine learning alignment methods of neuronal multimodal data. It can run asynchronously for large-scale data alignment, provide users with various downstream analyses of aligned cells, and visualize the analytic results. We demonstrated the usage of MANGEM by aligning multimodal data of neuronal cells in the mouse visual cortex.

Keywords: asynchronous computation; cloud-based machine learning; cross-modal cell clusters and phenotypes; gene expression; manifold learning; multimodal data alignment; neuronal electrophysiology and morphology; patch-seq analysis; single-cell multimodalities; web application.


Conflict of interest statement

The authors declare no competing interests.

Figures

None
Graphical abstract
Figure 1
Figure 1
Overview of MANGEM (multimodal analysis of neuronal gene expression, electrophysiology, and morphology) User input to MANGEM includes multimodal single-cell data together with cell metadata. Within MANGEM, the multimodal data are aligned using machine learning methods, projecting disparate modalities into a low-dimensional common latent space. Clustering algorithms are applied within the latent space to identify cell clusters, and then analysis methods are provided in MANGEM to characterize the clusters by differential feature expression and correlation of features with the latent space. In addition to interactive plots generated at each step of the workflow, downloadable output includes tabular data files (cell coordinates in latent space, cluster annotations, top features for each cluster) and images depicting alignment, cross-modal cell clusters, and cluster analyses.
Figure 2
Figure 2
Cloud implementation of MANGEM using AWS infrastructure The application runs on Amazon Cloud Services using Elastic Beanstalk to provision an EC2 instance. The web server nginx serves as a reverse proxy to the Gunicorn wsgi server. MANGEM is written in Python using the Plotly Dash framework. Long-running tasks are run in the background by Celery workers, with Redis acting as the message broker between MANGEM and Celery. Uploaded and processed data files are stored in a file system cache in AWS S3.
Figure 3
Figure 3
Data flow through MANGEM web application Input data passes into an alignment process, which will either run in the main process or in the background, depending on the method. In the case of background (asynchronous) alignment, a URL will be supplied to the user, which will allow them to check on the job’s status and access the results upon completion. Aligned data feed into a clustering algorithm, and then data analysis methods can be applied to the cell clusters. Data visualization output can be produced at each stage of the process, and tabular data files of aligned data, cell clusters, and analysis results can be downloaded.
Figure 4
Figure 4
MANGEM analysis and visualization of neuronal gene expression and electrophysiological features in mouse visual cortex (A) Measures of alignment error and 3D plot of superimposed aligned data in latent space are shown for the preloaded mouse visual cortex dataset after nonlinear manifold alignment. Central boxes range from the first to third quartiles, containing a tick mark for the median. The whiskers range to the farthest datapoint that falls within 1.5 times the interquartile range. (B) Cross-modal clusters, obtained by Gaussian mixture model, are indicated by color in plots of aligned data for each modality. (C) Feature levels across all cells for the top 5 features for each cross-modal cluster. Normalized feature magnitude was ranked using the Wilcox rank-sum test. Cross-modal clusters are identified by the colored bar at the top of each plot. (D) Biplots for Gene Expression and Electrophysiological features using dimensions 1 and 2 of the latent space. The top 15 features by correlation with the latent space are shown plotted as radial lines where the length is the value of correlation (max value 1).
Figure 5
Figure 5
MANGEM analysis and visualization of neuronal gene expression and morphological features in mouse visual cortex (A) Measures of alignment error and 3D plot of superimposed aligned data in latent space are shown for the mouse morphology cortex dataset after nonlinear manifold alignment. Central boxes range from the first to third quartiles, containing a tick mark for the median. The whiskers range to the farthest datapoint that falls within 1.5 times the interquartile range. (B) Cross-modal clusters, obtained by Gaussian mixture model, are indicated by color in plots of aligned data for each modality. (C) Feature expression levels across all cells for the top 10 differentially expressed features for each cross-modal cluster. Normalized feature expression was ranked using the Wilcox rank-sum test. Cross-modal clusters are identified by the colored bar at the top of each plot. (D) Biplots for Gene Expression and Electrophysiological features using dimensions 1 and 2 of the latent space. The top 15 features by correlation with the latent space are shown plotted as radial lines where the length is the value of correlation (max value 1).

Update of

References

    1. Lipovsek M., Bardy C., Cadwell C.R., Hadley K., Kobak D., Tripathy S.J. Patch-seq: Past, Present, and Future. J. Neurosci. 2021;41:937–946. doi: 10.1523/JNEUROSCI.1653-20.2020. - DOI - PMC - PubMed
    1. Marx V. Patch-seq takes neuroscience to a multimodal place. Nat. Methods. 2022;19:1340–1344. doi: 10.1038/s41592-022-01662-5. - DOI - PubMed
    1. Rübel O., Tritt A., Ly R., Dichter B.K., Ghosh S., Niu L., Baker P., Soltesz I., Ng L., Svoboda K., et al. The Neurodata Without Borders ecosystem for neurophysiological data science. Elife. 2022;11 doi: 10.7554/eLife.78362. - DOI - PMC - PubMed
    1. Efremova M., Teichmann S.A. Computational methods for single-cell omics across modalities. Nat. Methods. 2020;17:14–17. doi: 10.1038/s41592-019-0692-4. - DOI - PubMed
    1. Huang J., Sheng J., Wang D. Manifold learning analysis suggests strategies to align single-cell multimodal data of neuronal electrophysiology and transcriptomics. Commun. Biol. 2021;4:1308. doi: 10.1038/s42003-021-02807-6. - DOI - PMC - PubMed

LinkOut - more resources