. 2024 Jan;11(3):e2303614.
doi: 10.1002/advs.202303614. Epub 2023 Nov 30.

Extracellular Vesicles in Infrapatellar Fat Pad from Osteoarthritis Patients Impair Cartilage Metabolism and Induce Senescence

Affiliations

Extracellular Vesicles in Infrapatellar Fat Pad from Osteoarthritis Patients Impair Cartilage Metabolism and Induce Senescence

Yumei Cao et al. Adv Sci (Weinh). 2024 Jan.

Abstract

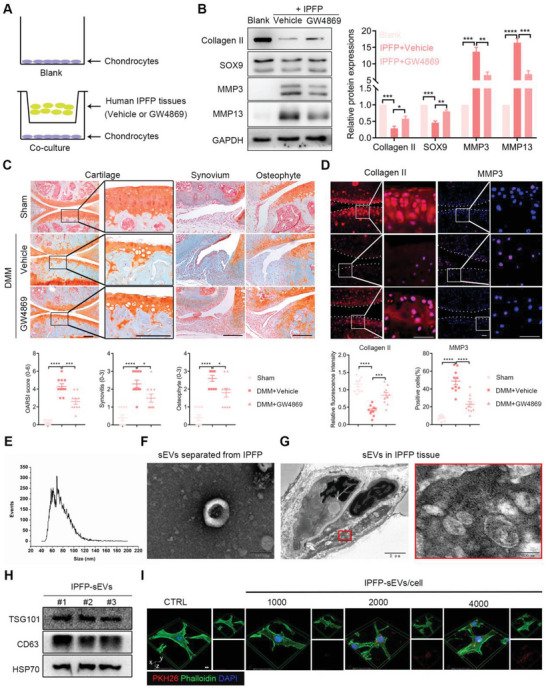
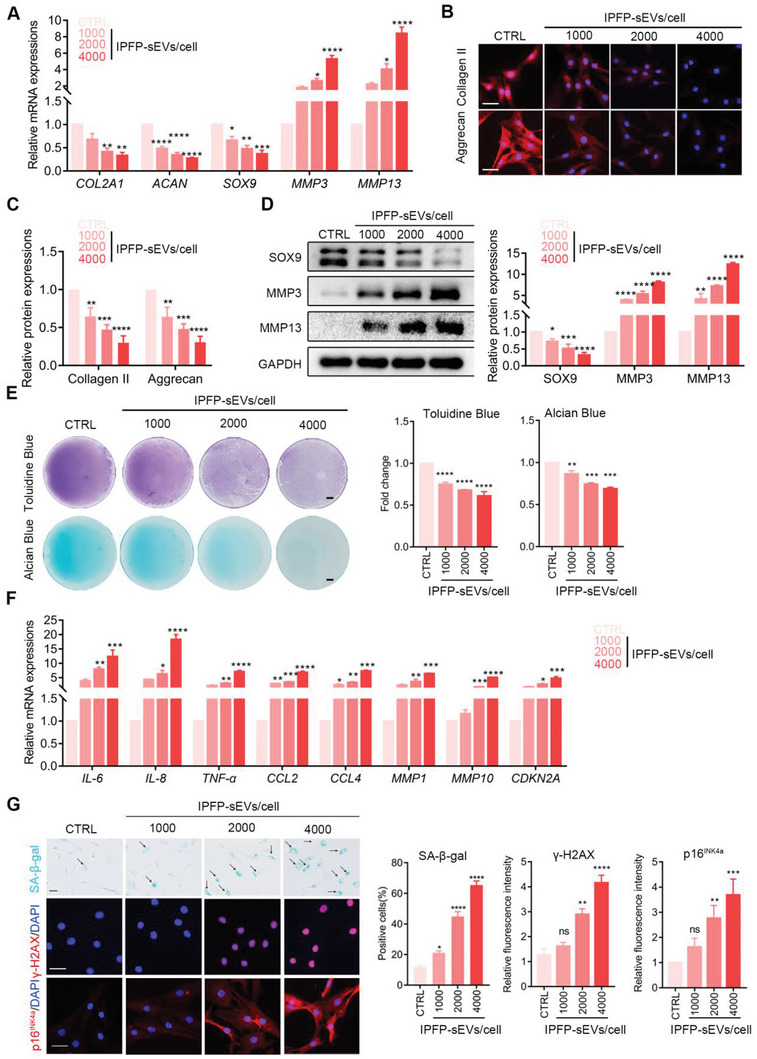
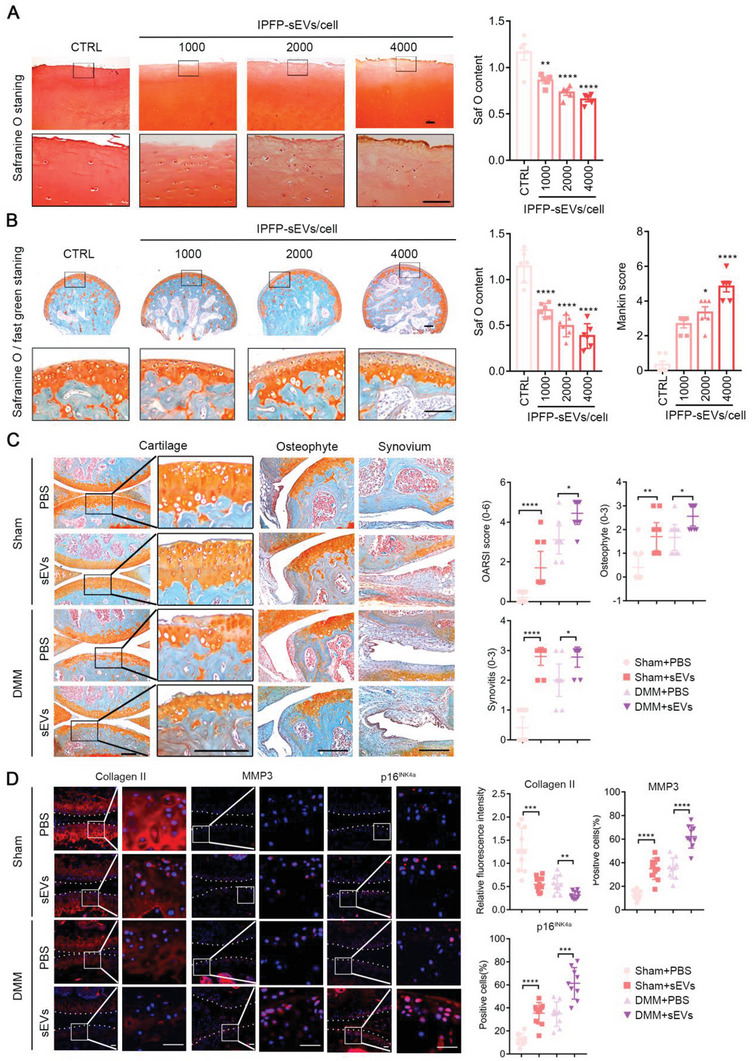
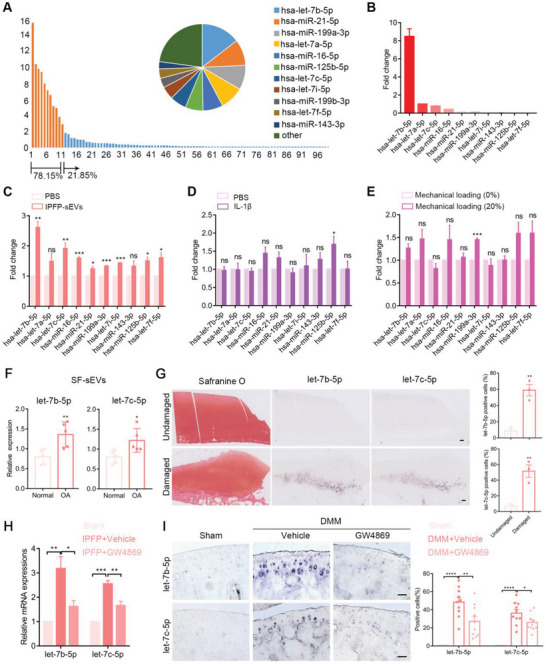
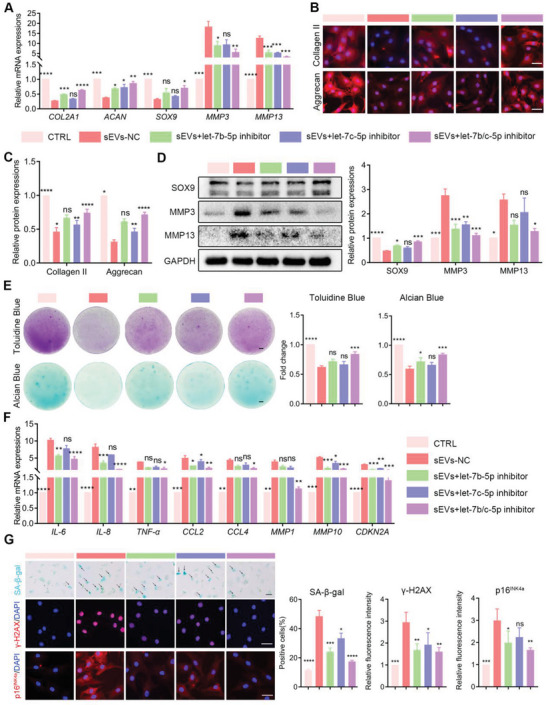
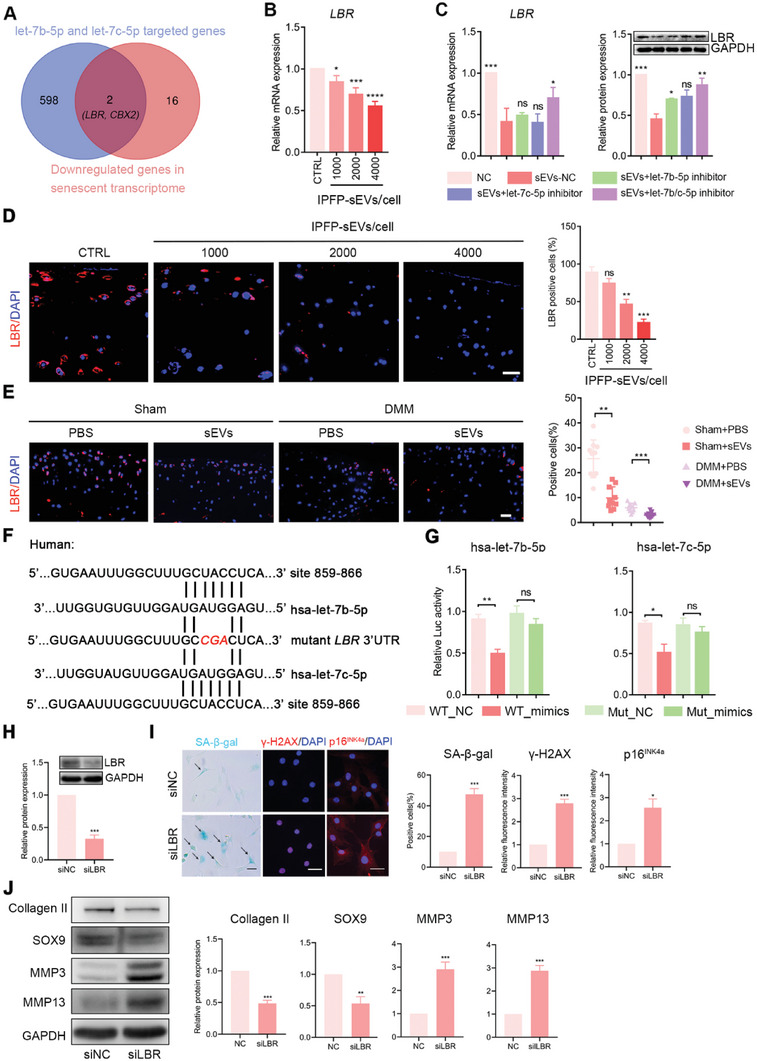
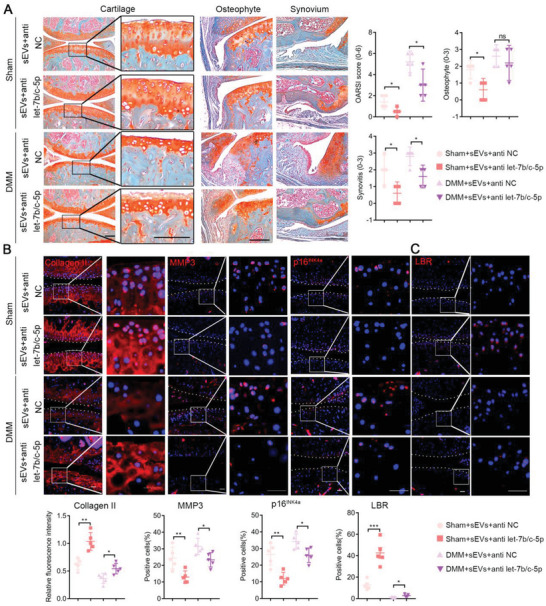
Infrapatellar fat pad (IPFP) is closely associated with the development and progression of knee osteoarthritis (OA), but the underlying mechanism remains unclear. Here, it is find that IPFP from OA patients can secret small extracellular vesicles (sEVs) and deliver them into articular chondrocytes. Inhibition the release of endogenous osteoarthritic IPFP-sEVs by GW4869 significantly alleviated IPFP-sEVs-induced cartilage destruction. Functional assays in vitro demonstrated that IPFP-sEVs significantly promoted chondrocyte extracellular matrix (ECM) catabolism and induced cellular senescence. It is further demonstrated that IPFP-sEVs induced ECM degradation in human and mice cartilage explants and aggravated the progression of experimental OA in mice. Mechanistically, highly enriched let-7b-5p and let-7c-5p in IPFP-sEVs are essential to mediate detrimental effects by directly decreasing senescence negative regulator, lamin B receptor (LBR). Notably, intra-articular injection of antagomirs inhibiting let-7b-5p and let-7c-5p in mice increased LBR expression, suppressed chondrocyte senescence and ameliorated the progression of experimental OA model. This study uncovers the function and mechanism of the IPFP-sEVs in the progression of OA. Targeting IPFP-sEVs cargoes of let-7b-5p and let-7c-5p can provide a potential strategy for OA therapy.

Keywords: extracellular vesicles; infrapatellar fat pad; lamin B receptor; osteoarthritis; senescence.


Conflict of interest statement

The authors declare no conflict of interest.

Figures

Figure 1
Figure 1
Effects of sEVs inhibitor GW4869 on the roles of IPFP‐sEVs in regulating cartilage metabolism. A) Experimental scheme. B) Transwell assay followed by western blot analysis detecting the expression level of Collagen II, SOX9, MMP3, MMP13 in the co‐cultured chondrocytes. The data was normalized to GAPDH. C) Safranin o/fast green staining of knee joint specimens of mice treated with GW4869 or vehicle (up). Statistical analysis of OARSI, synovitis and osteophyte scores (down). Scale bars, 100 µm. D) Immunofluorescence analysis of Collagen II and MMP3 in sections of knee joints (up, n = 10 for each group). Statistical analysis of immunofluorescence assay (down). Scale bars, 100 µm. E) Size distribution of isolated IPFP‐sEVs. F) Transmission electron microscopy of sEVs isolated from IPFP explant‐conditional medium. Scale bar, 100 nm. G) IPFP tissue consisted of cells and sEVs. Higher magnification pictures showed numerous different types of sEVs in the tissue interstitial space. Scale bars, 2 µm (left), 200 nm (right). H) Indicated proteins CD63, TSG10 and HSP70 were assessed by western blotting from sEVs. I) 3D rendering and Z stack images showing the colocalization of PKH26‐labelled sEVs (red) and phalloidin for F‐actin (green). Scale bar, 5 µm. OARSI, Osteoarthritis Research Society International. ns: no significant difference, *p<0.05, **p<0.01, ***p<0.001, ****p<0.0001. For B) and D), all data are shown as means ± SEM, p value were calculated by one‐way analysis of variance (ANOVA). For C), all data are shown as means ± 95% CI, Mann‐Whitney U test was used for OARSI, synovitis and osteophyte scores.
Figure 2
Figure 2
IPFP‐sEVs promote ECM degradation and cellular senescence in HCs. A) qRT‐PCR analysis of COL2A1, ACAN, SOX9, MMP3 and MMP13 expression in HCs stimulated with IPFP‐sEVs at 0 (control), 1000, 2000, or 4000 IPFP‐sEVs cell−1 for 24 h. B) Representative immunofluorescence images of of Collagen II and Aggrecan protein levels in chondrocytes after IPFP‐sEVs stimulation. Scale bars, 25 µm. C) Quantification data of Fig 2B. D) Western blotting analysis of SOX9, MMP3 and MMP13 expression in chondrocytes after stimulating with IPFP‐sEVs. E) Alcian Blue and Toluidine Blue staining after a 14‐day treatment with IPFP‐sEVs or PBS. Scale bars, 5 µm. F) qRT‐PCR analysis of IL‐6, IL‐8, TNF‐α, CCL2, CCL4, MMP1, MMP10 and CDKN2A expression in HCs stimulated with IPFP‐sEVs at 0 (control), 1000, 2000, or 4000 IPFP‐sEVs cell−1. G) SA‐β‐gal staining (left) representing the effects of IPFP‐sEVs on senescence and SA‐β‐gal positive cell counting (right) of HCs. Scale bar, 100 µm. Representative immunofluorescence images and quantification fluorescence intensity analyses of γ‐H2AX and p16INK4a protein levels in chondrocytes after IPFP‐sEVs stimulation. Scale bars, 25 µm. ns: no significant difference, *p<0.05, **p<0.01, ***p<0.001, ****p<0.0001. All data are shown as means ± SEM of three independent experiments in A), C), D), E), F) and G). One‐way ANOVA were used for comparison between multiple groups.
Figure 3
Figure 3
IPFP‐sEVs accelerate OA development and progression ex vivo and in vivo. A) Representative safranin O‐stained images of human cartilage explants treated with or without IPFP‐sEVs. Scale bars, 25 µm. Safranin O‐positive area among the above groups was quantified (n = 5). B) Mice femoral head treated with or without IPFP‐sEVs. The cartilage was stained with safranin‐o/fast green. Scale bars, 25 µm. The OA severity was accessed by relative safranin‐o staining content and Mankin score (n = 8). C) Mice in sham and DMM‐induced OA group were injected with IPFP‐sEVs or PBS, separately. The cartilage, osteophyte and synovium were stained with safranin‐o/fast green. Scale bars, 100 µm. (n = 10 mice in sham group, n = 9 in OA group). OARSI score for articular cartilage. Synovium score for synovitis. Osteophyte score for osteophyte formation. D) Representative immunofluorescence analysis of Collagen II, MMP3 and p16INK4a in sections of both femoral head and tibial plateau of knee joints (n = 10 for sham group, n = 9 for OA group). Scale bar: 100 µm. ns: no significant difference, *p<0.05, **p<0.01, ***p<0.001, ****p<0.0001. For analysis of Saf O content in A) and B), all data are shown as means ± SEM, one‐way ANOVA were used for comparison between multiple groups. For B) of Mankin score and C), all data are shown as means ± 95% CI, Mann‐Whitney U test was applied for Mankin, OARSI, synovitis and osteophyte scores. For D), Student's t test was used for comparison between two groups.
Figure 4
Figure 4
Highly expressed let‐7b‐5p and let‐7c‐5p in IPFP‐sEVs could be transferred from synovial fluid to cartilage tissues. A) Relative proportion of miRNAs in total miRNA reads. Top 10 sEVs‐derived miRNAs expression assessed by miRNA microarray analysis. B) High expression of top 10 miRNAs in IPFP‐sEVs were confirmed by qRT‐PCR. C) qRT‐PCR analysis of top 10 miRNAs expression in HCs stimulated with IPFP‐sEVs for 24 h. D) qRT‐PCR analysis of top 10 miRNAs expression in HCs stimulated with IL‐1β for 24 h. E) qRT‐PCR analysis of top 10 miRNAs expression in HCs after excessive mechanical loading (20%) for 24 h. F) qRT‐PCR analysis of the expression of let‐7b‐5p and let‐7c‐5p in synovial fluid (SF)‐derived sEVs (SF‐sEVs). G) Safranin O staining (left) and ISH (right) of the cartilage from OA patients. Scale bars, 5 µm. H) qRT‐PCR analysis of the expression of let‐7b‐5p and let‐7c‐5p in the co‐cultured chondrocytes. I) ISH of cartilage from sham and DMM mice treated with or without GW4869. Scale bars, 100 µm. ns: no significant difference, *p<0.05, **p<0.01, ***p<0.001, ****p<0.0001. All data are shown as means ± SEM in C), D), E), F), G), H) and I). Student's t test was used for comparison between two groups for C), D), E), F) and G). One‐way ANOVA were used for comparison between multiple groups for H) and I).
Figure 5
Figure 5
Inhibition of let‐7b‐5p and let‐7c‐5p suppresses biological functions of IPFP‐sEVs in chondrocytes. A) qRT‐PCR analysis of COL2A1, ACAN, SOX9, MMP3 and MMP13 expression in HCs after IPFP‐sEVs stimulation or a combination of IPFP‐sEVs and let‐7b‐5p or let‐7c‐5p inhibition. B) Representative immunofluorescence images of Collagen II and Aggrecan after IPFP‐sEVs treatment or/with let‐7b‐5p and let‐7c‐5p inhibition. C) Quantification data of Figure 5B. D) Western blotting analysis of SOX9, MMP3 and MMP13 protein levels in chondrocytes after IPFP stimulation or a combination of IPFP‐sEVs and let‐7b‐5p or let‐7c‐5p inhibition. The data were normalized to GAPDH. E) Alcian Blue and Toluidine Blue staining were performed to examine the proteoglycan loss of HCs treated with the IPFP‐sEVs with or without let‐7b‐5p and let‐7c‐5p inhibitor (left) and its quantification data (right). Scale bar: 5 µm. F) qRT‐PCR analysis of IL‐6, IL‐8, TNF‐α, CCL2, CCL4, MMP1, MMP10 and CDKN2A expression in HCs as treated above. G) Identification of senescent cells by SA‐β‐gal staining as treated above (left) and its quantification data (right). scale bar: 100 µm. Immunofluorescence staining of p16INK4a and γ‐H2AX in chondrocytes as treated above (left) and its quantification data (right). Scale bars: 25 µm. ns: no significant difference, *p<0.05, **p<0.01, ***p<0.001, ****p<0.0001. All data are shown as means ± SEM of three independent experiments in A), C), D), E), F) and G). One‐way ANOVA were used for comparison in multiple groups.
Figure 6
Figure 6
Let‐7b‐5p and let‐7c‐5p directly target LBR. A) Venn diagram display the overlapping of the human target genes of let‐7b‐5p and let‐7c‐5p, as predicted by Targetscan, miRDB, miRPathDB, starbase and senescent core genes. B) qRT‐PCR analysis of LBR in HCs stimulated with IPFP‐sEVs for 0 (control), 1000, 2000, or 4000 IPFP‐sEVs cell−1 for 24 h. C) mRNA expression of LBR was measured by qRT‐PCR in chondrocytes after IPFP stimulation or a combination of IPFP‐sEVs and let‐7b/c‐5p inhibition (left). Western blotting analysis of LBR protein level in chondrocytes as treated above (right). The data was normalized to GAPDH. D) Representative images of LBR assayed by immunofluorescence confocal microscopy in IPFP‐sEVs‐stimulated human cartilage explants. Scale bar, 25 µm. E) Representative immunofluorescence staining of LBR in mice model. Scale bar, 25 µm. F) Sequence alignment of a putative let‐7b‐5p and let‐7c‐5p binding site within the 3′‐UTR of LBR mRNA shows a high level of sequence conservation and complementarity with let‐7b‐5p and let‐7c‐5p. G) Luciferase assays show decreased reporter activity after co‐transfection of the wild‐type LBR 3′UTR plasmid with let‐7b‐5p and let‐7c‐5p into 293T cells. H) The knockout efficiency was detected by western blotting analysis. I) Identification of senescent cells by SA‐β‐gal staining as treated above (left) and its quantification data (right). Scale bar: 100 µm. Representative immunofluorescence images and quantification fluorescence intensity analysis of γ‐H2AX and p16INK4a protein levels in chondrocytes after transfection of siLBR. Scale bars, 25 µm. J) Western blotting analysis of Collagen II, SOX9, MMP3 and MMP13 expression in chondrocytes after transfection of siLBR. ns: no significant difference, *p<0.05, **p<0.01, ***p<0.001, ****p<0.0001. All data are shown as means ± SEM of three independent experiments in B), C), D), G), H), I) and J). One‐way ANOVA was used for comparison in multiple groups for B), C) and D). Student's t test was used in E), G), H), I) and J).
Figure 7
Figure 7
Intra‐articular injection of antagomir‐let‐7b‐5p and let‐7c‐5p demolishes the deteriorative effect of IPFP‐sEVs on knee joint in vivo. A) Safranin o/fast green staining of knee joint specimens of mice treated with antagomir‐NC or antagomir‐let‐7b‐5p and let‐7c‐5p (left). Statistical analysis of OARSI, synovitis and osteophyte scores (right). Scale bar: 100 µm. B,C) Representative immunofluorescence analysis of Collagen II, MMP3, p16INK4a B) and LBR C) in sections of both femoral head and tibial plateau of knee joints (n = 5 for each group). Scale bar: 25 µm. ns: no significant difference, *p<0.05, **p<0.01, ***p<0.001, ****p<0.0001. For A), all data are shown as means ± 95% CI, Mann‐Whitney U test for OARSI, synovitis and osteophyte scores. For B) and C), all data are shown as means ± SEM, Student's t test was used for comparison.

References

    1. Hunter D. J., Bierma‐Zeinstra S., Lancet 2019, 393, 1745. - PubMed
    1. Ratneswaran A., Kapoor M., Osteoarthritis cartilage 2021, 29, 151. - PubMed
    1. Quicke J. G., Conaghan P. G., Corp N., Peat G., Osteoarthritis cartilage 2022, 30, 196. - PubMed
    1. Rice S. J., Beier F., Young D. A., Loughlin J., Nat Rev. Rheumatol 2020, 16, 268. - PubMed
    1. Zeng N., Yan Z.‐P., Chen X.‐Y., Ni G.‐X., Aging Dis 2020, 11, 1317. - PMC - PubMed

Publication types

LinkOut - more resources