. 2023 Nov 30;14(1):7881.
doi: 10.1038/s41467-023-43607-2.

Volcaniclastic density currents explain widespread and diverse seafloor impacts of the 2022 Hunga Volcano eruption

Affiliations

Volcaniclastic density currents explain widespread and diverse seafloor impacts of the 2022 Hunga Volcano eruption

Sarah Seabrook et al. Nat Commun. .

Abstract

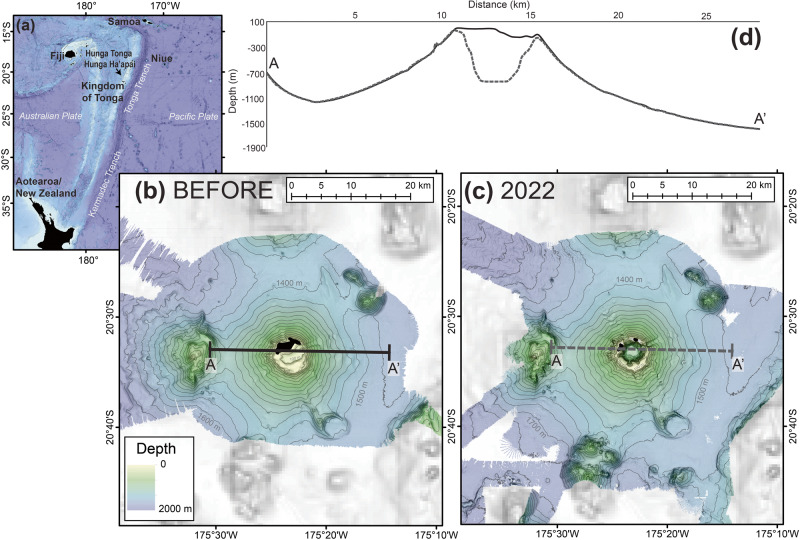
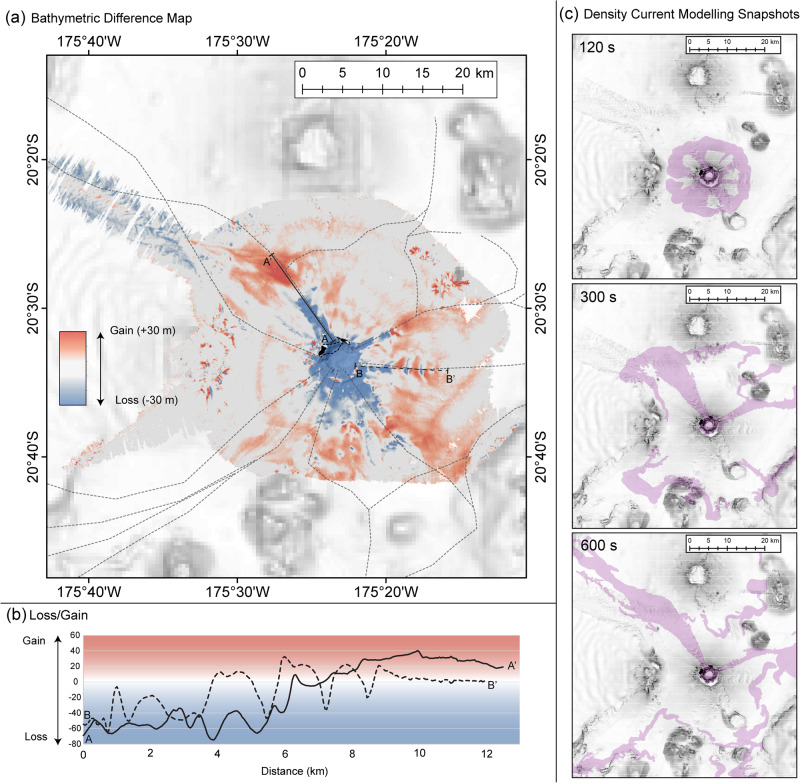
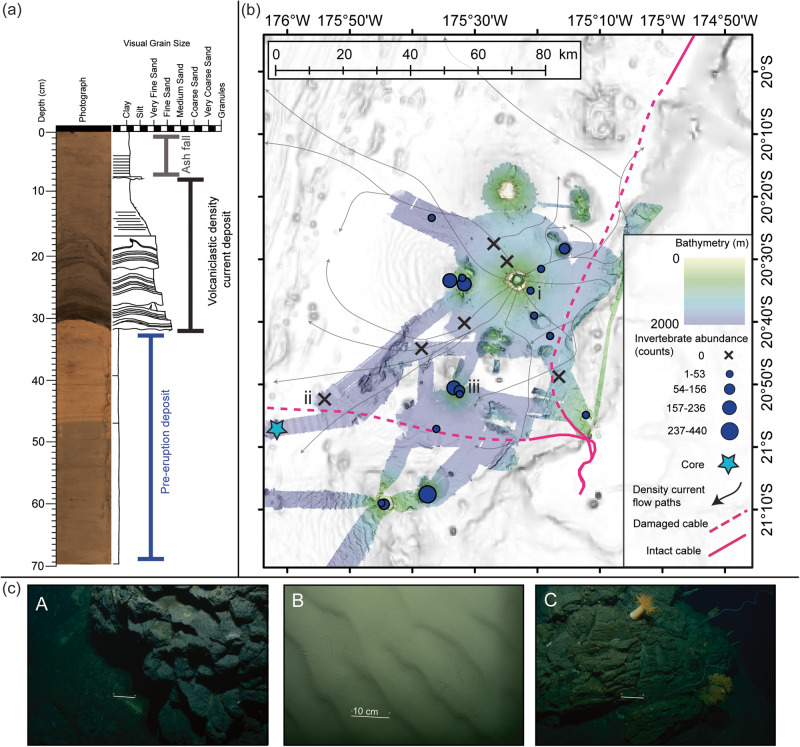
The impacts of large terrestrial volcanic eruptions are apparent from satellite monitoring and direct observations. However, more than three quarters of all volcanic outputs worldwide lie submerged beneath the ocean, and the risks they pose to people, infrastructure, and benthic ecosystems remain poorly understood due to inaccessibility and a lack of detailed observations before and after eruptions. Here, comparing data acquired between 2015 - 2017 and 3 months after the January 2022 eruption of Hunga Volcano, we document the far-reaching and diverse impacts of one of the most explosive volcanic eruptions ever recorded. Almost 10 km3 of seafloor material was removed during the eruption, most of which we conclude was redeposited within 20 km of the caldera by long run-out seafloor density currents. These powerful currents damaged seafloor cables over a length of >100 km, reshaped the seafloor, and caused mass-mortality of seafloor life. Biological (mega-epifaunal invertebrate) seafloor communities only survived the eruption where local topography provided a physical barrier to density currents (e.g., on nearby seamounts). While the longer-term consequences of such a large eruption for human, ecological and climatic systems are emerging, we expect that these previously-undocumented refugia will play a key role in longer-term ecosystem recovery.


Conflict of interest statement

The authors declare no competing interests.

Figures

Fig. 1
Fig. 1. Pre- and post-eruption bathymetry.
a Regional bathymetric map showing the location of the islands of Hunga Tonga and Hunga Ha’apai along the Tonga-Tofu-Kermadec Arc. Onshore regions are shown by black polygons. b, c Bathymetric maps of Hunga Volcano acquired before (b) and after (c) the 2022 eruption. For details pertaining to bathymetry surveys refer to methods. d Solid line (A-A’) and dashed line (A-A’) on insets b & c indicate the location of solid and dash lined profiles shown in (d) that show the Hunga Volcano edifice remained intact after the eruption despite the ~800 m difference in the depth of the caldera and drastic changes in island topography (islands shown in black from). The before eruption bathymetry was created from multibeam surveys in 2015, 2016 and 2017 satellite-derived bathymetry from Land Information New Zealand. This is overlain on GEBCO_2022 bathymetric grid (greyscale; 10.5285/e0f0bb80-ab44-2739-e053-6c86abc0289c).
Fig. 2
Fig. 2. Seafloor difference map and density current modelling snapshots.
a Difference map showing the relative gain (red) and loss (blue) of seafloor when comparing pre-eruption bathymetry with post-eruption bathymetry. Coastlines pre (dashed) and post (solid) eruption are shown. Indicative density current flow paths (i.e., an accessible visualisation of the general flow pathways simplified from the model output animation provided (see Supplemental Movie 1 and Fig. S6)) are indicated with dashed grey lines plotted over the difference map to enable comparison of density current flow paths with the difference map results. b Solid (A-A’) and dashed (B-B’) black lines showing gain/loss along prominent volcaniclastic density current flow pathways, with the location of these profiles shown in (a) with corresponding solid and dashed lines. c For further context, select snapshots from the model animation (provided in Supplemental Movie 1) are provided at 120, 300, and 600 s into the modelling output. For these density current modelling snapshots, the map frame extent is the same as for the difference map, and the background imagery is 2022 multidirectional hill shade.
Fig. 3
Fig. 3. Relation of density current flow paths to impact on the seafloor including the telecommunications cables, sediment system and invertebrate communities.
a Sediment core log with interpreted pre-eruption, volcaniclastic and ash deposits labelled, from the sediment core indicated with the light blue star in (b). b Compilation map showing seafloor multibeam survey and geologic and biological sampling after the 2022 Hunga Volcano eruption. Indicative density current flow paths taken from modelling results (as in Fig. 2, see Supplemental Movie 1 and Fig. S6) are shown in solid black lines with the arrows indicating directionality of the flow paths interpreted from the modelling simulation. The locations of damaged submarine cable are depicted with dashed pink lines. In order to reach the international cable, the density current must overtop two knolls directly E and ESE of location C, which partially constrains the minimum volume of material in the volcaniclastic density current. The extent of the post-eruption bathymetry survey is shown in colour and was collected by RV Tangaroa and USV Maxlimer. Dark blue graduated points and black crosses show locations where seafloor video footage documented invertebrate abundance (in count) during RV Tangaroa survey in April 2022. c Example images of the seabed across the study area are shown in insets A-C, and each image is located in (b). The white scale bar in each A-C inset is 10 cm, as indicated in the middle inset (B).

References

    1. Latter JH. Tsunamis of volcanic origin: summary of causes, with particular reference to Krakatoa, 1883. Bull. Volcano. 1981;44:467–490. doi: 10.1007/BF02600578. - DOI
    1. Self S. The effects and consequences of very large explosive volcanic eruptions. Philos. Trans. R. Soc. A Math. Phys. Eng. Sci. 2006;364:2073–2097. doi: 10.1098/rsta.2006.1814. - DOI - PubMed
    1. Bryan SE, et al. The largest volcanic eruptions on Earth. Earth Sci. Rev. 2010;102:207–229. doi: 10.1016/j.earscirev.2010.07.001. - DOI
    1. Watson AJ. Volcanic iron, CO2, ocean productivity and climate. Nature. 1997;385:587–588. doi: 10.1038/385587b0. - DOI - PubMed
    1. Fraile-Nuez E, et al. The submarine volcano eruption at the island of El Hierro: physical-chemical perturbation and biological response. Sci. Rep. 2012;2:486. doi: 10.1038/srep00486. - DOI - PMC - PubMed