. 2023 Nov 30;14(1):7909.
doi: 10.1038/s41467-023-43615-2.

A dynamic partitioning mechanism polarizes membrane protein distribution

Affiliations

A dynamic partitioning mechanism polarizes membrane protein distribution

Tatsat Banerjee et al. Nat Commun. .

Abstract

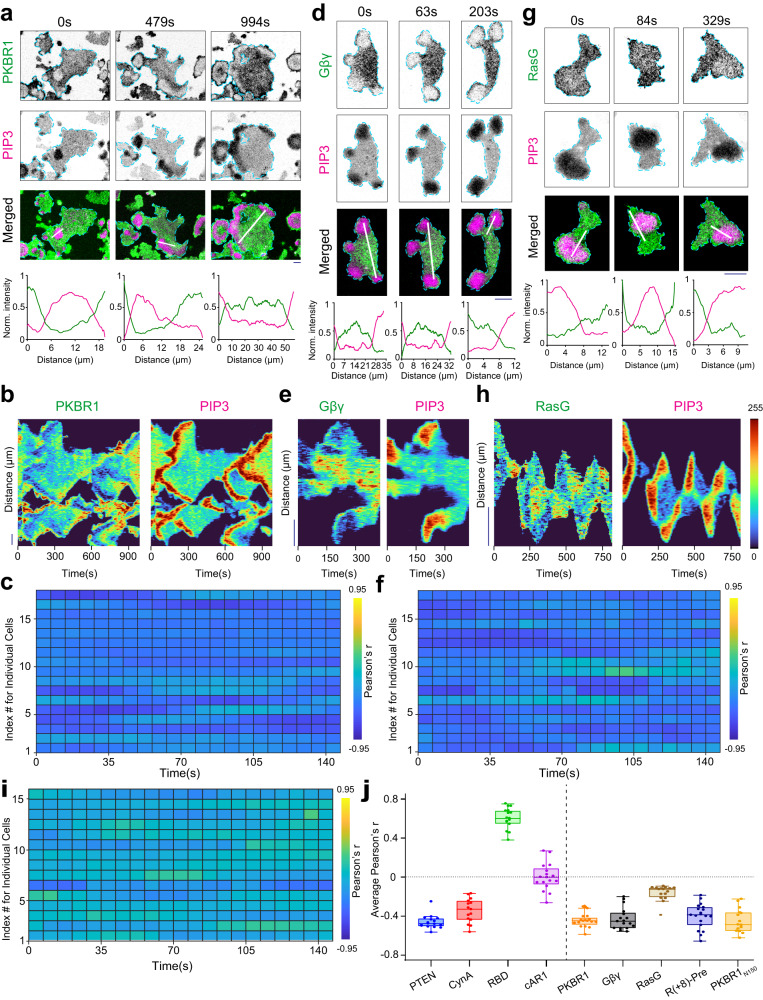
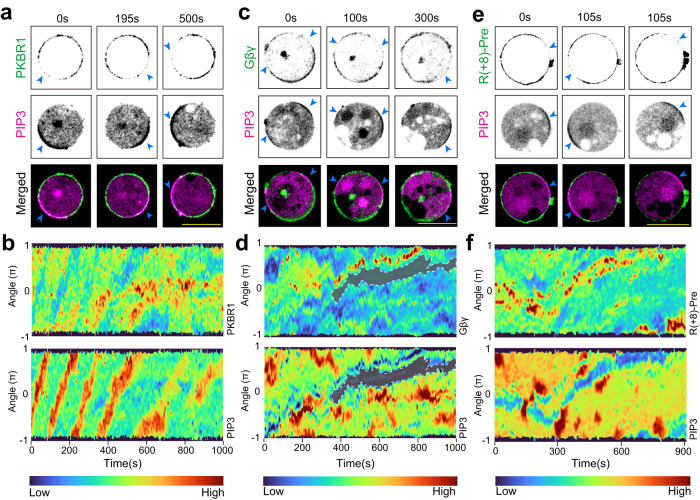
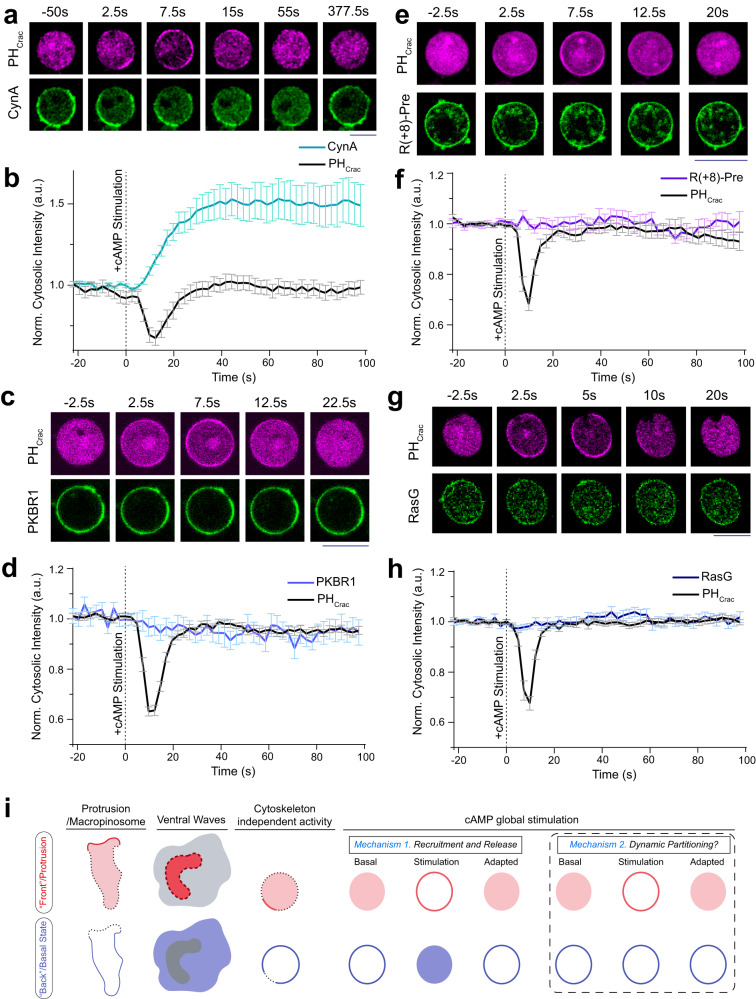
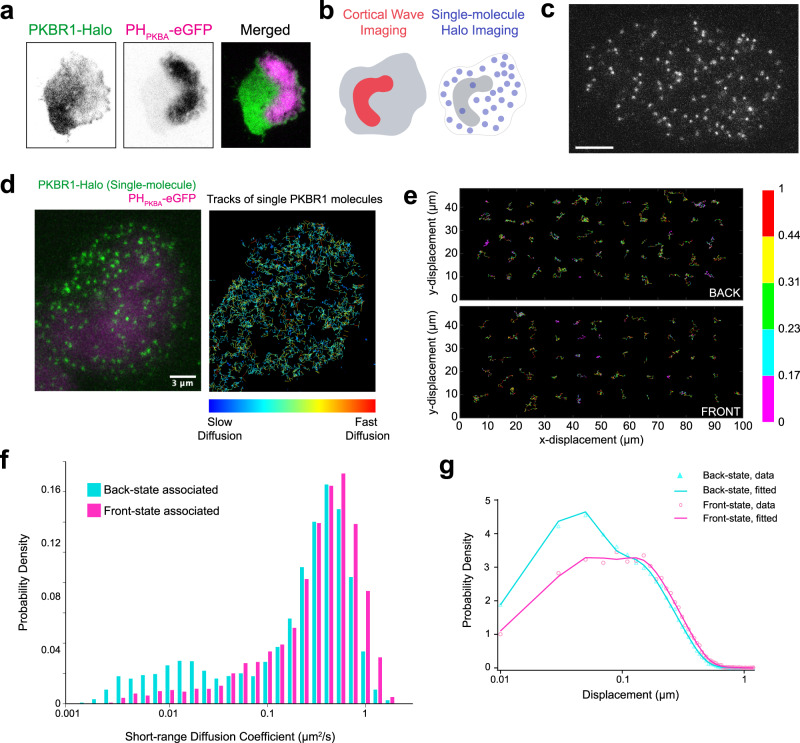
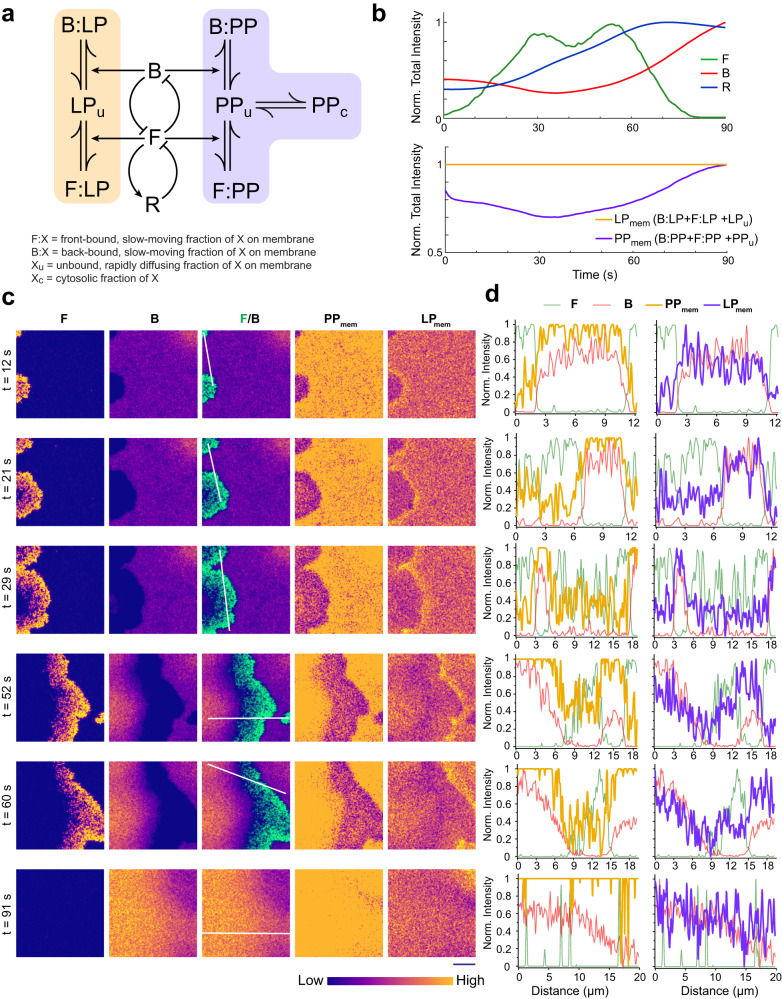
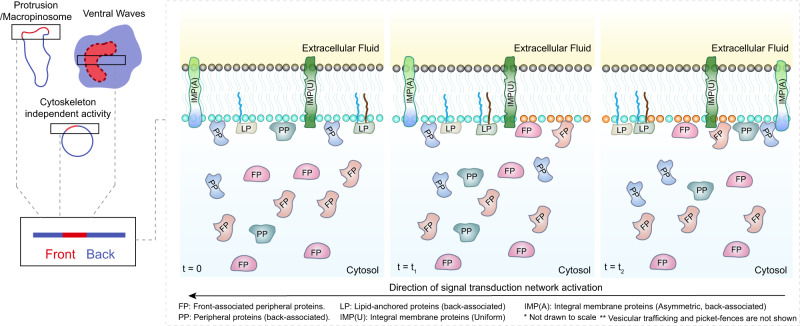
The plasma membrane is widely regarded as the hub of the numerous signal transduction activities. Yet, the fundamental biophysical mechanisms that spatiotemporally compartmentalize different classes of membrane proteins remain unclear. Using multimodal live-cell imaging, here we first show that several lipid-anchored membrane proteins are consistently depleted from the membrane regions where the Ras/PI3K/Akt/F-actin network is activated. The dynamic polarization of these proteins does not depend upon the F-actin-based cytoskeletal structures, recurring shuttling between membrane and cytosol, or directed vesicular trafficking. Photoconversion microscopy and single-molecule measurements demonstrate that these lipid-anchored molecules have substantially dissimilar diffusion profiles in different regions of the membrane which enable their selective segregation. When these diffusion coefficients are incorporated into an excitable network-based stochastic reaction-diffusion model, simulations reveal that the altered affinity mediated selective partitioning is sufficient to drive familiar propagating wave patterns. Furthermore, normally uniform integral and lipid-anchored membrane proteins partition successfully when membrane domain-specific peptides are optogenetically recruited to them. We propose "dynamic partitioning" as a new mechanism that can account for large-scale compartmentalization of a wide array of lipid-anchored and integral membrane proteins during various physiological processes where membrane polarizes.


Conflict of interest statement

The authors declare no competing interests.

Figures

Fig. 1
Fig. 1. Asymmetric dynamics of multiple lipid-anchored membrane proteins during ventral wave propagation and protrusion formation.
adg Representative live-cell time-lapse images of cortical waves on the ventral surface of a Dictyostelium cell co-expressing PIP3 biosensor PHCrac-mCherry along with PKBR1-KikGR (a), or KikGR-Gβ (d), or GFP-RasG (g), demonstrating dynamic depletion of PKBR1, Gβγ, and RasG from the activated regions of the membrane (which are marked by PIP3). Line-scan intensity profiles are shown in the bottommost panels. Throughout the study, line-scan intensity profiles are shown in bottommost or rightmost panels. Times are always indicated in seconds in top or left. Unless otherwise mentioned, all scale bars are 10 μm. b, e, h Representative line-kymographs of wave patterns shown in cell (a), (d), and (g), respectively, showing the consistency of complementary localization of PKBR1 (b), Gβγ (e), and RasG (h) with respect to front-state marker PIP3 over time. The intensities in all kymographs are plotted with “Turbo" colormap (shown in right). c, f, i Quantification of consistency and extent of complementarity of PKBR1 (c)/Gβγ (f)/ RasG (i) with respect to PIP3 in terms of Pearson’s correlation coefficient (r). Number of cells: nc = 17 (c), 17 (f), 15 (i); nf = 20 frames were analyzed (7 s/frame) for each of nc cells. Unless otherwise mentioned, throughout the study, the Pearson’s correlation coefficients (r) were computed with respect to PIP3 and nf=20 frames were analyzed (7 s/frame) for each cell. Heatmaps were plotted in “Parula” colormap. j Time averaged Pearson’s r of PTEN (nc=16), CynA (nc=15), RBD (nc = 16), cAR1 (nc = 17), PKBR1 (nc = 17), Gβγ (nc = 17), RasG (nc = 15), R(+8)-Pre (nc = 19), and PKBR1N150 (nc = 15), where nc denotes the number of cell. To generate each data point, 20 frames (imaged at 7 s/frame) were averaged over time for each of these cells (nc). Boxes extend from the 25th to 75th percentiles, median is at the center, and whiskers and outliers are graphed as per Tukey’s convention (as computed by Graphpad Prism). Source data are provided as a Source Data file.
Fig. 2
Fig. 2. Dynamic polarization of multiple lipid-anchored membrane proteins in cytoskeleton-impaired cells.
a, c, e Representative live-cell time-lapse images of Dictyostelium cell co-expressing PHCrac-mCherry along with PKBR1-KikGR (a), KikGR-Gβ (c), or GFP-R(+8)-Pre (e) showing depletion of PKBR1, Gβγ, and R(+8)-Pre from the activated/front-states of the membrane, which are marked by the traveling PIP3 crescents (indicated with blue arrowheads). In all cases, cells were pre-treated with 5 μM Latrunculin-A (final concentration) to inhibit actin polymerization and waves were induced. b, d, f The 360 membrane kymographs (see “Methods” for details) of asymmetric wave propagation in cells shown in (a), (b), and (c), respectively. Note that the depletion of PKBR1 (b), Gβγ (d), and R(+8)-Pre (f) from the front-state crescents of PIP3 is highly consistent over the entire time course of the experiment.
Fig. 3
Fig. 3. Profiles of back-associated peripheral, lipid-anchored, and integral membrane proteins during global receptor activation.
a Representative live-cell images of Dictyostelium cells co-expressing PHCrac-mCherry and CynA-KikGR upon global cAMP stimulation, demonstrating that upon transient global activation of cAR1 receptors, PHCrac gets uniformly recruited to membrane whereas CynA gets dissociated from the membrane and translocates to cytosol. Both responses adapted over time, although CynA adaptation took longer time. In all global stimulation experiments, at time t=0 s, 10 μM (final concentration) cAMP was added. b Time series plot of normalized cytosolic intensities of CynA and PHCrac, showing the kinetics of the response upon global stimulation with cAMP (also see Supplementary Fig. 8a which demonstrates the time-course of adaptation for CynA). In all these figures, vertical dashed lines are used to indicate the time of stimulation. Mean ± SEM are shown for nc=15 cells. ch Response of Dictyostelium cells co-expressing PHCrac-mCherry and PKBR1-KikGR (c, d) / GFP-R(+8)-Pre (e, f) / GFP-RasG (g, h) upon global cAMP stimulation. Live-cell images (c, e, g) and temporal profile of normalized cytosolic intensities (d, f, h) are shown demonstrating the transient recruitment of PHCrac to membrane whereas lipid-anchored proteins such as PKBR1, R(+8)-Pre, and RasG remained steadily membrane bound throughout the entire time course of the experiment. Mean ± SEM are shown for nc = 17 cells (d), nc= 15 cells (f), and nc = 15 cells (h). i Left three panels of the schematic summarizing the front-back complementarity in migrating cell protrusions, ventral wave propagation, and cytoskeleton independent signaling events. In right panels, schematic is showing two different responses observed during global receptor activation experiments, suggesting the existence of two different mechanisms that drive dynamic compartmentalization process. In contrast to “shuttling" based polarization of peripheral membrane proteins (Scenario 1), the lipid-anchored or integral membrane proteins (Scenario 2) do not dissociate, but possibly spatiotemporally rearranges over the plane of membrane to exhibit asymmetric distribution during different physiological processes. Source data are provided as a Source Data file.
Fig. 4
Fig. 4. Photoconversion microscopy based protein tracking assay of different back-associated lipid-anchored proteins.
a Setup of photoconversion experiment and possible mechanisms of wave propagation on the substrate-attached surface. In the cells where a photoconvertible fluorescent protein tagged back-protein was expressed, waves of activated regions appear as dynamic dark shadows (dark gray regions). The 405 nm laser was selectively illuminated in an area ahead of such shadow waves. Purple arrows: Wave propagation direction; tan-colored hatched region: photoconversion area. The dynamics of the molecules which were converted from green to red (magenta region in bottom panels) were tracked and analyzed for different proteins. b Schematic of optical flow vector analysis. PC: Photoconverted area shown in magenta, SW: Shadow waves (i.e. the front-state/activated region waves of the membrane, as they appear in the cells expressing a back proteins) shown in light-gray. Inner circle encloses photoconverted area whereas outer circle shows the area up to which shadow waves were considered for optical flow analysis (R = 0.2r--0.3r). VSW: Resultants of all shadow wave vectors inside the outer circle (a zoomed in part is shown with violet flow vectors). VR: Resultant optical flow vectors of photoconverted region PC. cd Live-cell time-lapse images of Dictyostelium cells expressing PKBR1-KikGR (c) or KikGR-Gβ (d) showing very little dissociation of PC-PKBR1 and PC-Gβγ molecules from the membrane as waves propagated through the initial illumination area, indicating a spontaneous dynamic partitioning and lateral propagation mechanism. Third horizontal rows are showing masks generated by automated segmentation; PC(red): Photoconverted area, F(blue): Front-state regions (which appeared as shadow waves in green channel imaging), B (green): Back-state regions shown in green. Inner and Outer Magenta circles: as described in (b). The last horizontal rows are showing optical flow vectors along with segmented photoconversion area and associated -shadow wave regions. Shadow-wave region’s and photoconverted region’s optical flow vectors are shown in green and white, respectively. e Time-series plot of normalized intensity of the photoconverted membrane molecules demonstrating that intensity of lipid-anchored membrane proteins (PKBR1, Gβγ) do not change as waves propagate whereas intensities of typical shuttling-type peripheral membrane proteins (PTEN, CynA, Lifeact) decrease sharply within 70 s. Data are mean ± SEM. nc (number of cells) = 14 (for PKBR1), 10 (for Gβγ), 11 (for PTEN), 13 (for CynA), 11 (for Lifeact). f, g Polar histograms depicting the probability distribution of angle between resultant of optical flow vectors of front-state shadow-waves (VSW) and of the photoconverted regions (VPC). (f): PKBR1, nf = 154 frames; (g) Gβγ, nf = 97 frames. Source data are provided as a Source Data file.
Fig. 5
Fig. 5. Single-molecule imaging experiments to measure the different diffusion coefficients in front and back-state regions of the plasma membrane.
a Representative live-cell image of Dictyostelium cells co-expressing PKBR1-Halo and PIP3 sensor PHPKBA-eGFP showing a complimentary localization profile of PKBR1 and PIP3 during wave propagation. b Set up of single-molecule imaging experiments where the coordinates of dynamic front-states were spatiotemporally tracked by imaging ventral waves using PHPKBA, and single-molecules of Halo tagged (TMR conjugated) PKBR1 was imaged in the other channel. c A representative TIRF microscopy image of Dictyostelium cell showing PKBR1-Halo-TMR molecules (scale bar: 5 μm). Also see Supplementary Fig. 11a, b for single-molecule characterization. d Left: A representative multiscale TIRF microscopy image of Dictyostelium cell where magenta is showing the front-state regions with high PIP3 level whereas green is showing the single PKBR1-Halo-TMR molecules throughout the membrane. Right: The trajectories of single PKBR1 molecules movement detected during 2s in the cell shown in left. The colormap indicates the amount of movement. Note that, PKBR1 molecules are less in front-state regions of the membrane and they are moving slowly inside the back-state regions of the membrane which can explain their increased accumulation inside back-state regions. e Color-coded Trajectories of single PKBR1 molecules undergoing lateral diffusion on the membrane inside the back- (upper panel) and front-state regions (lower panel). Color bar on the right is depicting the amount of displacement between two consecutive frames (numbers in right colorbar are displacements in μm). f Histograms of the short range diffusion coefficients of front-state associated PKBR1 molecules (magenta) and back-state associated PKBR1 molecules (cyan) showing a significant fraction of back-state PKBR1 molecules exhibit a highly slower lateral diffusion compared to their front counterparts. g Probability density distribution of the displacement of single PKBR1 molecules during 33 ms in front- and back-states of the membrane indicating displacement in back-state is comparatively less. Source data are provided as a Source Data file.
Fig. 6
Fig. 6. Spatiotemporal stochastic simulation of an excitable network that incorporates the dynamics of lipid-anchored and peripheral back-state associated membrane proteins.
a Schematic showing excitable network, coupled with reactions involving peripheral membrane proteins (PP) and lipid-anchored membrane proteins (LP). Excitable network consists of three membrane states: F (front), B (back), and R (refractory). Membrane-associated, freely moving unbound species (denoted with `u' subscripts) binds with two different states of the membrane) to form strongly membrane-bound, slowly moving species (denoted with B: and F: notations for back-region bound and front-region bound species, respectively). Unlike PP, LP cannot shuttle between membrane and cytosol. b Temporal profiles of normalized total intensity for different species (F, B, R, total LP, and membrane-associated PP). Although the bound and unbound fraction of LP varies locally (see Supplementary Fig. 12b), the total amount of LP on the membrane remains unchanged over time, whereas due to shuttling between membrane and cytosol, the total membrane fraction (combining bound and unbound) of PP fluctuates. c Simulated spatiotemporal profiles of F, B, combined F/B, and total membrane fractions of PP and LP. As wave propagation was initiated (from the left edge of the simulation domain), due to stochastic firing of the excitable network, both PP and LP exhibited compartmentalization and became dynamically aligned with the back-state. Dynamic profiles are shown in Matplotlib “plasma" colormap, as shown below. d Normalized spatial intensity profiles of total membrane fraction of LP, PP, F, and B along the white lines in (c). Note that like experimental observations, simulated LP profiles show the slight accumulation in the areas just ahead of the advancing-waves.
Fig. 7
Fig. 7. Effect of the acute manipulation of membrane region specific affinity of different lipid-anchored and integral membrane proteins.
a Schematic for increasing the back-state region specific affinity of uniformly distributed transmembrane protein cAR1. Upon 488 nm irradiation, the cytosolic CRY2PHR, which is fused to positively charged peptide (R+) or blank (ϕ, CTRL), gets globally recruited to CIBN-fused cAR1. b Live-cell images of Dictyostelium co-expressing cAR1-CIBN, CRY2PHR-mCherry-R+, and Lifeact-HaloTag(Janelia Fluor 646), before and after global 488 nm illumination (in all cases, laser was turned on at time t = 0 s). White arrowheads: F-actin rich protrusions before or right after recruitment; Green arrowheads: F-actin rich protrusions from where cAR1-CIBN/recruited CRY2PHR-mcherry-R+ was excluded. c, d Live-cell images of ventral wave propagation in Dictyostelium cell co-expressing cAR1-CIBN, CRY2PHR-mCherry-R+, along with PHCrac-YFP (c) or Lifeact-HaloTag(Janelia Fluor 646) (d), before and after global 488 nm irradiation. First two time point images in (c) and the inset image of second time point in (d) are showing confocal slices around the middle z-section (proving successful recruitment); other images are focusing on the substrate-attached surface of cell to visualize wave propagation. e Live-cell images of differentiated HL-60 cells, before and after recruitment of cytosolic CRY2PHR-mCherry-R+ to membrane bound Lyn11-CIBN-GFP. Blue arrowheads: The uropods or back-state regions of neutrophils where CRY2PHR-mCherry-R+ was localized upon recruitment, which in turn polarized the membrane distribution of Lyn11 there. f Box and whisker plots and aligned dot plots of front-state regions to back-state region intensity ratio of F-actin biosensor LimE (tan) and cAR1-CIBN (purple), after the recruitment of CRY2PHR-mCherry-R+ or CRY2PHR-mCherry(CTRL). For each of the nc = 11 (for CTRL) or nc = 12 (for R+) cells, intensity ratio values for nf = 5 frames were plotted (nc: number of cells; nf : number of frames); p values (two-sided, by Mann–Whitney-Wilcoxon test): n.s.: 0.1391, ****: ≤0.0001. Boxes extend from the 25th to 75th percentiles, median is at the center, and whiskers and outliers are graphed as per Tukey’s convention (as computed by Graphpad Prism). Source data are provided as a Source Data file.
Fig. 8
Fig. 8. Schematic illustration showing the effect of dynamic partitioning and shuttling in plasma membrane organization.
Note that both front- (FP) and back-associated (PP) peripheral membrane proteins, can shuttle on and off from membrane since their membrane binding is weaker. However, back-associated lipid-anchored proteins (LP), which cannot translocate to and from cytosol, changes its diffusion profile to move faster inside the front-states of the membrane, to exhibit polarized distribution. Similar partitioning can drive symmetry breaking of integral membrane proteins (IMP(A)) or tightly-bound peripheral membrane proteins (not shown) as well. The headgroups of the inner leaflet lipid molecules that are enriched in front-state (such as PIP3, DAG, etc.) are shown in orange. The headgroups of inner leaflet lipid molecules that are enriched in back or basal-state (such as PI(4,5)P2, PI(3,4)P2, PS, PA, etc.) are shown in cyan. At time t=0, the entire membrane is in the resting/basal/back state. At t = t1, signaling network activation was started at the right end which propagated to left at t = t2.

Update of

References

    1. SenGupta S, Parent CA, Bear JE. The principles of directed cell migration. Nat. Rev. Mol. Cell Biol. 2021;22:529–547. doi: 10.1038/s41580-021-00366-6. - DOI - PMC - PubMed
    1. Devreotes PN, et al. Excitable signal transduction networks in directed cell migration. Annu. Rev. Cell Dev. Biol. 2017;33:103–125. doi: 10.1146/annurev-cellbio-100616-060739. - DOI - PMC - PubMed
    1. Ridley AJ, et al. Cell migration: integrating signals from front to back. Science. 2003;302:1704–1709. doi: 10.1126/science.1092053. - DOI - PubMed
    1. Pal DS, Li X, Banerjee T, Miao Y, Devreotes PN. The excitable signal transduction networks: movers and shapers of eukaryotic cell migration. Int J Dev Biol. 2019;63:407–416. doi: 10.1387/ijdb.190265pd. - DOI - PMC - PubMed
    1. Shellard A, Mayor R. All roads lead to directional cell migration. Trends Cell Biol. 2020;30:852–868. doi: 10.1016/j.tcb.2020.08.002. - DOI - PubMed

Publication types

MeSH terms