. 2023 Nov 30;14(1):7880.
doi: 10.1038/s41467-023-43368-y.

Bile proteome reveals biliary regeneration during normothermic preservation of human donor livers

Affiliations

Bile proteome reveals biliary regeneration during normothermic preservation of human donor livers

Adam M Thorne et al. Nat Commun. .

Abstract

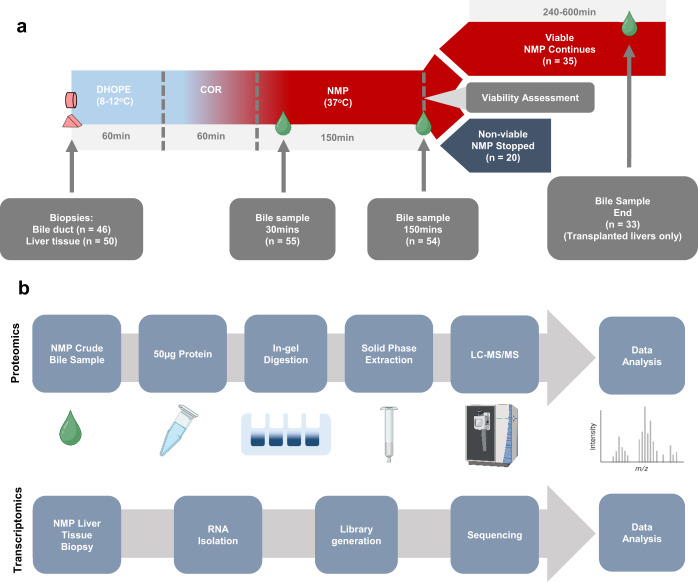
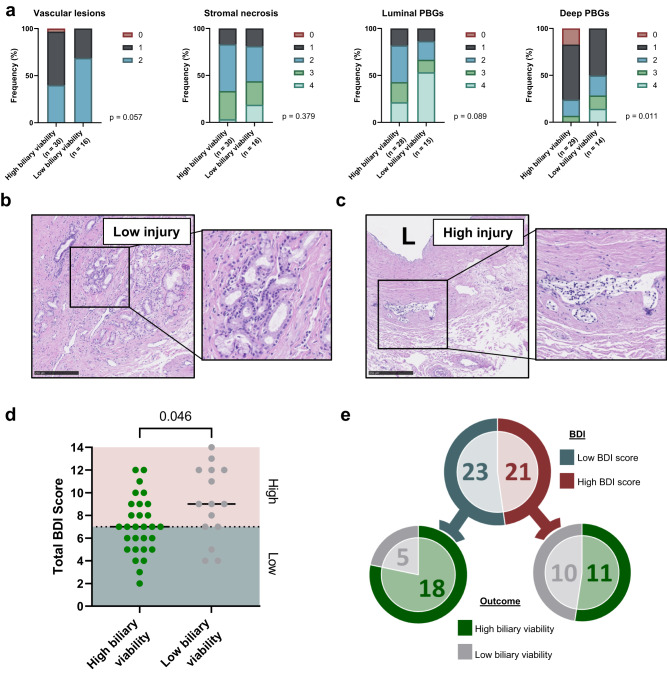
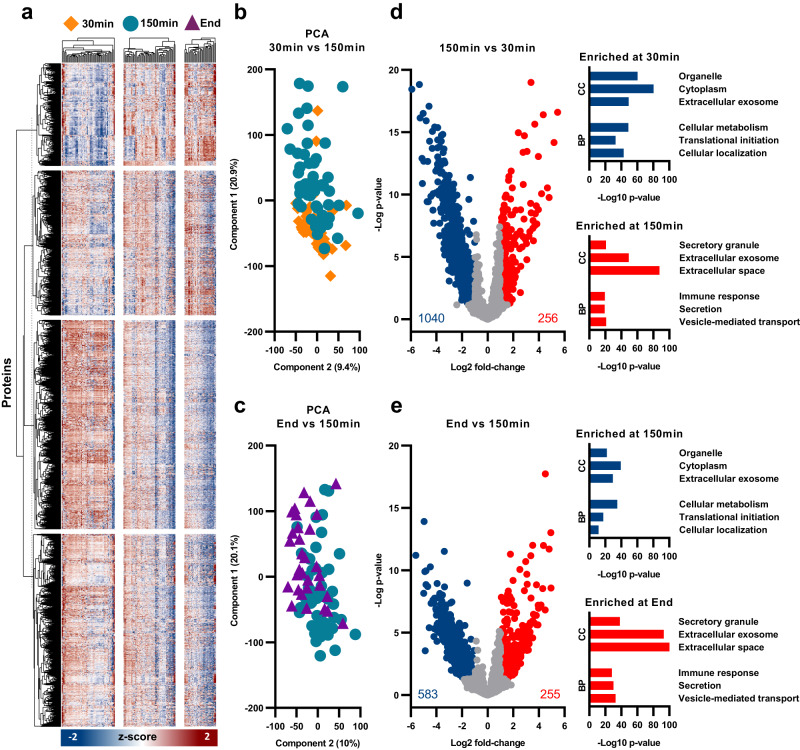
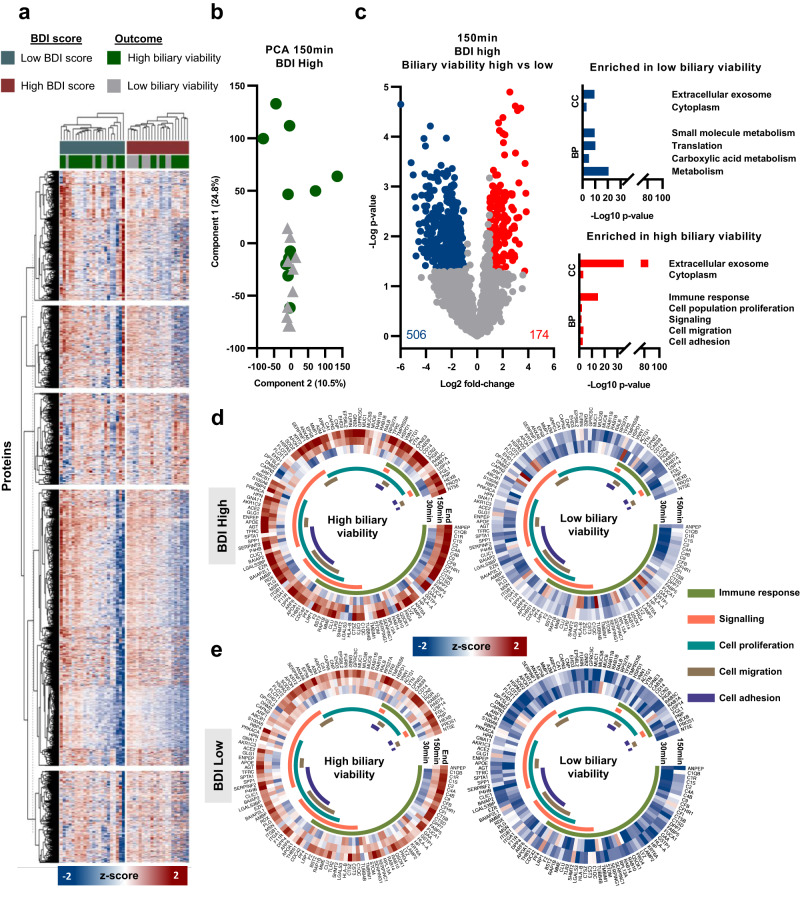
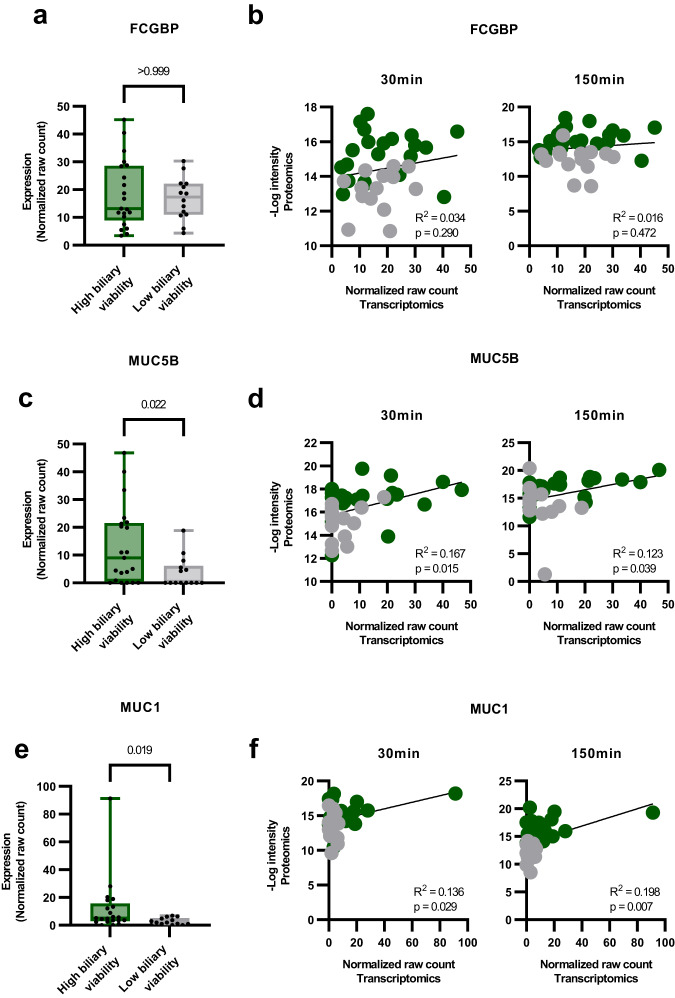
Normothermic machine perfusion (NMP) after static cold storage is increasingly used for preservation and assessment of human donor livers prior to transplantation. Biliary viability assessment during NMP reduces the risk of post-transplant biliary complications. However, understanding of molecular changes in the biliary system during NMP remains incomplete. We performed an in-depth, unbiased proteomics analysis of bile collected during sequential hypothermic machine perfusion, rewarming and NMP of 55 human donor livers. Longitudinal analysis during NMP reveals proteins reflective of cellular damage at early stages, followed by upregulation of secretory and immune response processes. Livers with bile chemistry acceptable for transplantation reveal protein patterns implicated in regenerative processes, including cellular proliferation, compared to livers with inadequate bile chemistry. These findings are reinforced by detection of regenerative gene transcripts in liver tissue before machine perfusion. Our comprehensive bile proteomics and liver transcriptomics data sets provide the potential to further evaluate molecular mechanisms during NMP and refine viability assessment criteria.


Conflict of interest statement

The authors declare no competing interests.

Figures

Fig. 1
Fig. 1. Overview of machine perfusion and proteomics and transcriptomics workflows.
a Workflow schematic of the DHOPE-COR-NMP procedure. Sample numbers (n = ) are displayed for each time point: 30 min after start of NMP (37 °C) and 150 min (2.5 h) NMP, the time viability assessment of the liver was conducted. For livers that were deemed viable and subsequently transplanted, bile samples were taken from a common time point towards the end of the perfusion (End), allowing a window of 120 min. Livers considered non-viable livers were not transplanted and the perfusion terminated at the time of viability assessment (150 min). b Workflow schematic of sample preparation for proteomics analysis by LC-MS/MS. Fifty micrograms of protein were taken from each crude bile sample and ran on an SDS-PAGE gel. Proteomics were reduced, alkylated, digested with trypsin and cleaned-up using solid phase extraction. Peptides were separated using Ultra High Performance Liquid Chromatography prior to analysis by MS/MS. RNA sequencing libraries were constructed according to the Smart-3SEQ protocol. Created with Biorender.com.
Fig. 2
Fig. 2. Histological analysis of bile duct injury (BDI) prior to machine perfusion.
a Bar charts showing frequency (%) of injury score in livers with high vs low biliary viability score in four areas: vascular lesions, stroma necrosis, luminal peribiliary glands (PBGs) and deep PBGS. A hematoxylin and eosin-stained histological example of a low injury and high injury bile duct are shown in (b, c), respectively. Histological analysis was performed on n = 46 bile duct biopsies, however two of these were not possible to grade fully. Insets show an intact PBG cluster, located deep in the bile duct wall (b) and a damaged luminal PBG (c). L, lumen; scale bars 250 μm. d Dot-plot showing the total BDI score for livers with high and low biliary viability scores, as defined by the traffic light scoring system; 2 point for green values, 1 for orange, 0 for red. High and low histological BDI is depicted by the red (high injury, n = 29) and blue (low injury, n = 15) sections of the graph, based on the median histological BDI score (7) from all livers. P values were calculated using two-tailed Mann–Whitney test. e Chart depicting distribution of livers in low and high BDI groups, and the subsequent biliary viability score of livers within each group.
Fig. 3
Fig. 3. Longitudinal protein abundance in all samples at 30 min, 150 min and End of NMP.
a Heat map showing z-score intensity of all proteins identified following 40% valid value filtering. Columns represent individual samples and are separated into three time points: 30 min, 150 min and End. Rows represent individual proteins and were separated using k-means clustering. Columns are clustered hierarchically. b Principal component analysis (PCA) comparing 30 min (orange diamond) and 150 min (blue circle). c Principal component analysis comparing 150 min (blue circle) and End (purple triangle). d Volcano plot showing significance and fold change of protein intensity at 150 min vs 30 min. Significant proteins (p < 0.05, >2-fold change) are highlighted red for upregulated (enriched at 150 min) and blue for downregulated (enriched at 30 min). Statistics were performed using a two-tailed Students t test with a permutation-based FDR of 0.05 to assess multiple comparisons. Cellular component (CC) and biological process (BP) gene ontology (GO) pathways are displayed as –Log10 p value. e Volcano plot showing significance and fold change of protein intensity at End vs 150 min. Significant proteins (p < 0.05, >2-fold change) are highlighted red for upregulated and blue for downregulated. Statistics were performed using a two-tailed Students t test with a permutation-based FDR of 0.05 to assess multiple comparisons. The CC and BP gene ontology pathways are displayed as -Log10 p value.
Fig. 4
Fig. 4. Protein abundance between livers with high and low bile duct injury (BDI), and high and low biliary viability score.
a Heat map showing z-score intensity of all proteins identified following 40% valid value filtering. Columns represent individual samples at 150 min normothermic machine perfusion (NMP) and are split into two groups: low BDI and high BDI. Columns are further stratified into high (green) and low (gray) biliary viability score categories. Rows represent individual proteins. Columns and rows are clustered hierarchically. b Principal component analysis (PCA) of individual livers with high BDI at 150 min. Livers with high biliary viability scores are represented by green circles, low biliary viability scores with gray triangles. c Volcano plot showing significance and fold-change of protein intensity, comparing livers with high and low biliary viability scores within the high BDI group at 150 min. Significant proteins (p < 0.05, >2-fold change) are highlighted red for upregulated (enriched in high biliary viability score livers) and blue for downregulated (enriched in low biliary viability score livers). Statistics were performed using a two-tailed Students t test with a permutation-based FDR of 0.05 to assess multiple comparisons. Cellular component (CC) and biological process (BP) gene ontology (GO) pathways are displayed as –Log10 p value. Average (mean) z-score intensity of proteins involved in the five selected pathways (immune response, signaling, cell proliferation, cell migration and cell adhesion) in high and low biliary viability score livers within the high BDI group (d) and low BDI group (e).
Fig. 5
Fig. 5. Transcriptomic analysis of liver tissue biopsies prior to machine perfusion.
a Box plots showing individual normalized raw count transcript expression for FCGBP in high (n = 21) and low (n = 14) BDI livers and (b) correlation of transcript raw counts (x-axis) with protein intensity (-Log10; y-axis) within high and low BDI groups at 30 min and 150 min time points (n = 35). R2 and correlation p value are displayed for each comparison. Livers with high biliary viability score are represented by green, low biliary viability score with gray. The same graphs are depicted for MUC5B (c, d) and MUC1 (e, f). Data in box plots are presented as mean values showing 25th to 75th percentiles, with whiskers for minimum and maximum values. Box plot p values were calculated using two-tailed Mann–Whitney test. Correlation p values were performed using simple linear regression.

References

    1. Kwong AJ, et al. OPTN/SRTR 2019 annual data report: Liver. Am. J. Transpl. 2021;21:208–315. doi: 10.1111/ajt.16494. - DOI - PubMed
    1. Adam R, et al. 2018 Annual Report of the European Liver Transplant Registry (ELTR) − 50-year evolution of liver transplantation. Transpl. Int. 2018;31:1293–1317. doi: 10.1111/tri.13358. - DOI - PubMed
    1. Mourad MM, Algarni A, Liossis C, Bramhall SR. Aetiology and risk factors of ischaemic cholangiopathy after liver transplantation. World J. Gastroenterol. 2014;20:6159–6169. doi: 10.3748/wjg.v20.i20.6159. - DOI - PMC - PubMed
    1. de Vries Y, von Meijenfeldt FA, Porte RJ. Post-transplant cholangiopathy: Classification, pathogenesis, and preventive strategies. Biochim Biophys. Acta Mol. Basis Dis. 2018;1864:1507–1515. doi: 10.1016/j.bbadis.2017.06.013. - DOI - PubMed
    1. Nasralla D, et al. A randomized trial of normothermic preservation in liver transplantation. Nature. 2018;557:50–56. doi: 10.1038/s41586-018-0047-9. - DOI - PubMed

Publication types

Associated data