. 2023 Nov 30;14(1):7890.
doi: 10.1038/s41467-023-43477-8.

Diurnal temperature range as a key predictor of plants' elevation ranges globally

Affiliations

Diurnal temperature range as a key predictor of plants' elevation ranges globally

Arnaud Gallou et al. Nat Commun. .

Erratum in

Abstract

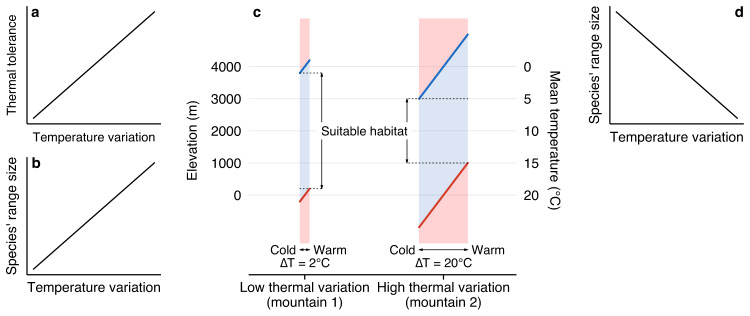
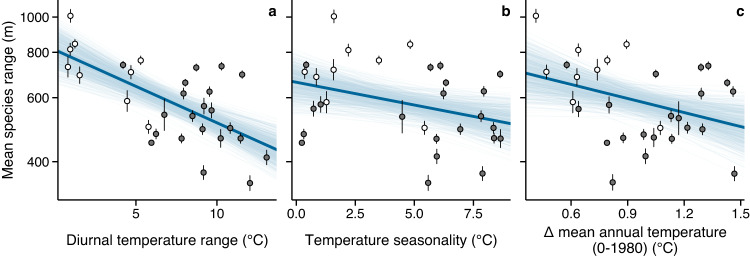
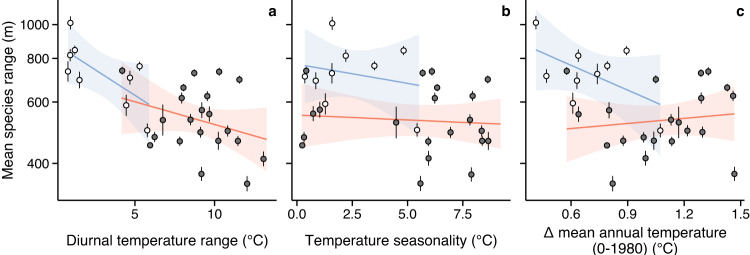
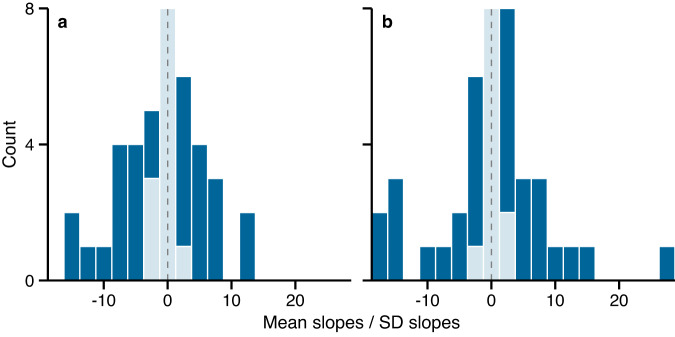
A prominent hypothesis in ecology is that larger species ranges are found in more variable climates because species develop broader environmental tolerances, predicting a positive range size-temperature variability relationship. However, this overlooks the extreme temperatures that variable climates impose on species, with upper or lower thermal limits more likely to be exceeded. Accordingly, we propose the 'temperature range squeeze' hypothesis, predicting a negative range size-temperature variability relationship. We test these contrasting predictions by relating 88,000 elevation range sizes of vascular plants in 44 mountains to short- and long-term temperature variation. Consistent with our hypothesis, we find that species' range size is negatively correlated with diurnal temperature range. Accurate predictions of short-term temperature variation will become increasingly important for extinction risk assessment in the future.


Conflict of interest statement

The authors declare no competing interests.

Figures

Fig. 1
Fig. 1. Illustration of Stevens’ hypothesis and the temperature range squeeze hypothesis.
Based on the assumption that species have larger thermal tolerances in climatically variable habitats than in less climatically variable ones (a), Stevens predicted a positive relationship between species’ range sizes and temperature variability (b). Panel c represents the spatio-temporal temperature variation in mountains with different levels of temperature fluctuation as explained in the temperature range squeeze hypothesis. For simplicity, we used a constant lapse rate of 0.5°C. Shaded areas represent tolerable (blue) and lethal (red) temperatures for a species’ thermal tolerance spanning from 0 °C to 20 °C. The widths of the shaded areas represent temperature variability over time (ΔT), while the spatial variation in temperatures is described by the vertical axes. Thick blue and red lines indicate the 0 °C and 20 °C isotherms, respectively. The suitable habitat, which corresponds to species’ maximum theoretical elevation range in the absence of avoidance strategies such as dormancy, is defined by elevations in which the species does not encounter a limiting temperature (i.e. below 0 °C or above 20 °C) at any time of the given time scale. The elevation span of the suitable habitat is expected to shrink as thermal variability increases (c, compare mountains 1 and 2). Thus, a negative relationship between species’ range sizes and thermal variation is expected (d).
Fig. 2
Fig. 2. Relationships between thermal variability and mean species’ elevation ranges.
Diurnal temperature range (a), temperature seasonality (b) and the variation of mean annual temperature from 0 to 1980 AD (c). Points represent the estimated mean elevation ranges with their respective standard error in each of the 30 standardized elevation gradients with length ≥ 2500 m. Thick blue lines are the posterior mean calculated from 600 random draws sampled from the 95% credible interval (thin blue lines). Colored dots indicate island (white) and continental (dark gray) mountains. Source data are provided as a Source Data file.
Fig. 3
Fig. 3. Relationships between thermal variability and mean species’ elevation ranges in island and continental mountains.
Diurnal temperature range (a), temperature seasonality (b) and the variation of mean annual temperature from 0 to 1980 AD (c). Points represent the estimated mean elevation ranges with their respective standard error in each of the 30 standardized elevation gradients with length ≥ 2500 m. Colors indicate island (white dots, blue regressions) and continental (dark gray dots, orange regressions) mountains. Source data are provided as a Source Data file.
Fig. 4
Fig. 4. Results from the local-scale analyses.
Responses of species’ elevation ranges to diurnal temperature range (a) and temperature seasonality (b) within each of the 44 mountains used in the study. Histograms are of mean slope terms divided by their standard deviation from the 95% credible interval for the local-scale analyses. Colors indicate whether the 95% credible interval includes 0 (light blue) or not (dark blue). Dashed lines indicate 0. Source data are provided as a Source Data file.

References

    1. Brown JH, Stevens GC, Kaufman DM. The geographic range: size, shape, boundaries, and internal structure. Annu. Rev. Ecol. Syst. 1996;27:597–623. doi: 10.1146/annurev.ecolsys.27.1.597. - DOI
    1. von Humboldt, A. & Bonpland, A.Essai sur la géographie des plantes. (Levrault, Schoell & Co., Paris, 1805).
    1. Gaston KJ, Chown SL. Why Rapoport’s rule does not generalise. Oikos. 1999;84:309–312. doi: 10.2307/3546727. - DOI
    1. Colwell RK, Lees DC. The mid-domain effect: geometric constraints on the geography of species richness. Trends Ecol. Evol. 2000;15:70–76. doi: 10.1016/S0169-5347(99)01767-X. - DOI - PubMed
    1. McCain CM. Vertebrate range sizes indicate that mountains may be ‘higher’ in the tropics. Ecol. Lett. 2009;12:550–560. doi: 10.1111/j.1461-0248.2009.01308.x. - DOI - PubMed

Publication types