. 2023 Nov 30;14(1):7884.
doi: 10.1038/s41467-023-43290-3.

Delineating the interplay between oncogenic pathways and immunity in anaplastic Wilms tumors

Affiliations

Delineating the interplay between oncogenic pathways and immunity in anaplastic Wilms tumors

Xiaoping Su et al. Nat Commun. .

Abstract

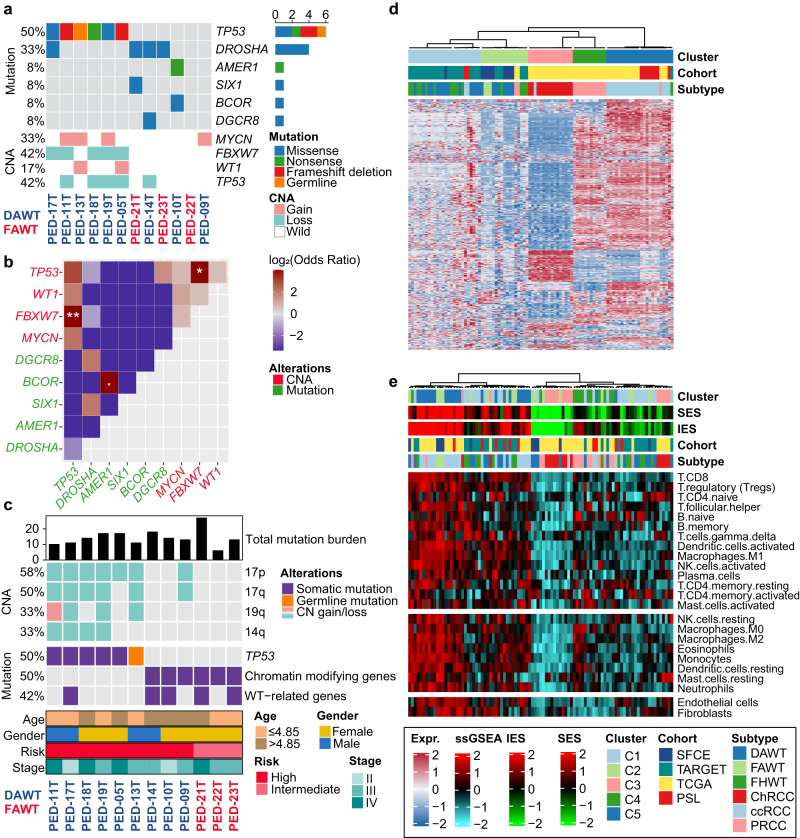
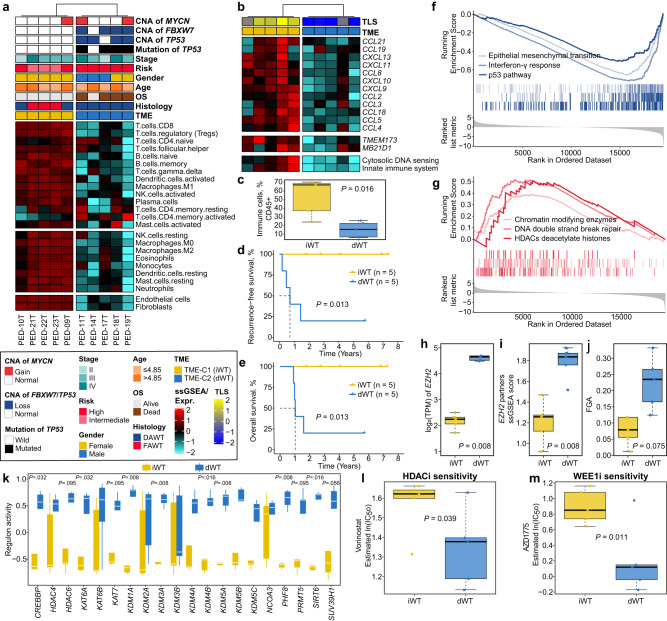
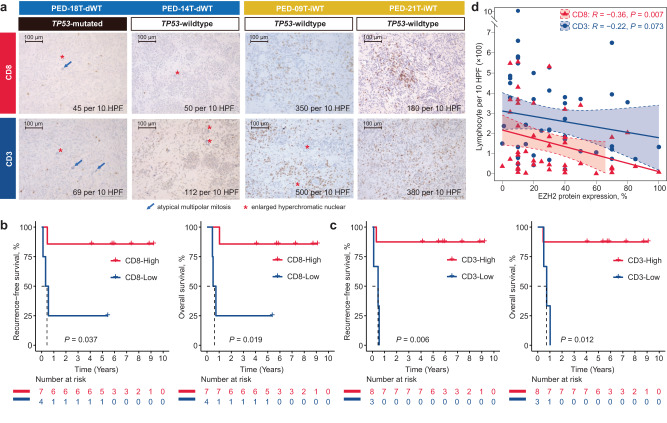
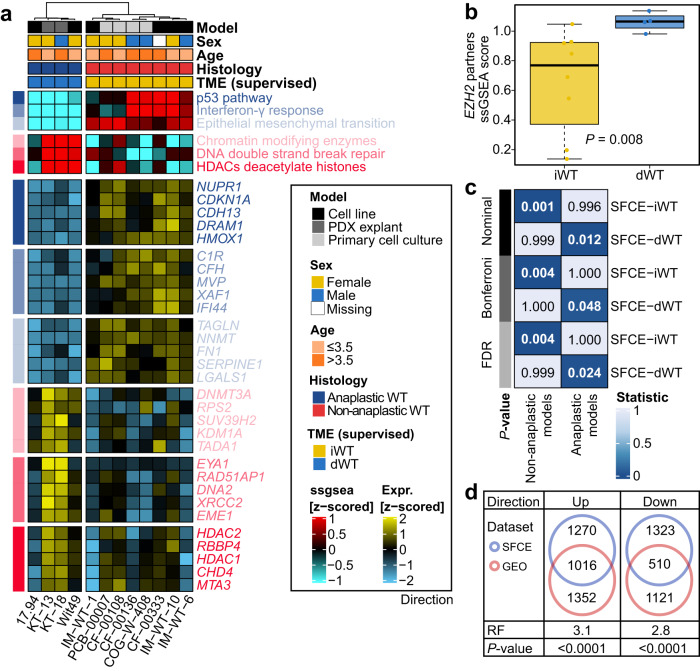
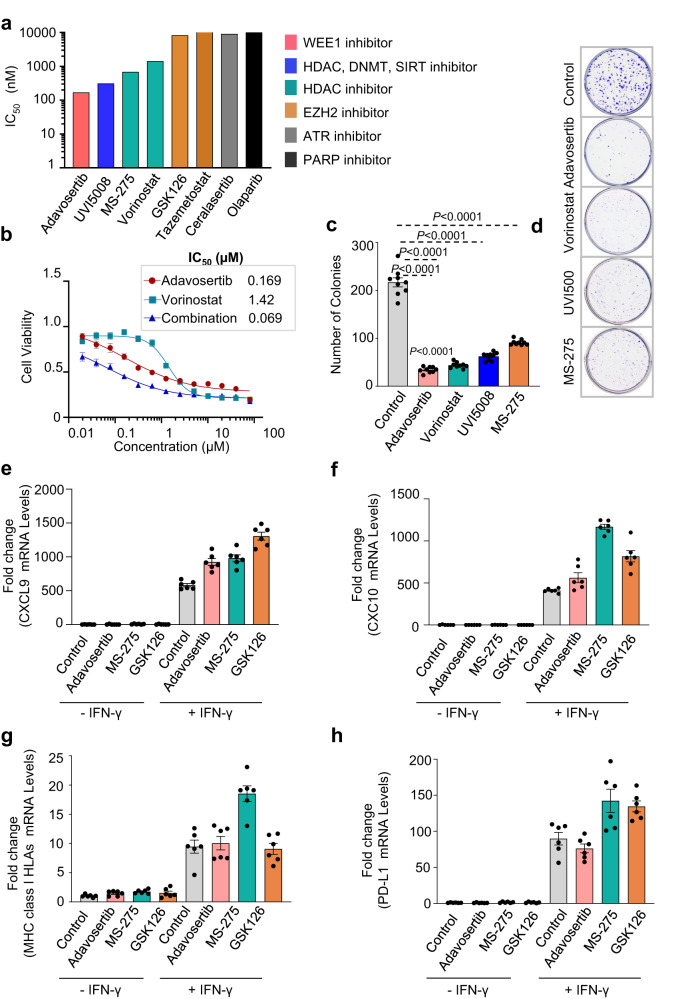
Wilms tumors are highly curable in up to 90% of cases with a combination of surgery and radio-chemotherapy, but treatment-resistant types such as diffuse anaplastic Wilms tumors pose significant therapeutic challenges. Our multi-omics profiling unveils a distinct desert-like diffuse anaplastic Wilms tumor subtype marked by immune/stromal cell depletion, TP53 alterations, and cGAS-STING pathway downregulation, accounting for one-third of all diffuse anaplastic cases. This subtype, also characterized by reduced CD8 and CD3 infiltration and active oncogenic pathways involving histone deacetylase and DNA repair, correlates with poor clinical outcomes. These oncogenic pathways are found to be conserved in anaplastic Wilms tumor cell models. We identify histone deacetylase and/or WEE1 inhibitors as potential therapeutic vulnerabilities in these tumors, which might also restore tumor immunogenicity and potentially enhance the effects of immunotherapy. These insights offer a foundation for predicting outcomes and personalizing treatment strategies for aggressive pediatric Wilms tumors, tailored to individual immunological landscapes.


Conflict of interest statement

The authors declare no competing interests.

Figures

Fig. 1
Fig. 1. Genome-wide landscape of 12 Wilms tumors (WTs) identified by whole-exome sequencing and transcriptome pattern among 95 representative patients with four types of kidney cancers.
a OncoPrint showing the mutation and copy number alteration (CNA) of Wilms tumor-related genes. b Genetic mutual exclusivity or cooccurrence in the SFCE-WT cohort using a one-side Fisher’s exact test (. P < 0.1, * P < 0.05, ** P < 0.01). c OncoPrint showing broad CNA (>25%) and mutations in a selection of frequently mutated genes arranged vertically by functional group. Total mutation burden was annotated at the top panel, and clinicopathological information was annotated in the bottom panel. d Heatmap showing the distinct expression pattern of four kidney cancers by unsupervised consensus clustering with most variable genes. e Two microenvironment subtypes with different immune/stromal infiltrations among 95 patients were identified by unsupervised clustering using curated signatures of 24 microenvironment cell types. Immune enrichment score (IES), stromal enrichment score (SES) and other cohort information were annotated at the top panel. SFCE Société Française du Cancer de l’Enfant, TARGET Therapeutically Applicable Research to Generate Effective Treatments, TCGA The Cancer Genome Atlas, PSL Pitié-Salpêtrière Hospital, DAWT diffuse anaplastic Wilms tumor, FAWT focal anaplastic Wilms tumor, FHWT favorable histology Wilms tumor, ChRCC chromophobe renal cell carcinoma, ccRCC clear cell renal cell carcinoma, PRCC papillary renal cell carcinoma. Source data are provided as a Source Data file.
Fig. 2
Fig. 2. Association between desert-like Wilms tumors (WTs) and TP53 mutation in diffuse anaplastic WT.
a Heatmap showing two tumor microenvironment (TME) phenotypes using curated signatures of 24 microenvironment cell types. Clinicopathological information and genetic alteration were annotated at the top panel. DAWT, diffuse anaplastic Wilms tumor; FAWT, focal anaplastic Wilms tumor; ssGSEA, single-sample gene set enrichment analysis. b Heatmap showing different expression patterns of genes of interest. c Boxplot showing the distribution of bulk immune cell proportions between iWT (n = 5) and dWT (n = 5) using deconvolution approach with two-sided Mann-Whitney test. d Kaplan-Meier curve of recurrence-free survival (RFS) rate with two-sided log-rank test between two TME phenotypes (n = 10). e Kaplan-Meier curve of overall survival (OS) rate with two-sided log-rank test between two TME phenotypes (n = 10). GSEA curves showing significantly f downregulated and g upregulated pathways in dWT versus iWT. Boxplot showing expression of h EZH2, i enrichment score of EZH2 partners, j fraction of genome altered (FGA), k chromatin remodeling regulons activity using two-sided Mann-Whitney test, and estimated drug sensitivity of l HDAC inhibitor and m WEE1 inhibitor between dWT (n = 5) and iWT (n = 5) using one-sided Student’s t-test. For all boxplots, the center line represents the median, box hinges represent first and third quartiles and whiskers represent ± 1.5× interquartile range. Source data are provided as a Source Data file.
Fig. 3
Fig. 3. Prognostic value of tumor-infiltrating lymphocytes in pretreated anaplastic Wilms tumors (WTs).
a Immunohistochemistry images of CD8 and CD3 in different tumor microenvironment (TME) subtypes of WT, including two samples for iWT (PED-18T and PED-14T) and two samples for dWT (PED-09T and PED-21T). Immunostaining using anti-CD3 and anti-CD8 antibodies was performed using standard protocol. Results on these tumors are shown at magnification x200 (scale bar 100 μm), with marked hallmark of anaplasia. Positive CD3 and CD8 lymphocytes were counted on 10 field at high-power fields (HPF, x400). b Kaplan-Meier curves of recurrence-free survival (RFS) (left panel) and overall survival (OS) (right panel) with two-sided log-rank test regarding the count of CD8 in anaplastic WTs (n = 11). c Kaplan-Meier curves of RFS (left panel) and OS (right panel) with two-sided log-rank test regarding the count of CD3 in anaplastic WTs (n = 11). d Scatter plot showing one-sided Spearman’s correlation between the percentage of EZH2 protein expression and count of CD3+ and CD8+ cells. Data are presented as linear model fits, with shaded areas representing the 95% confidence interval. Source data are provided as a Source Data file.
Fig. 4
Fig. 4. Validation using Wilms tumor (WT) cell lines and primary cultures.
a Heatmap showing enrichment scores of oncogenic pathways in 12 WT cells/patient-derived xenograft (PDX)/primary-cultures. b Boxplot showing enrichment score of EZH2 partners between iWT (n = 8) and dWT (n = 4) in GEO-WT dataset using two-sided Mann-Whitney test; the center line represents the median, box hinges represent first and third quartiles and whiskers represent ± 1.5× interquartile range. c Transcriptomic similarity between SFCE-WT subtypes and WT cells/PDX/primary-cultures histology using subclass mapping. Bonferroni and Benjamini-Hochberg correction (false discovery rate, [FDR]) methods were used to adjust P-values. d Venn diagrams with representation factor (RF) revealing significant overlapping of the differentially expressed genes in dWT versus iWT subtypes between SFCE-WT and GEO-WT datasets. Source data are provided as a Source Data file.
Fig. 5
Fig. 5. Testing of various epigenetic drugs.
a Assessment of IC50 for Wilms tumor cell line (17.94) when exposed to different epigenetic drugs at a range of concentration for 72 h. The bar plot demonstrates ranked IC50 (nM) for different inhibitors in the 17.94 cell line (n = 4 independent experiments). b Dose-response effects of drugs combined treatment on the viability of the 17.94 cell line (n = 4 independent experiments). Clonogenic survival assay results depicted as c dot bar plot and d representative images showing the number of colonies in 17.94 cell line treated or untreated with various inhibitors (n = 9 biological samples, each with 3 technical replicates). Data was presented as mean ± standard deviation, and a two-sided Mann-Whitney test was applied to measure the P values between the control cells (DMSO) and the cells treated with various inhibitors. RT-qPCR was preformed to measure the mRNA levels for e, f chemokines (CXCL9 and CXCL10); g MHC class I surface receptor expression and h PD-L1 expression in 17.94 WT cells either stimulated or left unstimulated with IFN-γ in the absence/presence of various inhibitors (n = 2 independent experiments, with triplicates). Data was presented as mean ± standard deviation. Source data are provided as a Source Data file.

References

    1. Spreafico F, et al. Wilms tumour. Nat. Rev. Dis. Prim. 2021;7:75. doi: 10.1038/s41572-021-00308-8. - DOI - PubMed
    1. Coorens THH, et al. Embryonal precursors of Wilms tumor. Science. 2019;366:1247–1251. doi: 10.1126/science.aax1323. - DOI - PMC - PubMed
    1. Vujanic GM, Sandstedt B. The pathology of Wilms’ tumour (nephroblastoma): the International Society of Paediatric Oncology approach. J. Clin. Pathol. 2010;63:102–109. doi: 10.1136/jcp.2009.064600. - DOI - PubMed
    1. Dome JS, et al. Children’s Oncology Group’s 2013 blueprint for research: renal tumors. Pediatr. Blood Cancer. 2013;60:994–1000. doi: 10.1002/pbc.24419. - DOI - PMC - PubMed
    1. Koesters R, et al. Mutational activation of the beta-catenin proto-oncogene is a common event in the development of Wilms’ tumors. Cancer Res. 1999;59:3880–3882. - PubMed

Publication types

Substances

Associated data