. 2023 Nov 30;13(1):21098.
doi: 10.1038/s41598-023-47507-9.

Top-down determinants of the numerosity-time interaction

Affiliations

Top-down determinants of the numerosity-time interaction

Irene Petrizzo et al. Sci Rep. .

Abstract

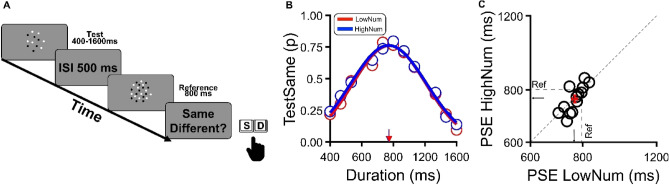
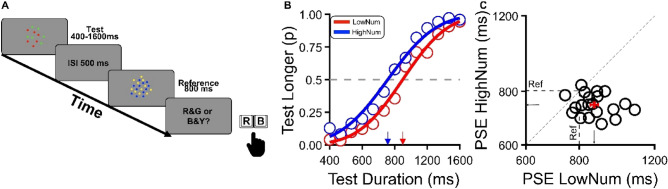
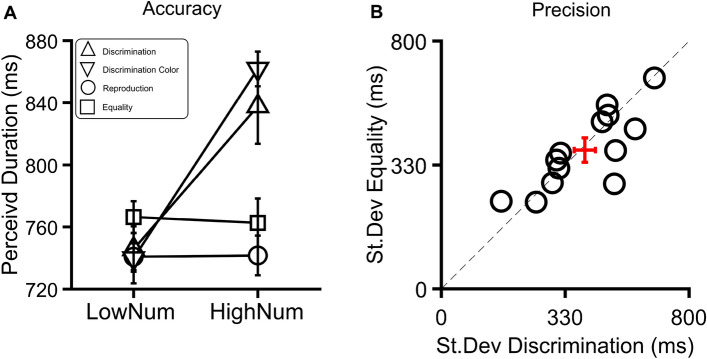
Previous studies have reported that larger visual stimuli are perceived as lasting longer than smaller ones. However, this effect disappears when participants provide a qualitative judgment, by stating whether two stimuli have the "same or different" duration, instead of providing an explicit quantitative judgment (which stimulus lasts longer). Here, we extended these observations to the interaction between the numerosity of visual stimuli, i.e. clouds of dots, and their duration. With "longer vs shorter" responses, participants judged larger numerosities as lasting longer than smaller ones, both when the responses were related to the order (Experiment 1) or color (Experiment 4) of stimuli. In contrast, no similar effect was found with "same vs different" responses (Experiment 2) and in a time motor reproduction task (Experiment 3). The numerosity-time interference in Experiment 1 and Experiment 4 was not due to task difficulty, as sensory precision was equivalent to that of Experiment 2. We conclude that in humans the functional interaction between numerosity and time is not guided, in the main, by a shared bottom-up mechanism of magnitude coding. Rather, high-level and top-down processes involved in decision-making and guided by the use of "magnitude-related" response codes play a crucial role in triggering interference among different magnitude domains.


Conflict of interest statement

The authors declare no competing interests.

Figures

Figure 1
Figure 1
Discrimination task. (A) Participants were asked to indicate which of the two clouds of dots presented sequentially lasted longer. In all trials, the reference stimulus consisted of 24 dots and had a fixed duration of 800 ms. The test stimulus had a variable duration, between 400 to 1600 ms, and its numerosity was either 12 (low numerosity) or 48 (high numerosity), with the two conditions tested in separate sessions. (B) Aggregate data about the proportion of “test longer” responses plotted against test duration. The 50% point of the best-fitting cumulative Gaussian curves indicates the PSEs, that is, the physical duration of the test stimulus to perceptually match a reference of 800 ms. Conditions with different test numerosity are indicated by color: low numerosity (N = 12) in red and high numerosity (N = 48) in blue, respectively. (C) Individual PSEs (open circle) for each participant in the low numerosity condition (x-axis) plotted against the high numerosity condition (y-axis). Dots falling below the bisection line (dashed, diagonal line) indicate a higher PSE in the low numerosity condition compared to the high numerosity condition, and thus a positive covariation between perceived numerosity and duration with more numerous stimuli perceived as lasting longer than their physical duration (and vice-versa). Filled circles indicate the PSE ± S.E.M.
Figure 2
Figure 2
Equality task. (A) Participants were asked to indicate if two stimuli presented sequentially had the same or different duration. All stimuli, test (variable) and reference (fixed) were identical as in Exp 1. (B) Results for the aggregate data. The probability of perceiving the test stimulus as lasting the same as the reference (800 ms) plotted against several test durations for the low numerosity condition (N test = 12) and high numerosity condition (N test = 48) in red and blue, respectively. Continuous colored curves indicate the best-fitting Gaussian to the data. The peaks of the Gaussians (indicated by arrows on the x-axis) indicate the PSEs, that is, the physical test duration needed to perceptually match the reference (800 ms). (C) Individual PSEs (open dots) for each participant in the high numerosity condition plotted against PSEs for the low numerosity condition. The central cross represents the average perceived duration and error bars ± S.E.M.
Figure 3
Figure 3
Reproduction task. (A) Participants were asked to press a key on the keyboard to reproduce the duration of a cloud of dots displayed at the center of the monitor. As in Exp 1 and 2, two different experimental conditions were designed: in the high numerosity condition, the test stimulus comprised 48 dots, while in the low numerosity condition, numerosity was equal to 12 (tested in separate sessions). (B) Results for aggregate data. Reproduced test durations are plotted as a function of physical stimulus duration with the low (N12) numerosity condition and the high numerosity (N48) condition colored in red and blue, respectively. Open symbols represent the average reproduced duration for each tested interval ± S.E.M. (C) Reproduced duration for the 800 ms interval for each participant in the low plotted against the high numerosity condition (open symbols). The central cross indicates the average perceived duration across all participants ± S.E.M.
Figure 4
Figure 4
Discrimination Task for colored stimuli. (A) Duration discrimination with colored stimuli. All procedures were identical to the discrimination task of Exp. 1, but the test and reference stimuli were colored differently: red/green or yellow/blue (color assignment counterbalanced across trials). In each trial, participants were required to indicate the color (not the position in the sequence) of the stimulus that lasted longer. (B) Aggregate data. The proportion of “test longer” responses plotted against test duration (open symbols) and best-fitting cumulative Gaussian functions to the data (solid lines). The 50% point of the psychometric function (indicated by arrows) represents the PSE. The rightward shift of the curve for the low numerosity condition (red) relative to the high numerosity condition (blue) indicates an interference effect of stimulus numerosity on duration estimates, with more numerous stimuli perceived to last longer and vice versa. (C) Individual PSEs in the low numerosity condition (N = 12) plotted against those measured in the high numerosity condition (N = 48). Almost all data points are displaced below the diagonal line, indicating that PSEs in the low numerosity were longer than in the high numerosity condition and thus, that less numerous stimuli were perceived to last shorter and vice versa.
Figure 5
Figure 5
Accuracy and precision. (A) Matching duration estimates across the 4 experiments. Test stimuli estimate to match an 800 ms interval in the time discrimination, equality and reproduction task for the condition in which test numerosity was 12 or 48, low and high numerosity conditions, respectively. While in the equality (same/different) and reproduction task, test duration estimates were found to be independent of the test numerosity (squares and upward triangles) in both discrimination tasks, perceived duration and numerosity covaried to each other with more numerous stimuli perceived to last longer and vice versa (circles and down triangles). (B) Responses precision in the four experiments. We indexed the precision of participants' responses in the discrimination and equality task via the standard deviation of the response distributions. On average, SD values were quite similar for both tasks, those in which perceived numerosity interfered with duration estimates (discrimination task, Experiment 1) as well as those in which no signature of interference was observed (equality task, Experiment 2).

References

    1. Walsh V. A theory of magnitude: Common cortical metrics of time, space and quantity. Trends Cogn. Sci. 2003;7(11):483–488. doi: 10.1016/j.tics.2003.09.002. - DOI - PubMed
    1. Allan LG, Kristofferson AB. Judgments about the duration of brief stimuli. Percept. Psychophys. 1974;15:434–440. doi: 10.3758/BF03199282. - DOI
    1. Gibbon J. Scalar expectancy theory and Weber’s law in animal timing. Psychol. Rev. 1977;84:279–325. doi: 10.1037/0033-295X.84.3.279. - DOI
    1. Killeen PR, Weiss NA. Optimal timing and the Weber function. Psychol. Rev. 1987;94:455–468. doi: 10.1037/0033-295X.94.4.455. - DOI - PubMed
    1. Fias W, Lammertyn J, Reynvoet B, Dupont P, Orban GA. Parietal representation of symbolic and nonsymbolic magnitude. J. Cogn. Neurosci. 2003;15:47–56. doi: 10.1162/089892903321107819. - DOI - PubMed