. 2023 Nov 30;14(1):7882.
doi: 10.1038/s41467-023-43685-2.

CaMKK2 and CHK1 phosphorylate human STN1 in response to replication stress to protect stalled forks from aberrant resection

Affiliations

CaMKK2 and CHK1 phosphorylate human STN1 in response to replication stress to protect stalled forks from aberrant resection

Rishi Kumar Jaiswal et al. Nat Commun. .

Abstract

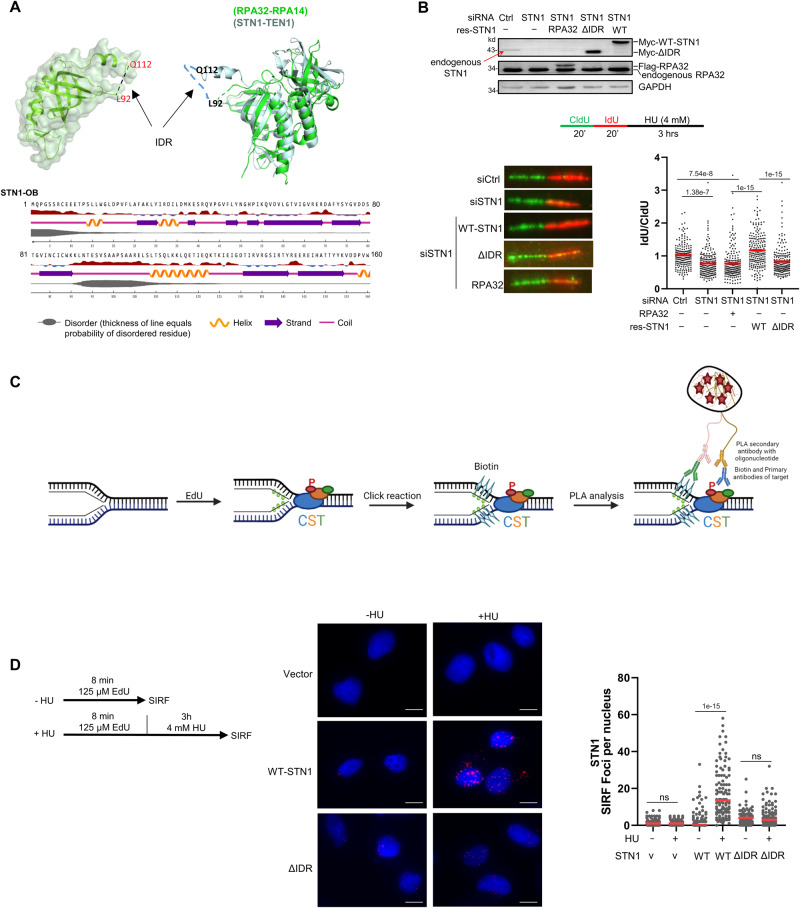
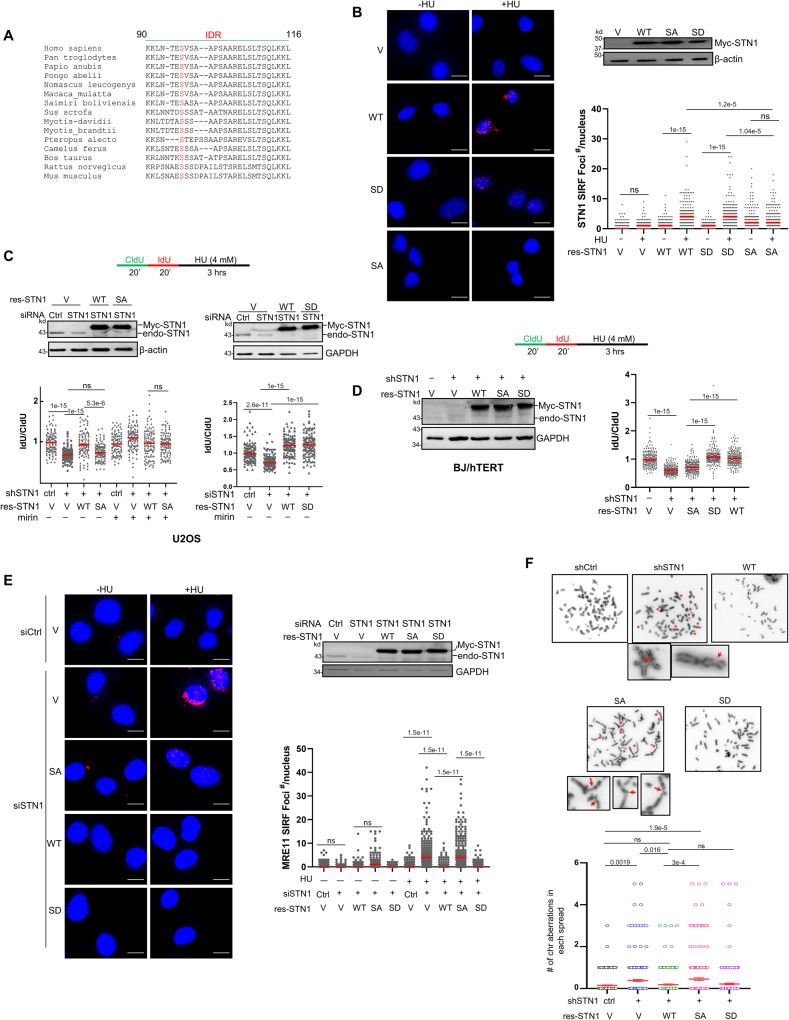
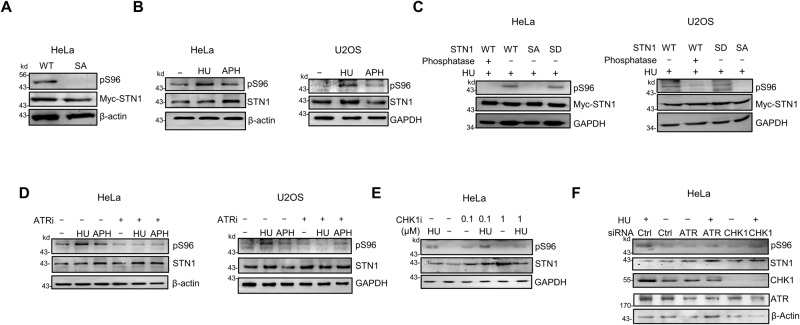
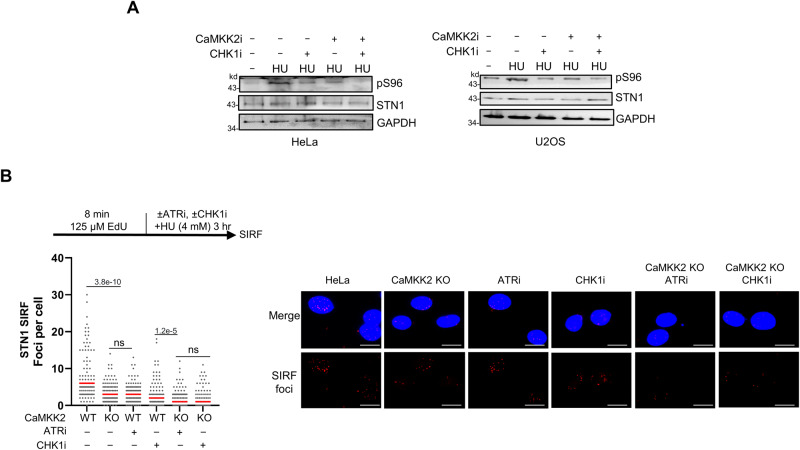
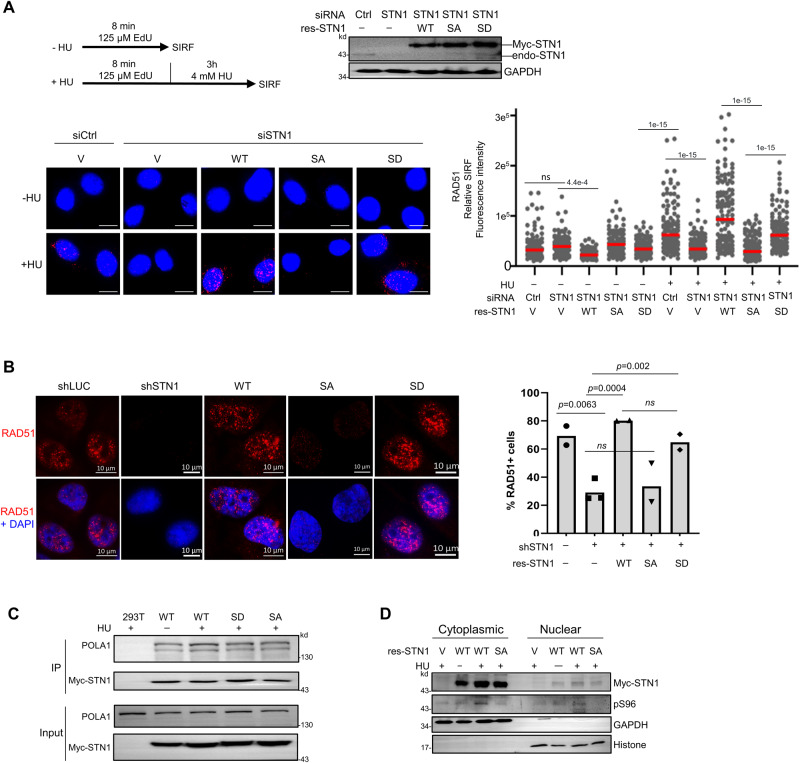
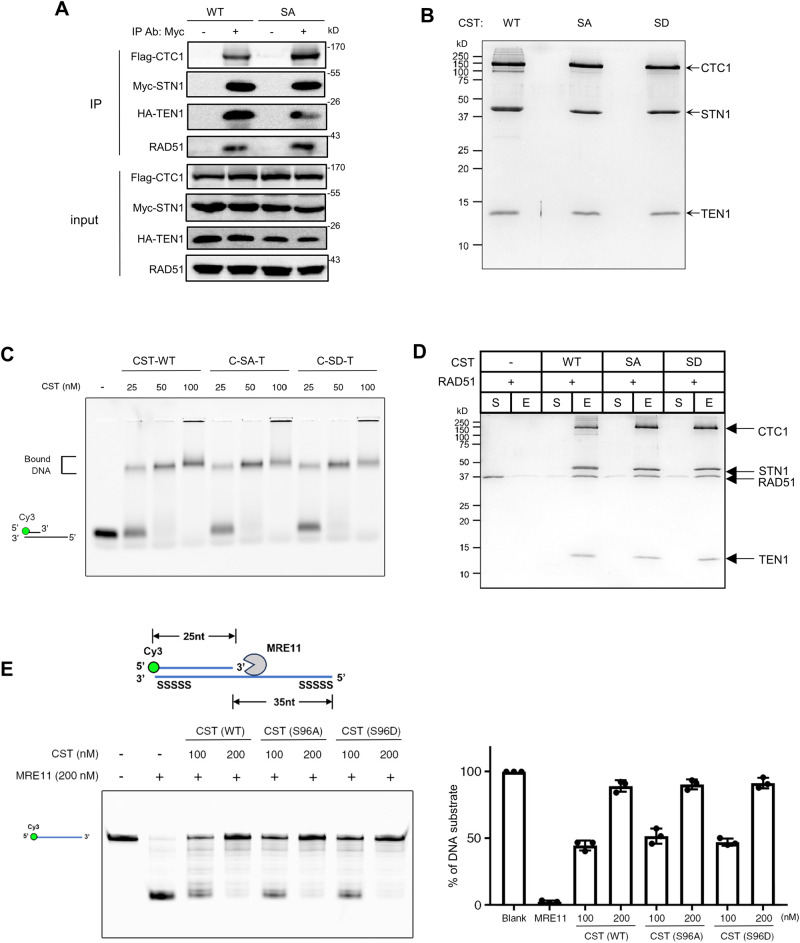
Keeping replication fork stable is essential for safeguarding genome integrity; hence, its protection is highly regulated. The CTC1-STN1-TEN1 (CST) complex protects stalled forks from aberrant MRE11-mediated nascent strand DNA degradation (NSD). However, the activation mechanism for CST at forks is unknown. Here, we report that STN1 is phosphorylated in its intrinsic disordered region. Loss of STN1 phosphorylation reduces the replication stress-induced STN1 localization to stalled forks, elevates NSD, increases MRE11 access to stalled forks, and decreases RAD51 localization at forks, leading to increased genome instability under perturbed DNA replication condition. STN1 is phosphorylated by both the ATR-CHK1 and the calcium-sensing kinase CaMKK2 in response to hydroxyurea/aphidicolin treatment or elevated cytosolic calcium concentration. Cancer-associated STN1 variants impair STN1 phosphorylation, conferring inability of fork protection. Collectively, our study uncovers that CaMKK2 and ATR-CHK1 target STN1 to enable its fork protective function, and suggests an important role of STN1 phosphorylation in cancer development.


Conflict of interest statement

The authors declare no competing interests.

Figures

Fig. 1
Fig. 1. The STN1 IDR in the OB-fold domain protects against NSD under replication stress.
A Top: Structure of the STN1-OB domain (PDB: 4JOI). PyMOL software shows that RPA32-OB/RPA14 and STN1-OB/TEN1 superimpose upon each other except the 26 aa (90–116) IDR present in STN1-OB. Bottom: NetSurfP-2.0 software predicts that STN1 90–116 is an IDR. The STN1-OB domain (aa 1–160) was used in prediction. B DNA fiber analysis of NSD in U2OS cells expressing RPA32, WT-STN1, or STN1-ΔIDR with concurrent knockdown of endogenous STN1. Flag-RPA32, Myc-WT-STN1, and Myc-STN1-ΔIDR were stably expressed by retroviral transduction. Three independent experiments were performed and the result from one experiment is shown. P: One-way ANOVA. The mean values are shown in red lines. n = 200 fibers were measured per sample in each experiment. Western blot shows STN1 knockdown and the expression of Flag-RPA32, Myc-WT-STN1, and Myc-STN1-ΔIDR. The expression level of endogenous STN1 is low (pointed by a red arrow). Note that Myc-STN1-ΔIDR migrates at almost the same position as the endogenous STN1. C Scheme of SIRF assay. Nascent strand DNA was pulse labeled with EdU to incorporate EdU at forks. Click chemistry was performed to covalently link biotin to EdU. Following incubation with primary antibodies (anti-biotin and anti-pS96) and secondary antibodies, PLA amplification was performed to visualize the proximity of phosphorylated STN1 to EdU-labeled forks. The scheme was created with BioRender.com. D SIRF detection of WT-STN1 and ΔIDR at normal and stalled forks. Myc-tagged WT-STN1 and ΔIDR were stably expressed in U2OS cells with retroviral transduction. Cells were pulse labeled with EdU for 8 min, then treated with or without HU (4 mM) for 3 h. Scale bars: 10 µm. Images with the red channel are provided in Supplementary Fig. 8. Two independent experiments were performed and the result from one experiment is shown. P: One-way ANOVA. Red line: mean. n = ~100 cells were measured per sample in each experiment. Source data are provided in the Source Data file.
Fig. 2
Fig. 2. S96 in STN1 IDR is essential for antagonizing MRE11-mediated degradation of nascent strand DNA and for protecting genome stability.
A Sequence alignment showing that S96 is conserved in higher eukaryotes. S96 is marked in red. B SIRF detection of S96A, S96D, and WT-STN1 at normal and stalled forks. Myc-tagged WT, S96A, S96D were stably expressed with retroviral transduction in U2OS cells treated with 4 mM HU for 3 h. Scale bars: 10 µm. Images with the red channel are provided in (Supplementary Fig. 9). Three independent experiments were performed and the result from one experiment is shown. P: One-way ANOVA. Red line: mean. n = 150 cells were analyzed per sample in each experiment. Western blot shows the expression of S96A, S96D, and WT-STN1. C DNA fiber analysis detecting NSD in the same U2OS cells described in (B). Three independent experiments were performed and the result from one experiment is shown. P: One-way ANOVA. Red line: mean. n = 100 fibers were measured per sample in each experiment. D DNA fiber analysis of NSD in BJ/hTERT cells co-expressing shSTN1 and RNAi-resistant S96A, S96D, and WT-STN1, which were expressed using retroviral transduction. Two independent experiments were performed and the result from one experiment is shown. P: One-way ANOVA. Red line: mean. n = 200 fibers were measured per sample in each experiment. E SIRF detection of MRE11 at normal and stalled replication forks in the same U2OS cells described in (B). Cells were pulse labeled with EdU for 8 min and treated with or without 4 mM HU for 3 h. Scale bars: 10 µm. Images with the red channel are provided in Supplementary Fig. 10. Three independent experiments were performed. P: One-way ANOVA. Red line: mean. Western blot showing expression of RNAi-resistant S96A, S96D, and WT-STN1. n = ~200 cells were analyzed per sample in each experiment. F Images showing chromosome aberrations in STN1 knockdown HeLa cells with ectopic expression of S96A, S96D, and WT-STN1. Cells were treated with HU (2 mM, 3 h). Aberrations are labeled with red stars. Examples of aberrant chromosomes are amplified and shown in inserts, with red arrows pointing to aberrations. Two independent experiments were performed, and the result from one experiment is shown. P: One-way ANOVA. Source data are provided in the Source Data file.
Fig. 3
Fig. 3. S96 phosphorylation is stimulated by replication stress and ATR-CHK1 phosphorylates S96.
A Western blot was performed to show the specificity of the anti-pS96 antibody. Whole cell lysate of HeLa cells transiently expressing Myc-WT-STN1 or Myc-S96A were used on SDS-PAGE. Anti-pS96 antibody was used to detect S96 phosphorylation of Myc-STN1. Representative blots from three independent experiments are shown. Full blots are provided in Supplementary Fig. S6. B Western blot of pS96 of endogenous STN1 protein in HeLa and U2OS cells after the HU (10 mM, 3 h) or APH (5 μg/ml, 3 h). 10 mM HU was used in our initial experiments. In later experiments we used 4 mM HU and observed similar pS96 stimulation (see C; Figs. 4 and 7 below). Representative blots from three independent experiments are shown. C Western blot of pS96 in HeLa and U2OS cells after the HU treatment (4 mM, 3 h). Whole cell lysates were treated with 100 units of lambda phosphatase for 30 min at 30 °C prior to loading. Representative blots from three independent experiments are shown. D Western blot of pS96 in HeLa and U2OS cells after pretreatment with ATRi (VE821, 20 μM, 3 h) followed by 10 mM HU for 3 h or 5 μg/ml APH for 3 h treatment. Representative blots from three independent experiments are shown. E Western blot showing effects of CHK1i on S96 phosphorylation under the replication stress in HeLa cells. HeLa cells were pretreated with 0.1 μM or 1 μM Chk1i (Prexasertib) for 1 h followed by 10 mM HU for 3 h or 5 μg/ml aphidicolin for 3 h. Representative blots from three independent experiments are shown. F Western blot of pS96 after ATR and CHK1 knockdown. Fourty eight hours after ATR or CHK1 was depleted by siRNA, cells were treated with 10 mM HU for 3 h, and western blot was performed. Representative blots from three independent experiments are shown. Source data are provided in the Source Data file.
Fig. 4
Fig. 4. CaMKK2 phosphorylates STN1 S96 in response to Ca2+ concentration increase and HU treatment.
A GCaMP6s reporter assay showing the increase of intracellular Ca2+ concentration in U2OS cells after treatment with HU (4 mM) or APH (5 μg/ml) for 3 h. Scale bar: 10 µm. Quantification of the images was performed using Image J. P: Two-tailed unpaired t-test. Red line: mean. Two biologically independent experiments were performed and n = ~100 cells were analyzed per sample in each experiment. B Western blot of pS96 after Ca2+ ionophore (A23187, 2 μM, 1 h) or thapsigargin (1 μM, 1 h) treatment in both HeLa and U2OS cells. Images shown in upper panels were cropped from the same blot. For the phosphatase treatment, cell lysates were treated with 100 units of lambda phosphatase for 30 min at 30 °C. Representative blots from three independent experiments are shown. C Western blot of pS96 in CaMKK2 KO cells after HU treatment. Two CaMKK2 KO HeLa clones were treated with HU (4 mM, 3 h) and pS96 was detected. Representative blots from two independent experiments are shown. D Western blot of pS96 in CaMKK2 KO cells after A23187 treatment. Two CaMKK2 KO HeLa clones were treated with A23187 (2 μM, 1 h). Representative blots from two independent experiments are shown. E CaMKK2 inhibition diminishes pS96. HeLa cells were pretreated with 25 μM CaMKK2i (STO-609) for 30 min followed by 10 mM HU treatment for 3 h or 2 μM A23187 treatment for 1 h. Western blot was performed using whole cell lysate. Representative blots from two independent experiments are shown. F Effect of AMPKα KO on S96 phosphorylation. Two AMPKα KO clones were treated with 4 mM HU for 3 h and pS96 was detected. Representative blots from two independent experiments are shown. G SDS-PAGE showing purified His6-SUMO-STN1, GST-CaMKK2 and CHK1 proteins used in the in vitro kinase assay. Representative blots from three independent experiments are shown. H In vitro kinase assay. His6-SUMO-STN1 was incubated with CaMKK2 or CHK1 in the kinase reaction buffer with or without CaMKK2i or CHK1i. STN1 phosphorylation was detected with the anti-pS96 antibody after SDS-PAGE. Three independent experiments were performed and results from one experiment was shown. Representative blots from three independent experiments are shown. Source data are provided in the Source Data file.
Fig. 5
Fig. 5. ATR-CHK1 and CaMKK2 phosphorylate STN1 independently.
A Western blot of pS96 in HeLa and U2OS cells after co-inhibition of CHK1i (prexasertib, 1 μM, 1 h), and CaMKK2i (STO-609, 25 μM, 30 min), followed by 4 mM HU for 3 h. Representative blots from two independent experiments are shown. B SIRF detection of STN1 after co-inhibition of CHK1i (prexasertib, 1 μM, 1 h), CaMKK2i (STO-609, 25 μM, 30 min), and ATRi (VE821, 20 μM, 3 h). Cells were pulse labeled with EdU for 8 min, followed by 4 mM HU for 3 h. Scale bars: 10 μm. Representative images from two independent experiments are shown. P: One-way ANOVA. Red line: mean. n = ~100 cells were analyzed per sample in each experiment. Source data are provided in the Source Data file.
Fig. 6
Fig. 6. S96A mutation abolishes RAD51 localization at forks in response to replication stress, but does not impact STN1 interaction with POLα or its nuclear localization.
A RAD51 SIRF at normal and stalled replication forks in U2OS cells expressing RNAi-resistant S96A, S96D, and WT-STN1. Endogenous STN1 was concurrently depleted with siRNA. Scale bars: 10 µm. Images with the red channel are provided in (Supplementary Fig. 11). Representative images from two independent experiments are shown. P: One-way ANOVA. Red line: mean. Western blot shows the depletion of endogenous STN1 and the expression of S96A, S96D, and WT-STN1. n = ~150 cells were analyzed per sample in each experiment. B RAD51 IF in HeLa cells stably expressing RNAi-resistant WT, S96A, and S96D. Endogenous STN1 was concurrently depleted with siRNA. Cells were treated with 2 mM HU for 3 h and fixed with paraformaldehyde for IF. Scale bars: 10 µm. The means from two independent experiments are plotted. Error bars: SEM. P: one-way ANOVA with post hoc Tukey. C STN1-POLα co-IP. HEK293T transfected with Myc-WT-STN1, Myc-S96D, and Myc-S96A were treated with 4 mM HU for 3 h. Myc beads was used for IP. Two independent experiments were performed. D Cytoplasmic and nuclear fractionation of WT-STN1 and S96A from U2OS stably expressing Myc-STN1 or Myc-S96A. Cells were treated with or without 4 mM HU treatment for 3 h. Two independent experiments were performed. Source data are provided in the Source Data file.
Fig. 7
Fig. 7. In vitro, S96 phosphorylation has no impact on CST complex formation, CST interaction with RAD51, binding to DNA, or inhibiting MRE11 degradation.
A Co-IP of S96A with CTC1, TEN1, and RAD51 in HEK293T cells co-transfected with Flag-CTC1, HA-TEN1, and MyC-WT-STN1 or Myc-S96A. Cells were treated with 2 mM HU for 3 h. Myc antibody was used for IP. Three independent experiments were performed to ensure reproducibillity. B Purified wild-type CST (WT), C-S96A-T (SA), and C-S96D-T (SD) complexes were resolved in 15% SDS-PAGE and stained with Coomassie blue. Representative result from three independent experiments is shown. C The DNA-binding ability of the CST complex (WT, SA, and SD) was determined by EMSA. The 5′ Cy3- labeled substrates were incubated with the indicated concentrations of CST. Samples were analyzed with 0.8 % agarose gel. Representative result from three independent experiments is shown. D Effects of S96A and S96D on interaction with RAD51 in vitro. Flag-CTC1-STN1-TEN1-His6 (CST-WT, SA, and SD) was incubated with RAD51, followed by incubation with His-Tag Dynabeads to capture the CST and associated proteins using a magnetic bead separator. The supernatant (S) and eluate (E) were analyzed by 15% SDS-PAGE with Coomassie blue staining. RAD51 alone is shown as a control. Three independent experiments were performed and the result from one experiment is shown. E Effects of S96A and S96D on protecting DNA from MRE11 degradation in vitro. The scheme shows the nuclease activity of MRE11 in degrading 5′ Cy3-labeled substrates (25 nt + 60 nt ssDNA with phosphorothioate bonds on both ends). 5′ Cy3-labeled substrates were pre-incubated with indicated concentrations of CST (CST-WT, SA or SD), then the reactions were completed by adding MRE11. Samples were resolved in 27% denatured polyacrylamide gel. Images show the representative results of 3 independent experiments. The graph represents mean ± S.D (n = 3). Source data are provided in the Source Data file.
Fig. 8
Fig. 8. Cancer-associated STN1 mutations impair STN1 phosphorylation and fork stability.
A Western blot of S96 phosphorylation in HeLa cells expressing RNAi-resistant Myc-WT-STN1, Myc-S96V, Myc-S96A, Myc-E95G with concurrent depletion of endogenous STN1. Cells were treated with 4 mM HU for 3 h or 2 μM A23187 for 1 h. Images are cropped from the same blot. Representative blots from three independent experiments are shown. B Western blot of S96 phosphorylation in HeLa and U2OS cells expressing Myc-WT-STN1, Myc-E95G, or Myc-E95G/S96D. Cells were treated with 4 mM HU for 3 h. Representative blots from three independent experiments are shown. C DNA fiber assay in HeLa cells expressing RNAi-resistant WT-STN1, S96A, S96V, and E95G with concurrent depletion of endogenous STN1. Two independent experiments were performed and results from one experiment are shown. P: One-way ANOVA. Red line: mean. n = 200 fibers were measured per sample in each experiment. D Model. Fork stalling leads to the increase of intracellular calcium concentration and accumulation of ssDNA, activating the CaMKK2 and ATR pathways, respectively. Both CaMKK2 and ATR-CHK1 phosphorylate STN1 to promote CST access to stalled forks, which facilitates RAD51 recruitment to stalled forks and blocks MRE11-mediated NSD. Source data are provided in the Source Data file. The model was created with BioRender.com.

References

    1. Saxena S, Zou L. Hallmarks of DNA replication stress. Mol. Cell. 2022;82:2298–2314. doi: 10.1016/j.molcel.2022.05.004. - DOI - PMC - PubMed
    1. Macheret, M. & Halazonetis, T. D. DNA Replication Stress as a Hallmark of Cancer. Annual Review of Pathology: Mechanisms of Disease10, 425–448 (2015). - PubMed
    1. Zeman MK, Cimprich KA. Causes and consequences of replication stress. Nat. Cell Biol. 2014;16:2–9. doi: 10.1038/ncb2897. - DOI - PMC - PubMed
    1. Macheret M, Halazonetis TD. DNA replication stress as a hallmark of cancer. Annu. Rev. Pathol. Mech. Dis. 2015;10:425–448. doi: 10.1146/annurev-pathol-012414-040424. - DOI - PubMed
    1. Flynn RL, Zou L. ATR: a master conductor of cellular responses to DNA replication stress. Trends Biochem. Sci. 2011;36:133–140. doi: 10.1016/j.tibs.2010.09.005. - DOI - PMC - PubMed

Publication types