

AUCReshaping: improved sensitivity at high-specificity
- PMID: 38036602
- PMCID: PMC10689839
- DOI: 10.1038/s41598-023-48482-x
AUCReshaping: improved sensitivity at high-specificity
Abstract
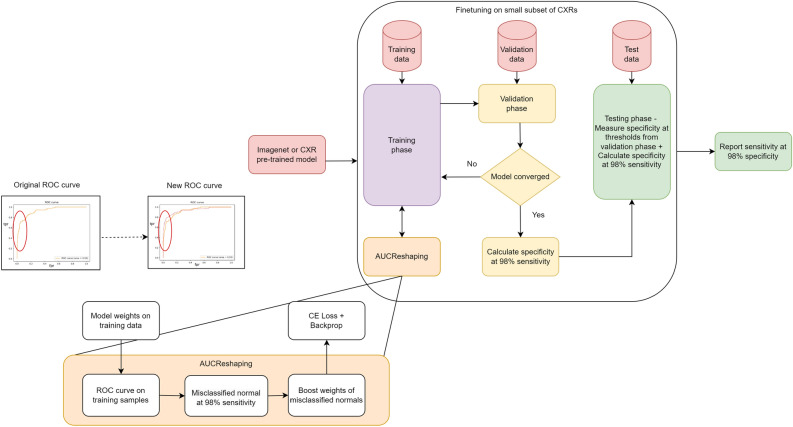
The evaluation of deep-learning (DL) systems typically relies on the Area under the Receiver-Operating-Curve (AU-ROC) as a performance metric. However, AU-ROC, in its holistic form, does not sufficiently consider performance within specific ranges of sensitivity and specificity, which are critical for the intended operational context of the system. Consequently, two systems with identical AU-ROC values can exhibit significantly divergent real-world performance. This issue is particularly pronounced in the context of anomaly detection tasks, a commonly employed application of DL systems across various research domains, including medical imaging, industrial automation, manufacturing, cyber security, fraud detection, and drug research, among others. The challenge arises from the heavy class imbalance in training datasets, with the abnormality class often incurring a considerably higher misclassification cost compared to the normal class. Traditional DL systems address this by adjusting the weighting of the cost function or optimizing for specific points along the ROC curve. While these approaches yield reasonable results in many cases, they do not actively seek to maximize performance for the desired operating point. In this study, we introduce a novel technique known as AUCReshaping, designed to reshape the ROC curve exclusively within the specified sensitivity and specificity range, by optimizing sensitivity at a predetermined specificity level. This reshaping is achieved through an adaptive and iterative boosting mechanism that allows the network to focus on pertinent samples during the learning process. We primarily investigated the impact of AUCReshaping in the context of abnormality detection tasks, specifically in Chest X-Ray (CXR) analysis, followed by breast mammogram and credit card fraud detection tasks. The results reveal a substantial improvement, ranging from 2 to 40%, in sensitivity at high-specificity levels for binary classification tasks.
© 2023. The Author(s).
Conflict of interest statement
The authors declare no competing interests.
Figures


References
-
- Hassan, M. U., Rehmani, M. H. & Chen, J. Anomaly detection in blockchain networks: A comprehensive survey. In IEEE Communications Surveys & Tutorials (2022).
-
- Tang, Y.-X., Tang, Y.-B., Han, M., Xiao, J. & Summers, R. M. Abnormal chest x-ray identification with generative adversarial one-class classifier. In 2019 IEEE 16th International Symposium on Biomedical Imaging (ISBI 2019), 1358–1361 (IEEE, 2019).
-
- Shvetsova N, Bakker B, Fedulova I, Schulz H, Dylov DV. Anomaly detection in medical imaging with deep perceptual autoencoders. IEEE Access. 2021;9:118571–118583. doi: 10.1109/ACCESS.2021.3107163. - DOI
-
- Bozorgtabar, B., Mahapatra, D., Vray, G. & Thiran, J.-P. Salad: Self-supervised aggregation learning for anomaly detection on x-rays. In International Conference on Medical Image Computing and Computer-Assisted Intervention, 468–478 (Springer, 2020).
-
- Bogdoll, D., Nitsche, M. & Zöllner, J. M. Anomaly detection in autonomous driving: A survey. In Proceedings of the IEEE/CVF Conference on Computer Vision and Pattern Recognition, 4488–4499 (2022).
MeSH terms
LinkOut - more resources
Full Text Sources
Medical
