. 2023 Dec;7(12):2080-2091.
doi: 10.1038/s41559-023-02234-2. Epub 2023 Nov 30.

The evolution of short- and long-range weapons for bacterial competition

Affiliations

The evolution of short- and long-range weapons for bacterial competition

Sean C Booth et al. Nat Ecol Evol. 2023 Dec.

Abstract

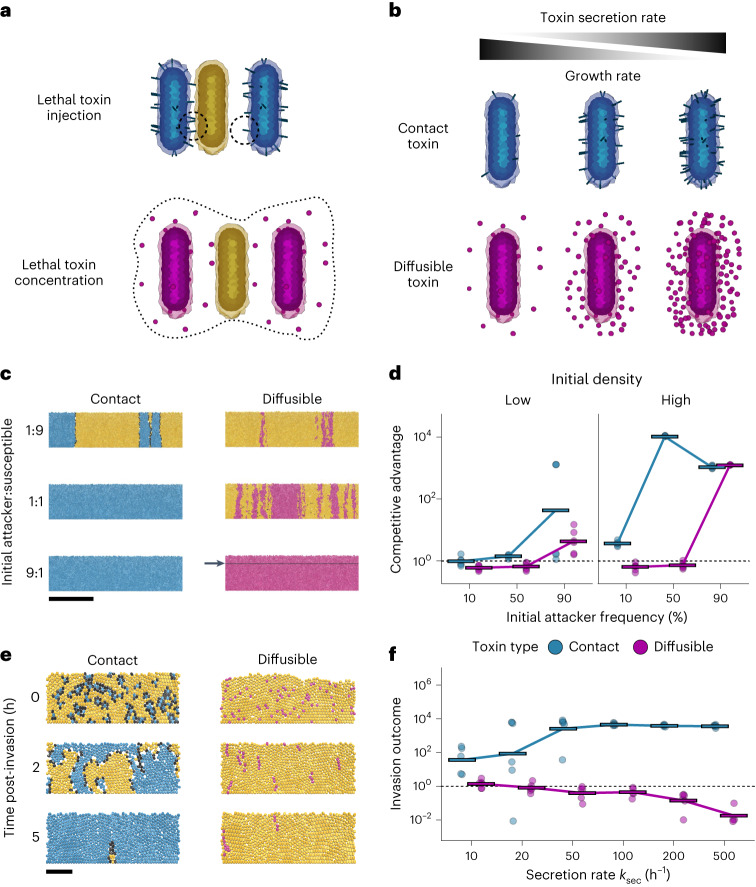
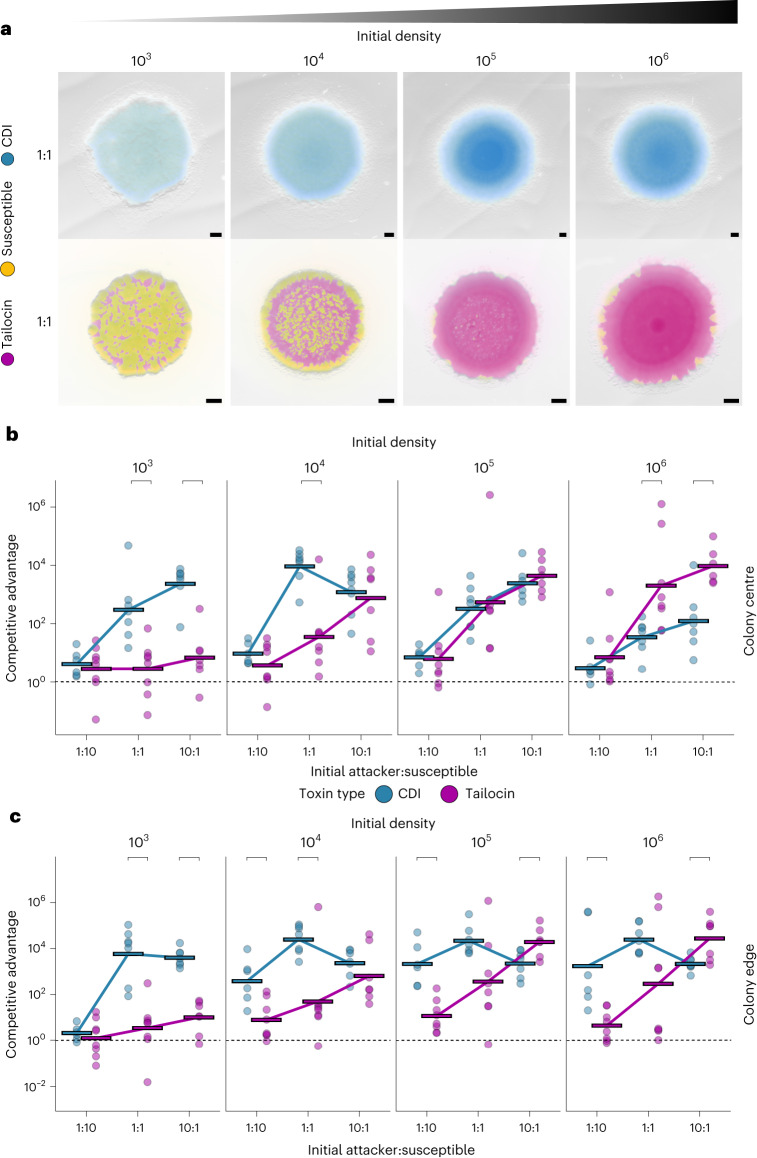
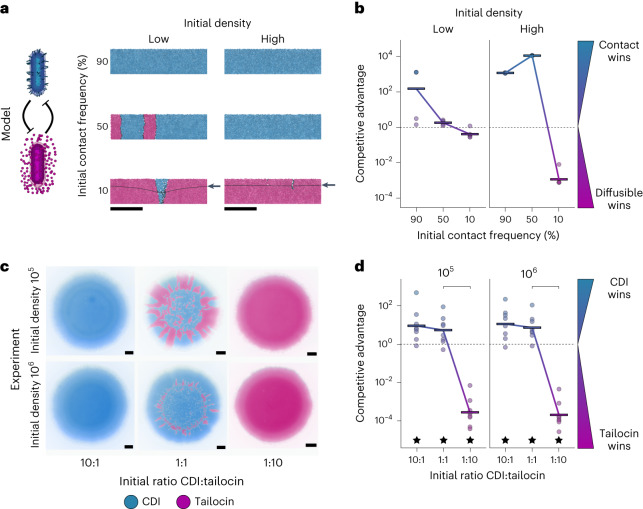
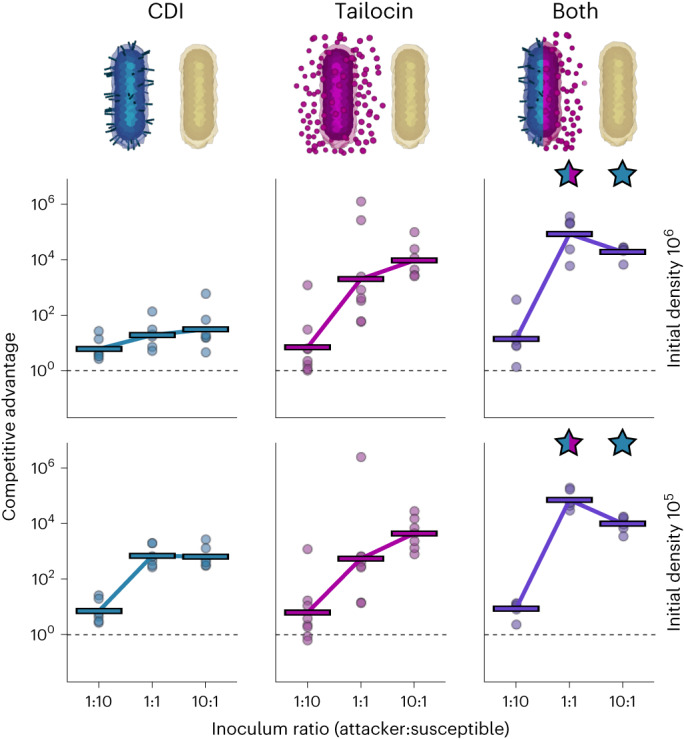
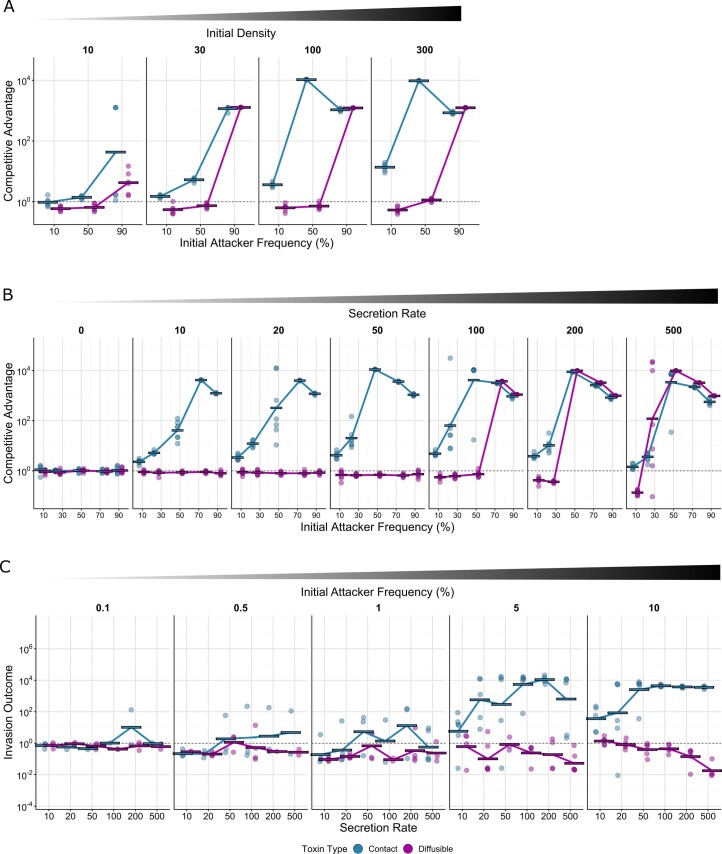
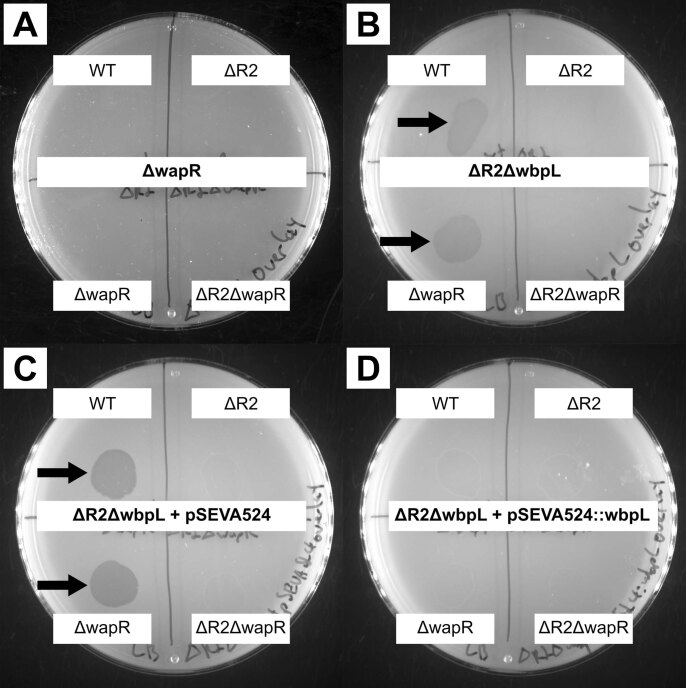
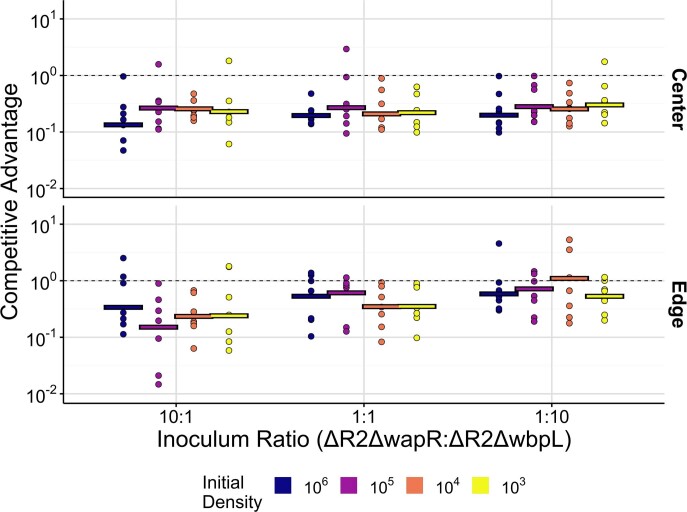
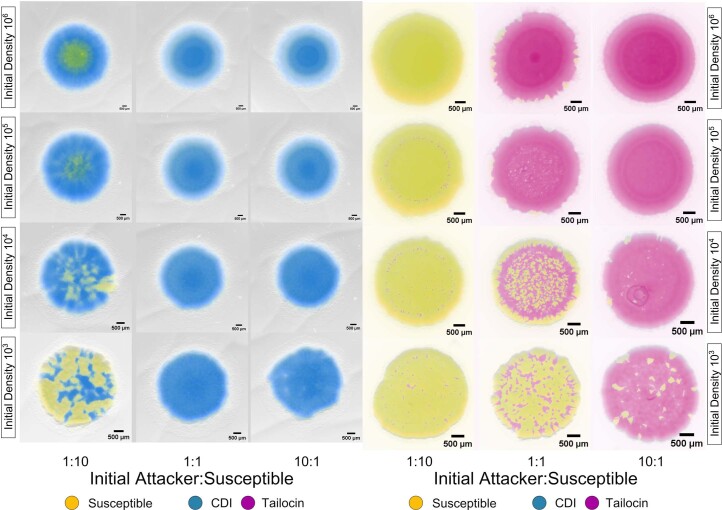
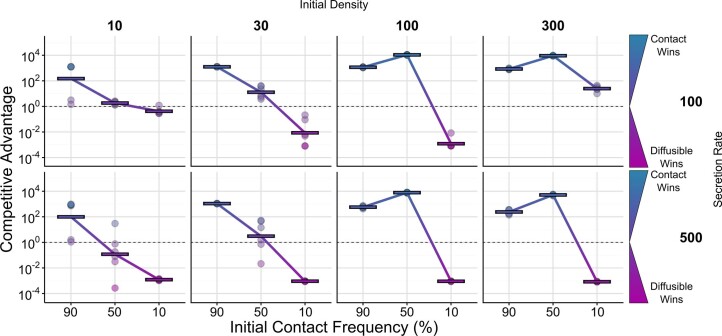
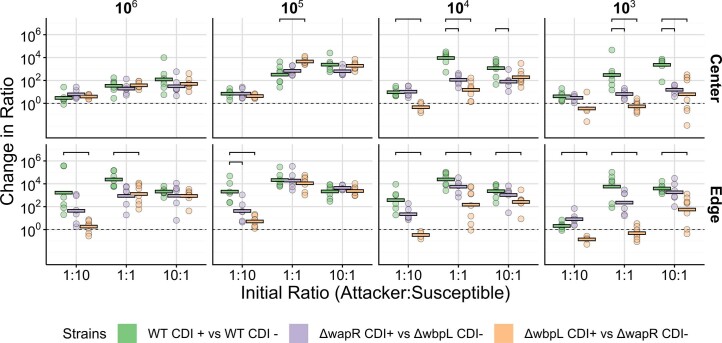
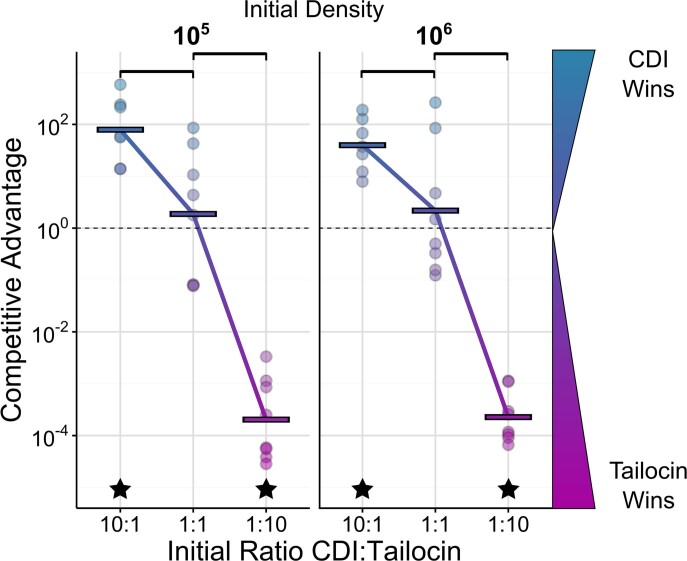
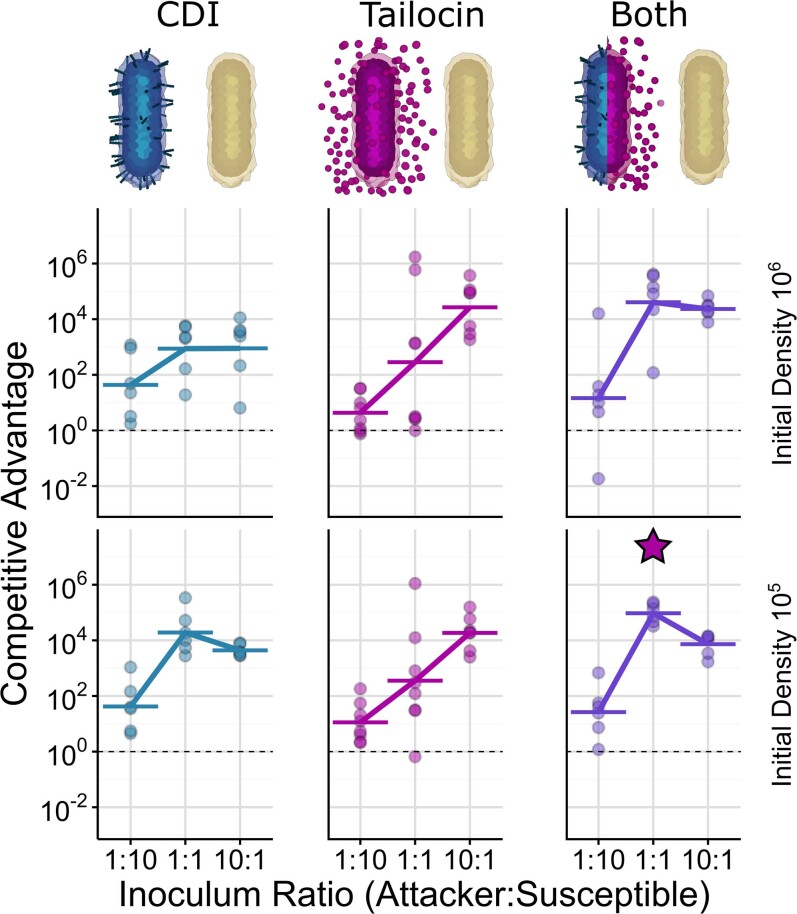
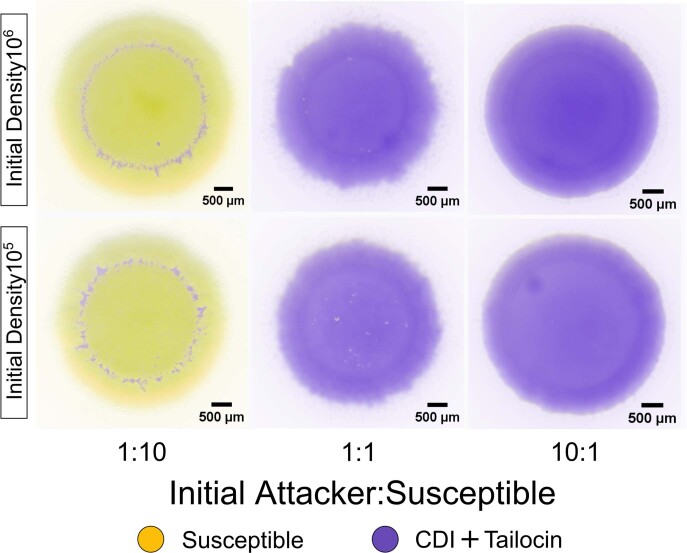
Bacteria possess a diverse range of mechanisms for inhibiting competitors, including bacteriocins, tailocins, type VI secretion systems and contact-dependent inhibition (CDI). Why bacteria have evolved such a wide array of weapon systems remains a mystery. Here we develop an agent-based model to compare short-range weapons that require cell-cell contact, with long-range weapons that rely on diffusion. Our model predicts that contact weapons are useful when an attacking strain is outnumbered, facilitating invasion and establishment. By contrast, ranged weapons tend to be effective only when attackers are abundant. We test our predictions with the opportunistic pathogen Pseudomonas aeruginosa, which naturally carries multiple weapons, including CDI and diffusing tailocins. As predicted, short-range CDI can function at low and high frequencies, while long-range tailocins require high frequency and cell density to function effectively. Head-to-head competition experiments with the two weapon types further support our predictions: a tailocin attacker defeats CDI only when it is numerically dominant, but then we find it can be devastating. Finally, we show that the two weapons work well together when one strain employs both. We conclude that short- and long-range weapons serve different functions and allow bacteria to fight both as individuals and as a group.


Conflict of interest statement

The authors declare no competing interests.

Figures

Fig. 1
Fig. 1. Agent-based modelling predicts that contact weapons are more robust to changes in frequency, density and secretion rate.
a, Contact toxins (top): producing cells can deliver toxins to neighbouring cells. If a susceptible cell (yellow) is within range, the toxin is injected (left dashed circle) and the susceptible cell dies; otherwise the toxin is wasted (right dashed circle). Diffusing toxins (bottom): when the local concentration of a diffusible toxin exceeds a threshold (within dashed line), susceptible cells die. b, Cells secrete toxins, incurring a growth-rate penalty proportional to the amount of toxin being secreted (secretion rate). c, Snapshots of competition outcomes for attackers with contact-dependent toxins (blue cells, left column) or diffusible toxins (magenta cells, right column). Unarmed susceptibles (yellow cells) die upon lethal toxin exposure (black cells). The contact weapon performs better at lower frequencies than the diffusible weapon. Snapshots show cropped (150 µm) sections of the 300-µm-wide, 2D simulation domain; below the black line (arrow) represents the lethal concentration for the diffusible toxin. Scale bar, 50 µm; inoculum, 100 cells. d, Quantification of competition outcomes for two initial cells densities: ‘low’ (10 cells inoculum) and ‘high’ (100 cells inoculum). Competitive advantage assesses the fold change in the attacker strain compared with its competitor from the beginning to end of the simulation (Methods). Horizontal bars indicate the mean from multiple simulations (n = 6). e, Snapshots of competition outcomes for invasion scenario (invader frequency: 10%), with contact-dependent and diffusible-toxin-armed attackers coloured as in c. Scale bar, 10 µm. Successive timepoints (rows) show fates of initially rare attackers following random inoculation into confluent biofilms of susceptible cells. f, Quantification of competition outcomes for invasions (invader frequency: 10%) using the same competitive advantage metric as in d, quantified as a function of toxin secretion rate. Horizontal bars indicate the mean from independent simulations (n = 6). Source data
Fig. 2
Fig. 2. Experiments show the importance of high density and high frequency for long-range weapons.
Colony competitions with P. aeruginosa PAO1 between wild-type and mutants susceptible to either CDI (short range) or pyocin R2 (tailocin, long range) inoculated from different densities (mean inoculum density 1.9 × 10³, 104, 105, 106 CFU µl−1). a, Representative microscopy images from equal-frequency (1:1) competitions after 48 h of growth. All strains express constitutive fluorescent protein genes and are false-coloured either blue (CDI attacker, top), magenta (tailocin attacker, bottom) or yellow (susceptible, top and bottom). Scale bar, 500 µm. b, Quantification of competition outcomes at the colony centre. One-way ANOVA showed that initial density and ratio significantly affected both weapons in the centre (CDI, density: P = 1.45 × 10⁻⁶, n = 80; CDI, ratio: P = 1.45 × 10⁻⁶; tailocin, density: P = 3.68 × 10⁻⁸, n = 91; tailocin, ratio: P = 5.01 × 10⁻¹⁰). c, Quantification of colony competition outcomes at the colony edge. One-way ANOVA showed that initial density and ratio significantly affected both weapons at the edge (CDI, density: P = 6.54 × 10⁴, n = 80; CDI, ratio: P = 2.29 × 10¹⁰; tailocin, density: P = 1.89 × 10⁶, n = 92; tailocin, ratio: P = 1.43 × 10⁹). For b and c, competitions were assessed via counts of CFUs. Competitive advantage assesses the fold change in the attacker strain compared with its competitor from the beginning to end of the competition. The tailocin attacker advantage in b and c has been adjusted for a disadvantage in the background genotype of the attacking strain (see Methods and Extended Data Figs. 3 and 4). Horizontal bars indicate the mean of independent biological replicates (n ≥ 6; see Supplementary Table 5 for exact values of n). Top brackets indicate a significant difference between the weapons (two-sided Welch’s t-test, P < 0.05, Benjamini–Hochberg correction for multiple testing; see Supplementary Table 5 for exact P values).
Fig. 3
Fig. 3. Head-to-head competitions between short- and long-range weapon users.
a, Modelling: snapshots of competition outcomes for cells armed with contact-dependent toxins, but susceptible to diffusible toxins (blue cells) or cells armed with diffusible toxins, but susceptible to contact-dependent toxins (magenta cells). Both cells die upon lethal toxin exposure (black cells). Snapshots show cropped (150 µm) sections of the 300-µm-wide, 2D simulation domain; below the black lines (arrows) represents the lethal concentration for the diffusible toxin. Scale bars, 50 µm; initial densities were ‘low’ (10 cells) or ‘high’ (100 cells). b, Modelling: quantification of competition outcomes for two initial cell densities: ‘low’ (10 cells) and ‘high’ (100 cells). Competitive advantage assesses the fold change in the attacker strain compared with its competitor from the beginning to end of the simulation (Methods). Horizontal bars indicate the mean from independent simulations (n = 6). c, Experiments: representative microscopy images of competitions between mutually susceptible CDI and tailocin-producing cells after 48 h inoculated from different densities (mean inoculum density 2.3 × 10⁵, 106 CFU µl−1). All strains are expressing constitutive fluorescent proteins and are false-coloured either blue (CDI attacker, tailocin-susceptible) or magenta (tailocin attacker, CDI-susceptible). Scale bars, 500 µm. d, Experiments: quantification of colony competition outcomes via counts of CFUs. Values above 1 (dashed line) indicate an advantage for CDI, while values below 1 indicate an advantage for tailocins. Data are adjusted to account for differences in competitiveness of the strain backgrounds (ΔwapR relative to ΔwbpL; see Methods and Extended Data Fig. 2). Horizontal bars indicate the mean from independent biological replicates (n = 8). Top brackets indicate a significant difference between the initial ratios (two-sided Welch’s t-test, P < 0.05, Benjamini–Hochberg correction for multiple testing; see Supplementary Table 5 for exact P values). Stars indicate a significant competitive advantage. The genotype of the CDI-using, tailocin-susceptible strain (blue) is ΔR2ΔwbpL. The genotype of the tailocin-using, CDI-susceptible strain (magenta) is ΔwapRΔCDI. Source data
Fig. 4
Fig. 4. The benefits of short and long-range weapons combine positively in P. aeruginosa.
Quantification of competition outcomes in the colony centre for two initial cell densities (mean inoculum density 1.9 × 10⁵, 106 CFU µl−1). Competitive advantage assesses the fold change in the attacker strain compared with its competitor from the beginning to end of the competition. Competitions where the attacker has just CDI (blue, left), just tailocins (magenta, centre) or both weapons (purple, right) show the advantage gained from using two weapons together as compared to just one. Data are adjusted to account for differences in competitiveness of the strain backgrounds (ΔwapR relative to ΔwbpL; see Methods and Extended Data Fig. 2). Horizontal bars indicate the mean from independent biological replicates, n ≥ 6; see Supplementary Table 5 for exact values of n). Stars above the double weapon data indicate a significant difference between the combination of weapons and either single weapon (blue and magenta), or just CDI (blue) (two-sided Welch’s t-test, P < 0.05, Benjamini–Hochberg correction for multiple testing; see Supplementary Table 5 for exact P values). Source data
Extended Data Fig. 1
Extended Data Fig. 1. Agent-based modelling shows differences between weapons due to initial density of competitions, weapons depend differently on toxin secretion rate and that contact weapons better facilitate invasion than diffusible weapons at equivalent secretion rates.
a Quantification of competition outcomes for all tested densities (secretion rate: 100). Densities of 10 and 100 cells correspond respectively to ‘Low’ and ‘High’ starting densities shown in Fig. 1. Competitive advantage assesses the fold change in the attacker strain compared to its competitor from the beginning to end of the simulation (Methods). Horizontal lines indicate the mean from multiple simulations (n = 6). b Outcomes of competition simulations over a range of secretion rates and initial attacker frequencies (10%, 30%, 50%, 70%, 90%); initial density: 150 cells. Competitive advantage assesses the fold change in the attacker strain compared to its competitor from the beginning to end of the simulation (Methods). Horizontal lines indicate the mean from multiple simulations (n = 7). c Quantification of competition outcomes for invasions as a function of secretion rate. Invasion outcome is the same as competitive advantage (the fold change in the attacker strain compared to its competitor from the time of invasion to the end of the simulation). Horizontal lines indicate the mean from multiple simulations (n ≥ 6, see Supplementary Table 5 for more details; only invasions where the invader was still present at the end of the simulation were analyzed). Source data
Extended Data Fig. 2
Extended Data Fig. 2. Lipopolysaccharide biosynthesis genes affect susceptibility to pyocin R2.
Images of agar overlay assays showing pyocin R2 zones of clearing (arrows) for different LPS mutants. The strain in the overlay is indicated in the center of each plate. The source strain for the pyocin R2 is indicated at the corners. Pyocins were prepared by sterile filtering supernatant from overnight cultures. Overlays were prepared by mixing 1 mL of overnight culture with 7 mL 0.75% LB agar then thoroughly drying. a ΔwapR shows no zones of clearing. b ΔR2 ΔwbpL (the entire pyocin R2 gene cassette was first deleted from this strain, then wbpL deleted second) shows zones of clearing from WT and ΔwapR, but not when pyocin R2 is deleted. c Complementing ΔR2ΔwbpL with empty vector pSEVA-524 does not rescue clearing. d Complementing ΔR2ΔwbpL with pSEVA-524 carrying wbpL shows no clearing from WT or ΔwapR.
Extended Data Fig. 3
Extended Data Fig. 3. Lipopolysaccharide biosynthesis gene deletions affect competition outcomes in the absence of pyocin R2.
Microscopy shows that the ΔwbpL strain cannot compete with wild-type P. aeruginosa, even in the absence of killing by tailocins (pyocin R2). Conversely, ΔwbpL and ΔwapR (second from top) are closely matched and look similar to wild-type competed against ΔR2 (top). Competitions were inoculated with ~2 × 106 cells/μL. Images are representative from three independent experiments.
Extended Data Fig. 4
Extended Data Fig. 4. Deletion of lipopolysaccharide biosynthesis gene wapR causes a disadvantage compared to deletion of wbpL when both strains have pyocin R2 deleted.
Quantification of colony competition outcomes between lipopolysaccharide biosynthesis mutants in the absence of pyocin R2. Colonies were inoculated at the stated initial ratios and densities (mean inoculum density 1.8 * 103, 104, 105, 106 CFU/µL). Competitive advantage assesses the fold change in the attacker strain compared to its competitor from the beginning to end of the competition. Horizontal lines indicate the mean from biological replicates (n ≥ 6, See Supplementary Table 5 for exact n values). The mean (−0.637) across all replicates from all densities and inoculum ratios for the center was significantly different from 0 (One sided Welch’s t-test, t = 20.48, df = 111, p = 2.2e-16), so was used as the baseline advantage of ΔwbpL over ΔwapR. This difference in advantage was subtracted from all competitions involving strains with these LPS biosynthesis gene deletions. Source data
Extended Data Fig. 5
Extended Data Fig. 5. Colony competitions of contact dependent inhibition (CDI) and tailocins highlight differences between contact and diffusible toxins.
Representative microscopy images of colony competitions inoculated from different starting densities (mean inoculum density 1.9 * 103, 104, 105, 106 CFU/µL). and initial ratios of attacker to susceptible cells taken after 48 h of growth. All strains are expressing constitutive fluorescent protein genes and false-coloured either blue (CDI attacker, top), magenta (tailocin attacker, bottom) or yellow (susceptible, top and bottom). Scale bar indicates 500 µm. For the CDI competitions the attacker was wild-type and the susceptible has the CDI toxin and anti-toxin deleted. For the tailocin competitions, the attacker is ΔwapR and the susceptible strain is ΔR2ΔwbpL. Images shown here are representative, images were taken for every colony sampled (data presented in Fig. 2), exact values of n are detailed in Supplementary Table 5.
Extended Data Fig. 6
Extended Data Fig. 6. Agent-based modelling of head-to-head weapon competitions between short and long-range weapon users.
Quantification of simulated direct weapon competition outcomes started at different initial densities, ratios and secretion rates. Density indicates the initial number of cells in the simulation. Competitive advantage assesses the fold change in the attacker strain compared to its competitor from the beginning to end of the competition. Horizontal lines indicate the mean from multiple simulations (n = 6). Densities of 10 and 100 cells, with secretion rate 100, correspond respectively to ‘Low’ and ‘High’ starting densities shown in Fig. 3. Source data
Extended Data Fig. 7
Extended Data Fig. 7. Outcomes of colony competitions shows that CDI remains functional in LPS biosynthesis gene mutants, but its effectiveness is diminished at low densities.
Outcomes of CDI mediated competitions in wild-type (WT, green) or asymmetric LPS backgrounds. For these cases, both strains also have tailocins (pyocin R2) deleted. The attacking CDI+ strain is either ΔwapR against a CDI susceptible ΔwbpL (mauve) or CDI+ ΔwbpL against CDI susceptible ΔwapR (orange). Colonies were inoculated at the denoted initial densities (mean inoculum density 2.0 * 103, 104, 105, 106 CFU/µL) and quantified by sampling, plating and counting colony forming units after 48 h of growth. Horizontal lines indicate the mean from biological replicates (n ≥ 4, see Supplementary Table 5 for exact n values). Competitive advantage assesses the fold change in the attacker strain compared to its competitor from the beginning to end of the competition. Top brackets indicate a significant difference between each single weapon and the combination of weapons (two-sided Welch’s t-test, p < 0.05, Benjamini-Hochberg correction for multiple testing, see Supplementary Table 5 for exact p values). Source data
Extended Data Fig. 8
Extended Data Fig. 8. Head-to-head weapon competitions between short and long-range weapon users at the colony edge.
Quantification of direct weapon colony competition outcomes at the colony edge by sampling, plating and counting colony forming units. Competitive advantage assesses the fold change in the attacker strain compared to its competitor from the beginning to end of the competition. Values above 1 (10°, dashed line) indicate an advantage for CDI, while values below 1 (that is 10−2, 10−4) indicate an advantage for tailocins. Horizontal lines indicate the mean from biological replicates (n = 8). Top brackets indicate a significant difference between the initial ratios (two-sided Welch’s t-test, p < 0.05, Benjamini-Hochberg correction for multiple testing, see Supplementary Table 5 for exact p values). Stars indicate a competitive advantage significantly different from 0 (one-sided Welch’s t-test, p < 0.05, Benjamini-Hochberg correction for multiple testing, see Supplementary Table 5 for exact p values). Competitions were inoculated with different initial densities (mean inoculum density 2.3 * 105, 106 CFU/µL). The genotype of the CDI using, tailocin susceptible strain (blue) is ΔR2ΔwbpL. The genotype of the tailocin using, CDI susceptible strain is ΔwapRΔCDI. Source data
Extended Data Fig. 9
Extended Data Fig. 9. Short and long-range weapon benefits can combine positively at the colony edge.
Quantification of competition outcomes in the colony edge for two initial cell densities (mean inoculum density 1.9 * 105, 106 CFU/µL). Competitive advantage assesses the fold change in the attacker strain compared to its competitor from the beginning to end of the competition. Competitions where the attacker has just CDI (blue, left), just tailocins (magenta, centre) or both weapons (purple, right) show the advantage gained from using two weapons together as compared to just one. Data are adjusted to account for differences in competitiveness of the strain backgrounds (ΔwapR relative to ΔwbpL; see methods and Supplementary Fig. 2). Horizontal lines indicate the mean from biological replicates (n ≥ 6, see Supplementary Table 5 for exact n values).The star above the double weapon data indicates a significant difference between the combination of weapons and just tailocins (two-sided Welch’s t-test, p < 0.05, Benjamini-Hochberg correction for multiple testing, see Supplementary Table 5 for exact p values). Data from colony edge are noisier than in the colony center but patterns are consistent with the colony interior. Source data
Extended Data Fig. 10
Extended Data Fig. 10. Microscopy images of colony competitions with doubly-armed attackers.
Representative microscopy images (taken after 48 h of growth) of colony competitions inoculated from different starting densities (mean inoculum density 1.9 * 105, 106 CFU/µL). and initial ratios of attacking and dual CDI/tailocin susceptible cells. All strains are expressing constitutive fluorescent protein genes and false-coloured either purple (attacker) or yellow (CDI and tailocin susceptible). Scale bar indicates 500 µm. The genotype of the attacker is ΔwapR. The genotype of the susceptible strain is ΔCDIΔR2ΔwbpL. Images shown here are representative, images were taken for every colony sampled (data presented in Fig. 4).

Similar articles

Cited by

References

    1. Darwin, C. On the Origin of Species by Means of Natural Selection, or the Preservation of Favoured Races in the Struggle for Life (John Murray, 1859). - PMC - PubMed
    1. Emlen, D. Animal Weapons: The Evolution of Battle (Picador, 2015).
    1. Granato ET, Meiller-Legrand TA, Foster KR. The evolution and ecology of bacterial warfare. Curr. Biol. 2019;29:R521–R537. doi: 10.1016/j.cub.2019.04.024. - DOI - PubMed
    1. García-Bayona L, Comstock LE. Bacterial antagonism in host-associated microbial communities. Science. 2018;361:eaat2456. doi: 10.1126/science.aat2456. - DOI - PubMed
    1. Hibbing ME, Fuqua C, Parsek MR, Peterson SB. Bacterial competition: surviving and thriving in the microbial jungle. Nat. Rev. Microbiol. 2010;8:15–25. doi: 10.1038/nrmicro2259. - DOI - PMC - PubMed