. 2024 Jan;27(1):148-158.
doi: 10.1038/s41593-023-01498-y. Epub 2023 Nov 30.

Rapid fluctuations in functional connectivity of cortical networks encode spontaneous behavior

Affiliations

Rapid fluctuations in functional connectivity of cortical networks encode spontaneous behavior

Hadas Benisty et al. Nat Neurosci. 2024 Jan.

Abstract

Experimental work across species has demonstrated that spontaneously generated behaviors are robustly coupled to variations in neural activity within the cerebral cortex. Functional magnetic resonance imaging data suggest that temporal correlations in cortical networks vary across distinct behavioral states, providing for the dynamic reorganization of patterned activity. However, these data generally lack the temporal resolution to establish links between cortical signals and the continuously varying fluctuations in spontaneous behavior observed in awake animals. Here, we used wide-field mesoscopic calcium imaging to monitor cortical dynamics in awake mice and developed an approach to quantify rapidly time-varying functional connectivity. We show that spontaneous behaviors are represented by fast changes in both the magnitude and correlational structure of cortical network activity. Combining mesoscopic imaging with simultaneous cellular-resolution two-photon microscopy demonstrated that correlations among neighboring neurons and between local and large-scale networks also encode behavior. Finally, the dynamic functional connectivity of mesoscale signals revealed subnetworks not predicted by traditional anatomical atlas-based parcellation of the cortex. These results provide new insights into how behavioral information is represented across the neocortex and demonstrate an analytical framework for investigating time-varying functional connectivity in neural networks.


Conflict of interest statement

Competing Interests Statement

The authors declare no conflicts of interest exist.

Figures
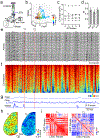
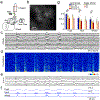
Figure 1.
Figure 1.. Mesoscopic imaging of cortical activity and functional connectivity.
a, Schematic illustrating the setup for simultaneous behavioral monitoring and mesoscopic calcium imaging. b, Scatter plot illustrating the distribution of Z-scored behavioral metric values (locomotion, facial movement, and pupil size) over a 400 second window for the example mouse shown in (e-i). c, Population data showing Calinski-Harabasz index values for K-means clustering of behavioral metrics for all subjects. d, Population data (n=6 independent mice) showing average (±SEM) Pearson’s R2 values for the relationships between wheel (W), pupil (P), and facial movements (F) for all subjects. e, Example time series from one animal showing cortical activity across the cortex. Each trace corresponds to one LSSC-based parcel. f, Heat map illustrating the time-series of pairwise correlations between each parcel from (e). Data are sorted by increasing standard deviation. g, Time series of behavioral metrics corresponding to the data shown in (e) and (f). h, Example LSSC-based functional parcellation of the neocortex for the data shown above. Left and right images are for the timepoints indicated by vertical red lines. i, Example pairwise correlation matrices for the data in (e) at the time points indicated.
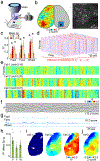
Figure 2.
Figure 2.. Dynamic functional connectivity encodes rapid behavioral variations.
a, Example sequential pairwise, parcel-based correlation matrices, derived from a sliding window applied to neural activity across the cortex. b, Left, Schematic illustrating the cone-shaped Riemannian manifold used to calculate distances between correlation matrices. The Riemannian measurement reflects geodesic distance that is ignored when using Euclidean distance. Right, Illustration of a “graph of graphs”, whose nodes are individual matrices and edges are weighted by the length of the geodesic arc along the Riemannian cone, that is used to extract diffusion embedding (ϕt) components. c, Example diffusion embedding components capturing dynamics of functional connectivity ϕt. d, Time series for behavioral metrics corresponding to data in (c). e, Example behavioral data (blue traces) from (d) showing fluctuations in pupil diameter, facial movement, and locomotion superimposed on predicted behavior (red traces) estimated using a joint model based on time-varying activity and embedded correlations. f, Population data (n=6 independent mice) showing average (±SEM) prediction accuracy (R2) for modeling behavior variables using a joint model of activity and embedded correlations (blue), joint model with shuffled ϕt (yellow), joint model with shuffled activity (red), single predictor model using activity (pale yellow), and single predictor model using ϕt (pale red). * indicates p<0.05 for two sided paired t-test (see main text). Full model compared to shuffling ϕt(20): p=0.001 for pupil, p=0.002 for face and p=0.01 for wheel. Full model compared to shuffling xt: p=0.02 for pupil, p=0.006 for face, p=0.003 for wheel.
Figure 3.
Figure 3.. Local circuit dynamics encode spontaneous behavioral variation.
a, Schematic illustrating the setup for simultaneous behavioral monitoring and 2-photon calcium imaging. b, Example field of view showing individual GCaMP6s-expressing neurons in visual cortex. Similar results were obtained for each of 6 mice. c, Example time series showing neuronal activity for all neurons in the field of view. d, Heat map illustrating the time-series of pairwise correlations between each neuron from (c). Data are sorted by increasing standard deviation. e, Example of the first six diffusion embedding components based on data in (d). f, Time-series for behavioral metrics corresponding to data in (c-d). g, Population data (n=6 independent mice) showing average (±SEM) prediction accuracy (R2) for modeling behavior variables using a joint model of activity and embedded correlations (blue), joint model with shuffled ϕt (yellow), joint model with shuffled activity (red), single predictor model using activity (pale yellow), and single predictor model using ϕt (pale red). * indicates p<0.05 for two sided paired t-test (see main text). Full model compared to shuffling ϕt(20): p=0.04 for pupil, p=0.03 for face and p=0.02 for wheel. Full model compared to shuffling xt: p=0.0002 for pupil, p=0.006 for face p=0.003 for wheel.
Figure 4.
Figure 4.. Dynamic functional connectivity reveals distinct cortical subnetworks.
a, Left illustration of LSSC-based parcellation, highlighting two parcels corresponding approximately to supplemental motor cortex (MOs) and primary visual cortex (VISp) based on CCFv3. Right, example components of correlation embedding for one animal (black), pairwise time-varying correlation between VISp and MOs (blue), and the predicted VISp-MOs correlation based on embedding. b, Example matrix from one animal showing the goodness of fit (R2) for modeling the time-varying correlations between each pair of parcels using ϕt(20). c, Average (n=6 mice) maps showing mean R2 values for modeling the pairwise correlations of each cortical parcel with the indicated target parcel (shown in white). d, Left, grand average map showing R2 values as in (c) collapsed across all animals (n=6) and all cortical parcels. Right, schematic illustrating the anterolateral (red) and posterior subnetworks (blue) derived from data in (c). Red dashed lines indicate angles for bisecting LSSC parcels into arbitrary subnetworks, with solid line (30°) corresponding to anterolateral/posterior division. e, Left, population data showing the average (±SEM) prediction accuracy for modeling pupil fluctuation based on time-varying activity in two subnetworks determined by bisecting lines in (d). Right, average (±SEM) prediction accuracy for pupil fluctuation based on time-varying correlation between two subnetworks determined by lines in (d).
Figure 5.
Figure 5.. Functional connectivity across spatial scales encodes behavior.
a, Schematic illustrating the setup for simultaneous mesoscopic and 2-photon imaging. b, Left, example mesoscopic imaging frame and schematic of microprism placement in the contralateral hemisphere. Right, example 2-photon imaging frame collected through the prism. c, Population data (n=7 independent mice) showing average (±SEM) prediction accuracy (R2) for modeling behavior variables using either activity (yellow) or ϕt (red) for mesoscopic or 2-photon data. * indicates p<0.05 for two sided paired t-test (see main text). Comparing ϕt(20) to xt: for mesoscopic data, pupil: p=0.002; face: p=0.004; wheel: p=0.0002. For cellular data, pupil: p=0.0001; face: p=0.001; wheel: p=0.0004. d, Example sequential multimodal correlation matrices, derived from a sliding window applied to neural activity from mesoscopic (parcels) and 2-photon (cells) imaging, used for diffusion embedding. e, Dynamic multimodal correlation time series for three example cells, where each row represents a mesoscopic parcel. The standard deviation of correlation values over time, averaged across all rows is indicated. f, Example of the first 20 diffusion embedding components from the same animal (n=243 cells, 47 parcels). g, Time series for behavioral metrics corresponding to data in (e-g). h, Population data (n=7 independent mice) showing average (±SEM) prediction accuracy (R2) for modeling behavior variables using ϕt derived from the embedding of dual mesoscopic and 2-photon correlations. i, Example maps for the cells in (e) showing R2 values for modeling the correlation of the cell with each parcel using the overall diffusion embedding. j, Grand average map showing R2 values as in (i) collapsed across all animals (n=6) and all cells and cortical parcels.

References

    1. Breakspear M Dynamic models of large-scale brain activity. Nat Neurosci 20, 340–352 (2017). - PubMed
    1. Calhoun VD, Miller R, Pearlson G & Adali T The chronnectome: time-varying connectivity networks as the next frontier in fMRI data discovery. Neuron 84, 262–274 (2014). - PMC - PubMed
    1. Cardin JA, Crair MC & Higley MJ Mesoscopic Imaging: Shining a Wide Light on Large-Scale Neural Dynamics. Neuron 108, 33–43 (2020). - PMC - PubMed
    1. Boly M, et al. Baseline brain activity fluctuations predict somatosensory perception in humans. Proc Natl Acad Sci U S A 104, 12187–12192 (2007). - PMC - PubMed
    1. de Gee JW, et al. Pupil-linked phasic arousal predicts a reduction of choice bias across species and decision domains. Elife 9(2020). - PMC - PubMed