. 2024 Jan;25(1):41-53.
doi: 10.1038/s41590-023-01700-0. Epub 2023 Nov 30.

BCG vaccination stimulates integrated organ immunity by feedback of the adaptive immune response to imprint prolonged innate antiviral resistance

Affiliations

BCG vaccination stimulates integrated organ immunity by feedback of the adaptive immune response to imprint prolonged innate antiviral resistance

Audrey Lee et al. Nat Immunol. 2024 Jan.

Abstract

Bacille Calmette-Guérin (BCG) vaccination can confer nonspecific protection against heterologous pathogens. However, the underlying mechanisms remain mysterious. We show that mice vaccinated intravenously with BCG exhibited reduced weight loss and/or improved viral clearance when challenged with severe acute respiratory syndrome coronavirus 2 (SARS-CoV-2 B.1.351) or PR8 influenza. Protection was first evident between 14 and 21 d post-vaccination and lasted ∼3 months. Notably, BCG induced a biphasic innate response and robust antigen-specific type 1 helper T cell (TH1 cell) responses in the lungs. MyD88 signaling was essential for innate and TH1 cell responses, and protection against SARS-CoV-2. Depletion of CD4+ T cells or interferon (IFN)-γ activity before infection obliterated innate activation and protection. Single-cell and spatial transcriptomics revealed CD4-dependent expression of IFN-stimulated genes in lung myeloid and epithelial cells. Notably, BCG also induced protection against weight loss after mouse-adapted SARS-CoV-2 BA.5, SARS-CoV and SHC014 coronavirus infections. Thus, BCG elicits integrated organ immunity, where CD4+ T cells feed back on tissue myeloid and epithelial cells to imprint prolonged and broad innate antiviral resistance.


Conflict of interest statement

COMPETING INTERESTS

B.P. has served or is serving on the External Immunology Network of GSK, and on the scientific advisory boards of Sanofi, Medicago, CircBio and Boehringer-Ingelheim. R.S.B. serves on the Scientific Advisory Board of Takeda, VaxArt, and Invivyd and has collaborations with Janssen Pharmaceuticals, Gilead, Chimerix, and Pardes Biosciences. S.R.L. and R.S.B. are listed on a patent for the SARS-CoV-2 MA10 virus (US 11225508 B1, “Mouse-adapted SARS-CoV-2 Viruses and Methods of Use Thereof”). G.P.N is a co-founder and stockholder of Ionpath Inc.; G.P.N. is a co-founder and stockholder of Akoya Biosciences, Inc. and an inventor on patent US9909167.; G.P.N. is a Scientific Advisory Board member for Akoya Biosciences, Inc.; G.P.N. received research grants from Pfizer, Inc.; Vaxart, Inc.; Celgene, Inc.; and Juno Therapeutics, Inc. G.P.N is co-founder for Scale Biosciences Inc. M.S.S. has served in an advisory role for Ocugen, Inc. The remaining authors declare no competing interests.

Figures

Extended Data Fig. 1
Extended Data Fig. 1. BCG delivered via multiple routes of vaccination conferred protection against SARS-CoV-2 and influenza A PR8.
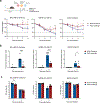
a, Representative immunohistochemisry images depicting staining of SARS-CoV-2 nucleocapsid protein (NP). Blue circles represent expression of SARS-CoV-2 NP in focal alveoli, alveolar macrophages, alveolar pneumocytes and rare bronchiolar epithelial cells. BCG IV: Intravenous BCG vaccinated. b, Left, weight loss of intranasal BCG vaccinated mice followed 3 days post-SARS-CoV-2 challenge. Right, SARS-CoV-2 RNA-dependent RNA polymerse (RdRp) viral load as fold-change over mock-infected, in the lungs and nasal turbinates. Statistical analysis was performed by two-tailed Mann-Whitney test. c, Survival plot and weight loss of mice following PR8 infection. Mice were vaccinated via various routes including intravenous (IV), intranasal (IN), intramuscular (IM), subcutaneous (SC). BCG IV and IN, data combined from 2 independent experiments, n = 11 (BCG IV), n = 12 (BCG IN); BCG IM, data combined from 3 independent experiments (n = 16 for naïve and n = 17 for BCG IM). BCG SC, data from one independent experiment (n = 5). Survival analysis was performed using log-rank (Mantel-Cox) test. Statistical analysis for weight loss was performed by Two-way ANOVA with Sidak’s multiple comparisons test. **, P < 0.01.
Extended Data Fig. 2
Extended Data Fig. 2. BCG vaccination protects mice from weight loss against various strains of mouse-adapted Sarbecoviruses.
a, Experimental outline and weight loss of mice following challenge. b, Gross lung discoloration score at day 2 or 4 post-challenge. c, Lung viral titer at day 2 or 4 post-challenge, as assessed by plaque assay. Data representative of one independent experiment; In a, b, c, for SHC014 MA15, n = 8 (BCG); For SARS-CoV MA15 n = 9 (BCG); n = 7 for all other groups. Mean±SEM values are plotted. Statistical analysis was performed by Two-way ANOVA with Sidak’s multiple comparisons test. *, P < 0.05; **, P < 0.01; ***, P < 0.005; ****, P < 0.0001.
Extended Data Fig. 3
Extended Data Fig. 3. BCG induced prolonged serum cytokine and lung innate activation.
a, Extended data of kinetics of serum cytokine responses measured by Luminex. Data representative of two independent experiments; n = 10 (day 0), n = 4 (day 21), n = 5 (all other time points). b, Flow cytometry gating strategy of lung populations (Top) and cell frequencies (CD45+ live cells) of innate cells in lungs (Bottom). Data is representative of two independent experiments for day 21 and one representative experiment for other timepoints (n = 5–8). Data representative of two independent experiments at day 21 (n = 4) and one independent experiment for all other timepoints; n = 9 (day 0), n = 5 for all other timepoints. Statistical analysis was performed by One-way ANOVA with Tukey’s multiple comparisons test (a), One-way ANOVA with Dunnett’s multiple comparison test for each timepoint compared to day 0 (b). *, P < 0.05; **, P < 0.01; ***, P < 0.005; ****, P < 0.0001.
Extended Data Fig. 4
Extended Data Fig. 4. BCG induced systemic innate activation and bone marrow stem and progenitor expansion.
a, Flow cytometry gating strategy, cell frequencies (CD45+ live cells), and CD86 MFI of innate cells in spleen. Data is representative of two independent experiments for day 21 and one representative experiment for other timepoints; n = 4 for day 21, n = 8 (day 0), n = 5 for all other timepoints. b, Flow cytometry gating strategy and frequencies of bone marrow cells (% of live cells). Data from one representative experiment. Abbreviations, LSK: LinSca-1+c-Kit+ cells, LT-HSC: Long-term HSC. ST-HSC: Short-term HSC. MPP: Multipotent progenitor. One-way ANOVA with Dunnett’s multiple comparison test for each timepoint compared to day 0 (a and b). *, P < 0.05; **, P < 0.01; ***, P < 0.005; ****, P < 0.0001.
Extended Data Fig. 5
Extended Data Fig. 5. Extended data on CyTOF analysis in the spleen.
UMAP embedding of the cell clusters identified by FlowSOM clustering (left), heatmap depicting the normalized values of key surface markers across identified clusters (right). (bottom) Frequencies of CD4+ T cell and Ly6Chi monocyte in the spleen and normalized and scaled values of intracellular markers detected by CyTOF. The box plots show median, first and third quartiles and the whiskers show 1.5x interquartile range (IQR) on either side. Statistical analysis was performed by two-tailed Wilcoxon rank-sum test. *, P < 0.05; ***, P < 0.005.
Extended Data Fig. 6
Extended Data Fig. 6. Differential immune responses to BCG vaccination in knock-out (KO) mice.
a and b, Serum cytokine responses in wild-type (WT) and Myd88−/− mice vaccinated with BCG intravenously at baseline, 6 h and 18 days post-vaccination (a), and day 3 post-SARS-CoV-2 challenge (b). c and d, Serum cytokine responses in wild-type (WT) and ASC−/− (c) and STING−/− (d) mice vaccinated with BCG intravenously. Data representative of two independent experiments for Myd88−/− and ASC−/− (n = 6). Two-way ANOVA with Tukey’s multiple comparison test (panel b, e, f). Multiple Mann-Whitney with Holm-Sidak multiple comparisons test (panel c, d). *, P < 0.05; **, P < 0.01; ****, P < 0.0001.
Extended Data Fig. 7
Extended Data Fig. 7. SARS-CoV-2 RNA-dependent RNA polymerase (RdRp) level in CD4 and/or CD8 antibody depleted mice.
Viral load was measured at day 3 post-challenge by quantitative PCR and is represented as fold-change over mock-infected mice (mean±SEM). Data representative of one independent experiment, n = 6. Statistical analysis by two-tailed Mann-Whitney test; ns, not significant.
Extended Data Fig. 8
Extended Data Fig. 8. Extended data from scRNA-seq analysis of lungs in mice at day 0 and 21 post-vaccination.
a, Top variable genes defining cell clusters identified from scRNA-seq data. b, Distribution of cells identified day 0 and 21 post-vaccination on the UMAP embedding. c, Overrepresentation analysis and enrichment of Gene Ontology (GO) biological processes across identified cell clusters, using differentially expressed genes (DEGs; log2FC cutoff > 0.25; FDR cutoff < 0.05). Enrichment was performed using hypergeometric distribution with BH correction.
Extended Data Fig. 9
Extended Data Fig. 9. Protein level expression of interferon-stimulated gene (Mx1) and IFN-γ in lung cells, and CD4+ T cells, respectively.
a, Mx1 median fluorescent intensity (MFI) of lung myeloid and alveolar type II epithelial cells detected using Mx1-GFP reporter mice at various timepoints post-vaccination with BCG intravenously (n = 3–5). Data representative of two independent experiments in lung myeloid cells and one representative experiment in alveolar type II cells; n = 5 for day 21, n = 4 for all other timepoints. b, Frequency of IFN-g+ cells (% of cell population of interest) in vivo, as measured by flow cytometry staining 6 h following Brefeldin A injection in mice. Data from one representative experiment; n = 7 for BCG, n = 4 for Unimmunized. Statistical analysis was performed by Two-way ANOVA with Dunnet’s test (a; myeloid cells) Sidak’s multiple comparisons test (b), and with two-tailed Mann-Whitney test (a; alveolar type II cells). *, P < 0.01; ****, P < 0.0001.
Extended Data Fig. 10
Extended Data Fig. 10. Extended data showing impaired activation of lung myeloid cells following CD4+ T cell or IFN-γ depletion.
CD86 median fluorescence intensity (MFI) of DCs in the lungs at day 21 post-BCG IV vaccination following CD4 depletion (top) and IFN-g depletion (bottom). Data representative of one independent experiment; n = 5 (BCG+Isotype), n = 6 (Unvaccinated and BCG+anti-CD4), n = 9 (BCG) in CD4 depletion; n = 4 (Unvaccinated) and n = 5 (rest of the groups) in IFN-g depletion. Statistical analysis was performed by One-way ANOVA with Tukey’s multiple comparison test. *, P < 0.05; **, P < 0.01; ***, P < 0.005; ****, P < 0.0001.
Figure 1.
Figure 1.. BCG vaccination protects mice against challenge with SARS-CoV-2.
a, Experimental outline and weight loss of BCG IV vaccinated and unvaccinated control mice following SARS-CoV-2 challenge at day 7, 14, 21, 28, 42 post-vaccination. Mean % starting weight and % starting weight of individual mice are shown here. b, Log10 fold-change of SARS-CoV-2 RNA-dependent RNA polymerase (RdRp) gene in lungs and nasal turbinates over mock-infected mice, as measured by RT-PCR. c, Pathology score and SARS-CoV-2 nucleocapsid protein (NP) score of lung tissue sections measured at D3 post-challenge. Bottom, Representative H&E stained lung sections from unvaccinated, BCG IV, mock-infected mice with circles and rectangle representing peribronchiolar, perivascular inflammation and alveolar inflammation, respectively. d, Weight loss (left) and lung viral load (right) of mice challenged with SARS-CoV-2 at approximately 3 months post-vaccination. In panel a and b, data combined from two independent experiments at D21 (n=12) and D42 (n=6), and representative of one independent experiment at day 7, 14, 28 (n=6). In c, data representative of two independent experiments; n=6 for all groups, n=10 for mock. In d, data representative of one independent experiment (n=10). In b and d, mean±SD are shown in plots. Statistical analysis was performed by Two-way ANOVA with Sidak’s multiple comparisons test for weight loss (a and d), multiple Mann-Whitney (two-tailed) with Holm-Sidak multiple comparisons test (b and c), and Two-tailed Mann-Whitney test for viral load (d). *, P < 0.05; **, P < 0.01; ****, P < 0.0001.
Figure 2.
Figure 2.. BCG vaccination induced a biphasic pattern of innate activation.
a, Serum cytokine measured by Luminex assay at various timepoints post-BCG IV vaccination. Data representative of two independent experiments; n=10 (day 0), n=4 (day 21), n=5 (all other time points). b, Frequency (% live CD45+ cells) and activation indicated by CD86 median fluorescence intensity (MFI) of innate cell populations in the lungs post-BCG IV vaccination. Data representative of two independent experiments at day 21 (n=4) and one independent experiment for all other timepoints; n=9 (day 0), n=5 for all other timepoints. c, top, CyTOF analysis of lung immune cells at day 21 post-vaccination. Uniform Manifold Approximation and Projection (UMAP) of 17,638 total live cells obtained in the lungs of unvaccinated (unvax) and BCG IV vaccinated mice. bottom, Normalized and scaled mean values of intracellular markers found in CD4+ T cells, Ly6C+ monocytes, and alveolar macrophages (AM) in individual mice, visualized as dot plots and distribution plot (pERK1–2 in CD4+ T cells). Unvax, Unvaccinated. Data representative of one independent experiment (n=5). Individual and mean values are shown in plots. Statistical analysis was performed by One-way ANOVA with Tukey’s multiple comparisons test (a), Dunnett’s multiple comparison test for each timepoint compared to day 0 (b), Two-tailed Wilcoxon rank-sum test (c). *, P < 0.05; **, P < 0.01; ***, P < 0.005; ****, P < 0.0001.
Figure 3.
Figure 3.. BCG vaccination induced a robust Th1 profile at 21 days post-vaccination.
a, BCG-specific lung CD4+ and CD8+ T cell responses at baseline, day 7, 21, 42 post-BCG IV vaccination, as analyzed by ex vivo stimulation with crude BCG. Left, representative flow cytometry plot of CD4+ T cells expressing IFN-γ or TNF. Data combined from two independent experiments for D21 (n=14) and D0 (n=9), and representative of one independent experiment for D7 (n=5). b, Lung CD4+ T cell proportion of T cell subsets at day 21. c, Spleen CD4+ T cell responses at baseline, day 7, 21 post-BCG IV vaccination. d, Spleen CD4+ T cell proportion of T cell subsets at day 21 (D0, n=3; D7 and D21, n=5). D0 and D21 data combined from 2 independent experiments (D0, n=9; D21, n=14). Day 7 and 42 data representative of one independent experiment (n=5). Individual and mean values are shown in plots. Statistical analysis was performed by One-way ANOVA with Tukey’s multiple comparisons test. ns, not significant, *, P < 0.05; **, P < 0.01; ***, P < 0.005; ****, P < 0.0001.
Figure 4.
Figure 4.. Protection against SARS-CoV-2 B.1.351 conferred by BCG vaccination is dependent on MyD88 signaling.
a, Diagram depicting the innate signaling pathways induced by BCG bacterium. b, Experimental outline and weight loss of vaccinated and unvaccinated knock-out mice following SARS-CoV-2 challenge. Data shown is mean±SEM. c, SARS-CoV-2 viral load in lungs and nasal turbinates at D3 post-challenge expressed as fold-change over mock-infected mice. In panel b and c, Wild-type (WT), Myd88−/− and Asc−/− data combined from two independent experiments, n=11 (Unvaccinated for WT, Myd88-KO), n=12 (BCG IV for WT, Myd88-KO and ASC-KO). Sting−/− data representative of one independent experiment, n=5 (Uvaccinated), n=6 (BCG IV). d, Pathology score and SARS-CoV-2 nucleocapsid protein (NP) score of lung tissue sections measured at D3 post-challenge in knock-out models (n=6). e, Serum cytokine responses in BCG IV and unvaccinated WT and Myd88−/− mice pre-challenge. Data combined from two independent experiments (n=12 for all groups and n=13 for Myd88−/− BCG IV). f, T cell responses in BCG IV and unvaccinated Myd88−/− compared to WT mice. Data representative of two independent experiments, n=5 (Myd88−/− Unvaccinated and WT BCG), n=6 (Myd88−/− BCG), n=4 (WT Unvaccinated). The same WT controls were used but visualized on separate plots. Statistical analysis was performed by Two-way ANOVA with Tukey’s multiple comparison test (panel b, e, f). Multiple Mann-Whitney (two-tailed) with Holm-Sidak multiple comparisons test (panel c, d). ns, not significant, *, P < 0.05; **, P < 0.01; ****, P < 0.0001.
Figure 5.
Figure 5.. CD4+ T cells and IFN-γ production play a critical role in the heterologous protection mediated by BCG vaccination.
a, Experimental outline and lung SARS-CoV-2 viral load (Mean±SEM) following T cell depletion and challenge. Data representative of two independent experiments (n=6). b, Weight loss (Mean±SEM) of BCG IV vaccinated and unvaccinated control mice following T cell depletion and SARS-CoV-2 challenge. Data combined from two independent experiments; n=12 for all groups, n=6 for Unvaccinated+anti-CD4 and/or CD8. c, Lung viral load and weight loss (Mean±SEM) from SARS-CoV-2 challenge following cytokine depletion. Data combined from two independent experiments; n=18 for isotype control groups; For IFN-γ, n=9 (Unvaccinated), n=14 (BCG); For TNF, n=9 (Unvaccinated), n=13 (BCG). The same unvaccinated controls were used for CD4 and/or CD8 depletion experiments but visualized on separate plots. Statistical analysis was performed by Two-way ANOVA with Tukey’s multiple comparison test (panel b, c weight loss). Multiple Mann-Whitney (two-tailed) with Holm-Sidak multiple comparisons test (panel a). ns, not significant, *, P < 0.05; **, P < 0.01; ****, P < 0.0001.
Figure 6.
Figure 6.. Th1 cells and IFN-γ drive the activation of myeloid cells and lung epithelial cells.
a, UMAP projection of 25,622 total lung cells clustered from scRNA-seq of day 0 and 21 BCG IV vaccinated mice. Alveolar type II pneumocytes (ATII), myeloid cells, and CD4+ T cells are highlighted in red circles. b, UMAP projection colored by scaled expression of markers. c, Differentially expressed genes (DEGs) at day 21 versus day 0 (absolute log2FC > 0.25, FDR < 0.05; differential analysis performed by Wilcoxon rank-sum test with Benjamini Hochberg (BH) correction). d, Blood transcriptional modules (BTMs) enrichment of day 21 versus day 0 DEGs from identified lung cell subsets (FDR < 0.05). Enrichment was performed using hypergeometric distribution with BH correction. e, Volcano plot showing DEGs in alveolar type II epithelial cells. Significant DEGs are highlighted in red (log2FC cutoff > 0.25; FDR cutoff < 0.05). f, Chord diagram and heatmap showing inferred IFN-γ signaling network. Edge color and arrow represents sender source and edge weights indicate interaction strength represented by computed communication probability. g, CD86 activation in lung innate cells after CD4 or IFN-γ depletion in day 21 post-BCG IV vaccinated mice. Data representative of one independent experiment; n=5 (BCG+Isotype), n=6 (Unvaccinated and BCG+anti-CD4), n=9 (BCG) in CD4 depletion; n=4 (Unvaccinated) and n=5 (rest of the groups) in IFN-γ depletion. h, Serum IFN-γ and TNF levels at day 19–21 in BCG IV vaccinated mice following CD4+ T cell depletion. Data representative of two independent experiments; n=9 (BCG), n=11 (BCG+Isotype), n=12 (rest of the groups). Statistical analysis was performed by One-way ANOVA with Tukey’s multiple comparison test; *, P < 0.05; **, P < 0.01; ***, P < 0.005; ****, P < 0.0001 (g and h). scRNA-seq data was generated from cells pooled from n=5 mice at day 21 and 0, respectively. Abbreviations: AM, Alveolar macrophage; IM, interstitial macrophage; ATI, Alveolar type I; ATII, Alveolar type II; PNEC, Pulmonary neuroendocrine cells; SMC, smooth muscle cells; Lymphatic EC, Lymphatic endothelial cells.
Figure 7.
Figure 7.. Spatial transcriptomics of CD4-dependent innate antiviral program in lungs.
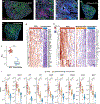
a, Representative image of GeoMx ROIs selected on BCG-vaccinated mouse lung with CD4 and pan-cytokeratin (PanCK) staining. b, Magnified image of representative ROI from BCG-vaccinated group. c, Representative image of serial lung sections stained with BCG and CD68 myeloid markers. d and e, Representative image of GeoMx lung sections from CD4-depleted BCG-vaccinated and unvaccinated groups, respectively. f and g, Ifng and key differentially expressed genes (DEGs) expressed in CD4+ cells in BCG-vaccinated and unvaccinated group detected from spatial transcriptomics using GeoMx. DEGs are taken from scRNA-seq data in Fig. 6. h and i, Interferon-stimulated gene (ISG) expression in PanCK+ epithelial cells detected from spatial transcriptomics using GeoMx. Statistical analysis was performed by unpaired, two-tailed Wilcoxon rank-sum test with Benjamini-Hochberg correction. Data representative of one independent experiment. In panel f and g, area of interest (AOIs) are plotted with n=30 (BCG), n=9 (Unvaccinated). In panel h and i, n=31 (BCG), n=20 (BCG+anti-CD4), n=15 (Unvaccinated). The box plots show median, first and third quartiles and the whiskers show 1.5x interquartile range (IQR) on either side. **, FDR < 0.01; ****, FDR < 0.0001.
Figure 8.
Figure 8.. Model depicting integrated organ immunity induced by BCG, leading to non-specific protection in the lungs.
BCG administered intravenously triggers the MyD88 pathway, resulting in a biphasic pattern of systemic innate activation and production of cytokines. Second phase of sustained innate activation occurred between day 14 to 21 post-vaccination and was synchronous with upregulated BCG-specific Th1 responses at day 21. IFN-γ secreted by Th1 cells provided a feedback signal on lung myeloid and alveolar type II cells. This mechanism imprints an innate antiviral microenvironment within the lungs that is protective against SARS-CoV-2 and influenza A.

References

    1. Pulendran B & Ahmed R Immunological mechanisms of vaccination. Nature Immunology 12, 509–517 (2011). - PMC - PubMed
    1. Aaby P et al. Non-specific beneficial effect of measles immunisation: Analysis of mortality studies from developing countries. Bmj 311, 481 (1995). - PMC - PubMed
    1. Aaby P et al. Randomized trial of BCG vaccination at birth to low-birth-weight children: Beneficial nonspecific effects in the neonatal period? J. Infect. Dis 204, 245–252 (2011). - PubMed
    1. Lund N et al. The Effect of Oral Polio Vaccine at Birth on Infant Mortality: A Randomized Trial. Clin. Infect. Dis 61, 1504–1511 (2015). - PMC - PubMed
    1. Moorlag SJCFM, Arts RJW, van Crevel R & Netea MG Non-specific effects of BCG vaccine on viral infections. Clin. Microbiol. Infect 25, 1473–1478 (2019). - PubMed

METHODS-ONLY REFERENCES

    1. Edara VV et al. Infection- and vaccine-induced antibody binding and neutralization of the B.1.351 SARS-CoV-2 variant. Cell Host Microbe 29, 516–521.e3 (2021). - PMC - PubMed
    1. Vanderheiden A et al. Type I and Type III Interferons Restrict SARS-CoV-2 Infection of Human Airway Epithelial Cultures. J. Virol 94, (2020). - PMC - PubMed
    1. Vanderheiden A et al. CCR2 Signaling Restricts SARS-CoV-2 Infection. MBio 12, (2021). - PMC - PubMed
    1. Feng Y et al. Broadly neutralizing antibodies against sarbecoviruses generated by immunization of macaques with an AS03-adjuvanted COVID-19 vaccine (2023). - PMC - PubMed
    1. Szretter KJ, Balish AL & Katz JM Influenza: Propagation, Quantification, and Storage. Curr. Protoc. Microbiol 3, (2006). - PubMed

Supplementary concepts