. 2024 Feb;56(2):234-244.
doi: 10.1038/s41588-023-01593-7. Epub 2023 Nov 30.

Polygenic profiles define aspects of clinical heterogeneity in attention deficit hyperactivity disorder

Affiliations

Polygenic profiles define aspects of clinical heterogeneity in attention deficit hyperactivity disorder

Sonja LaBianca et al. Nat Genet. 2024 Feb.

Abstract

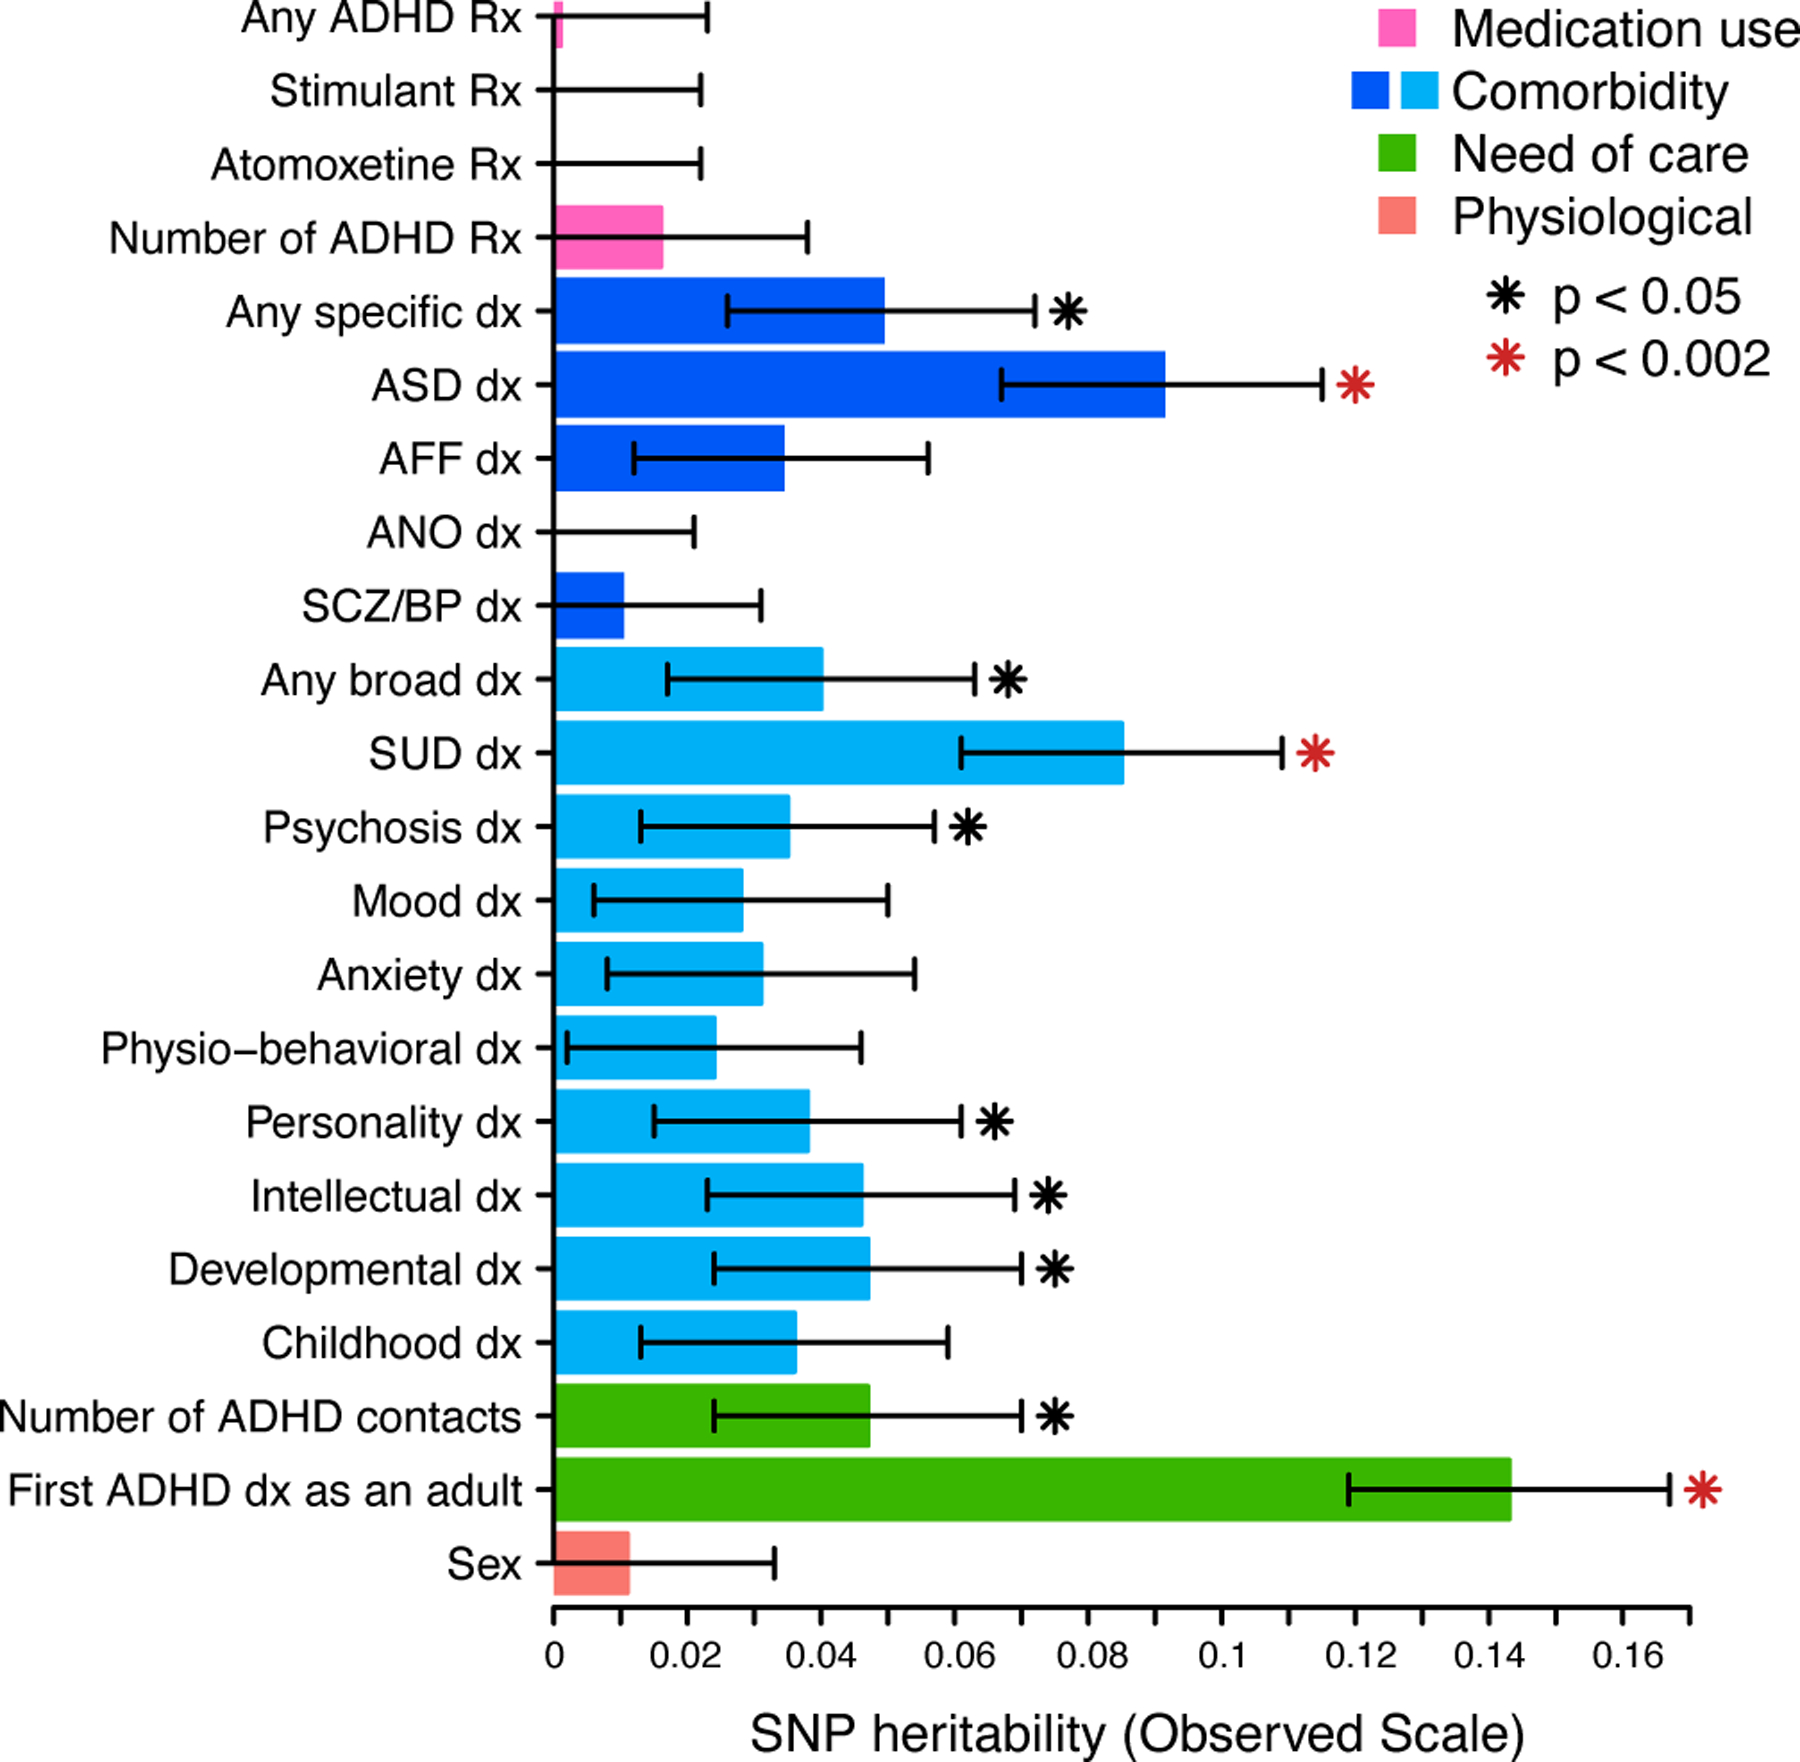
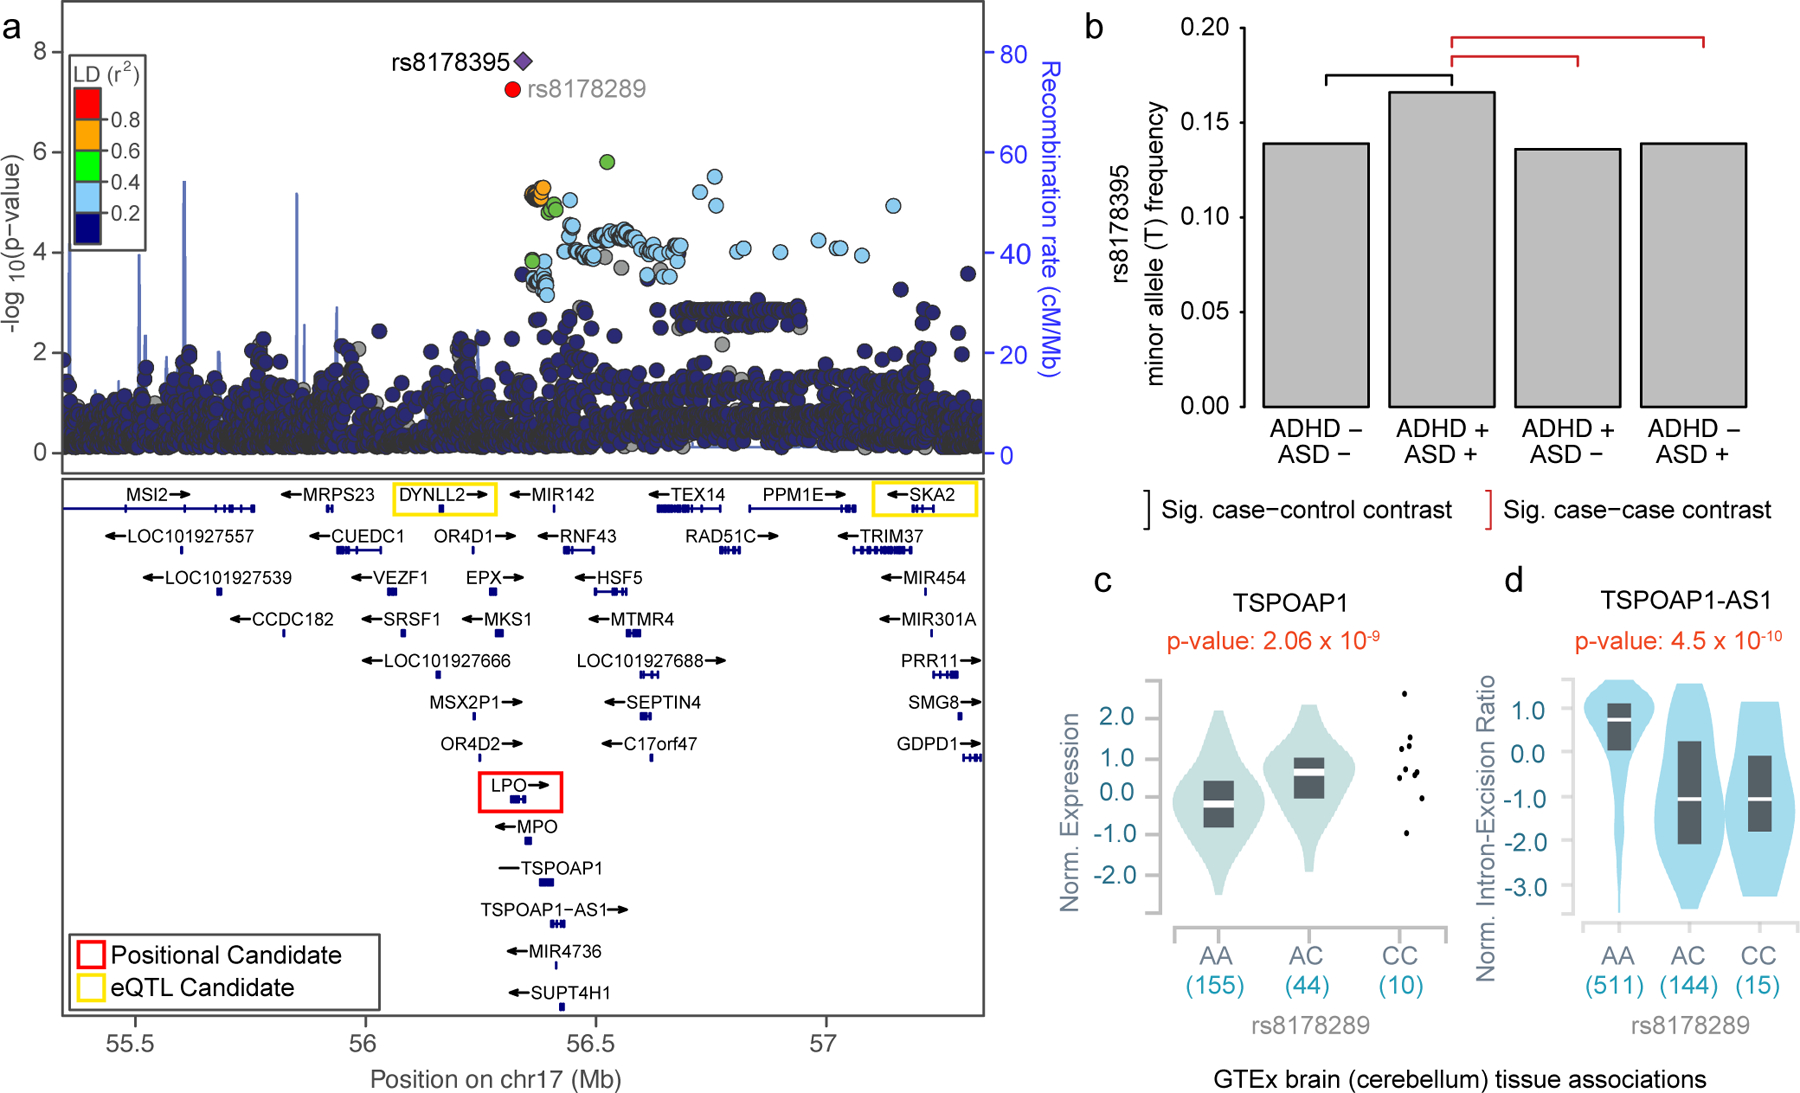
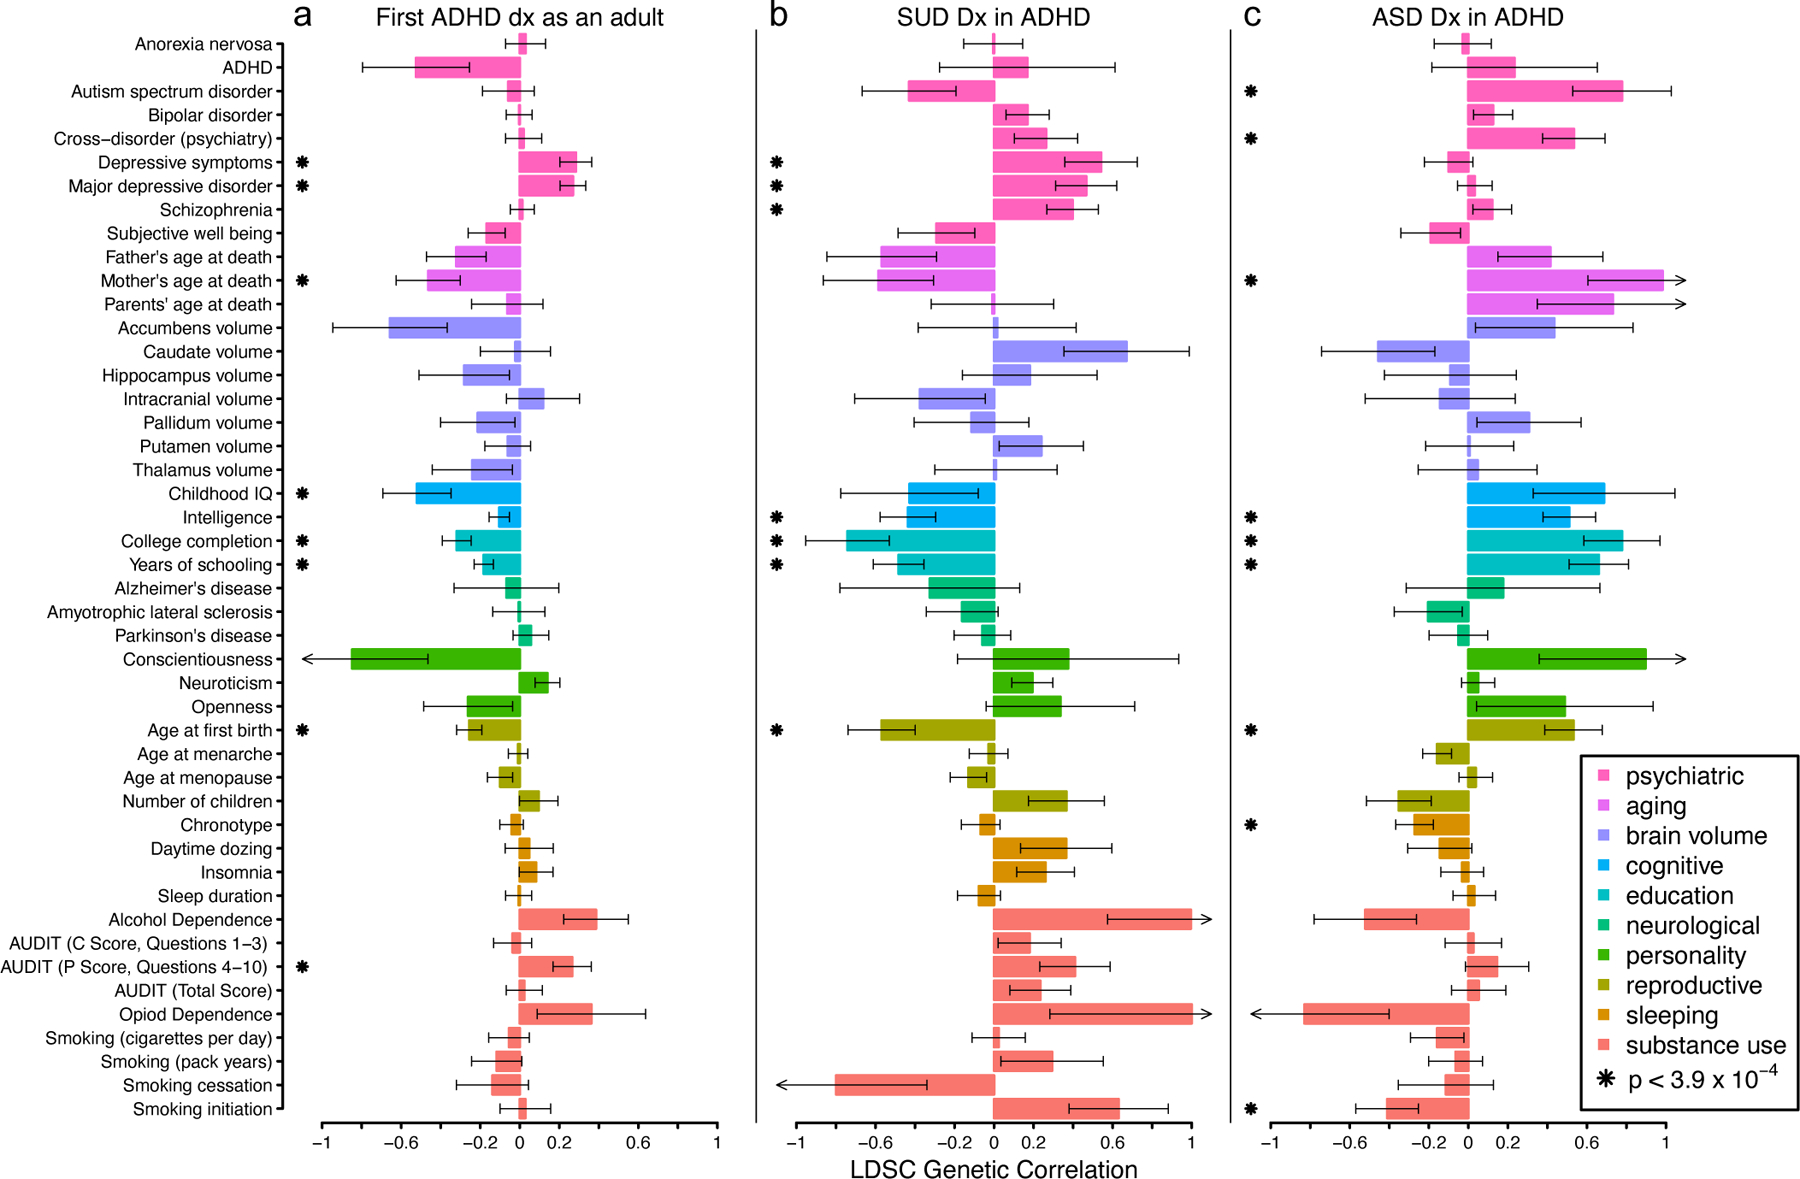
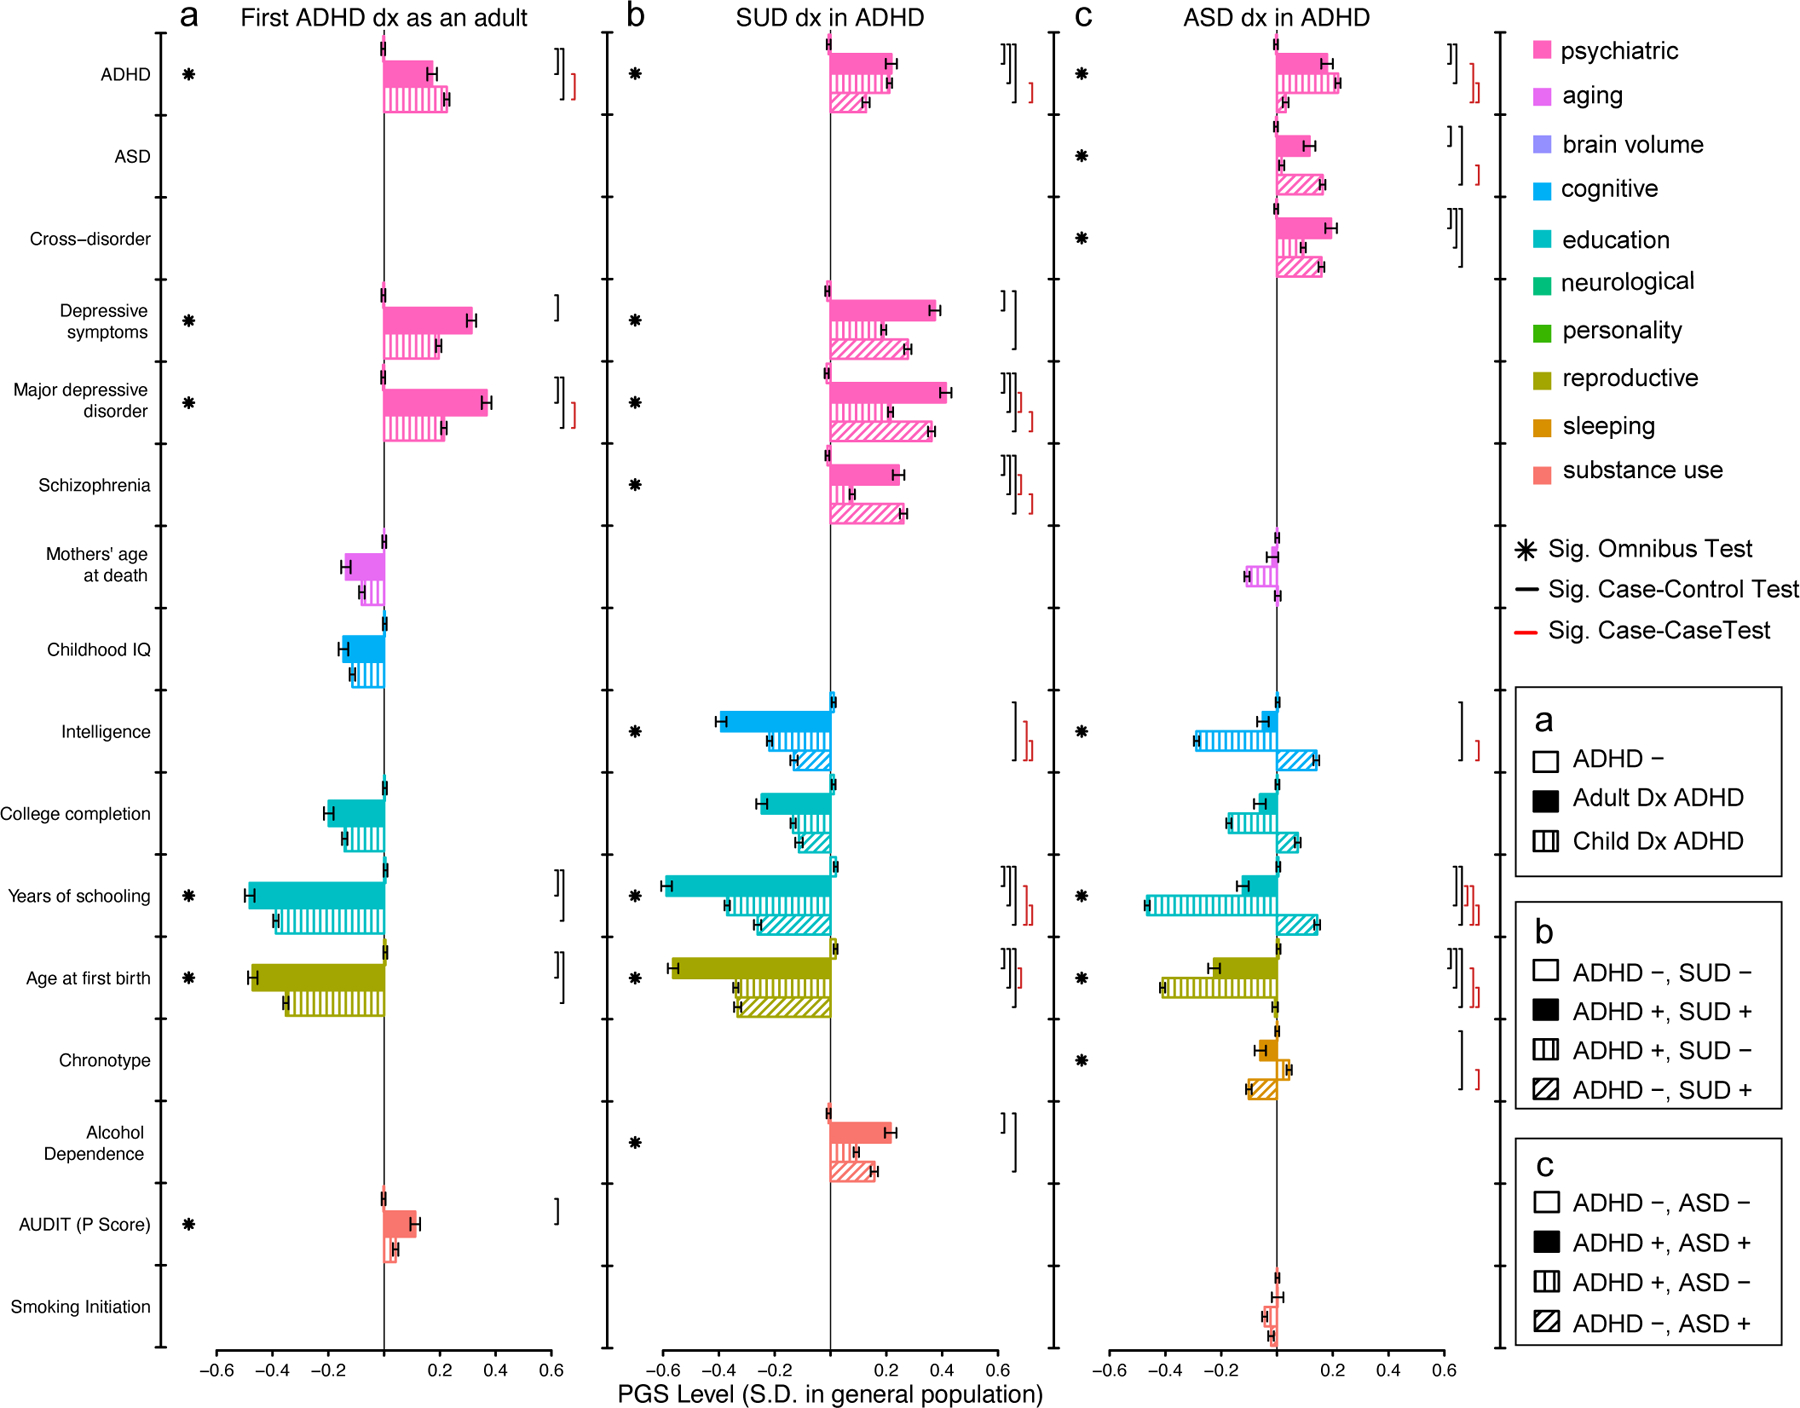
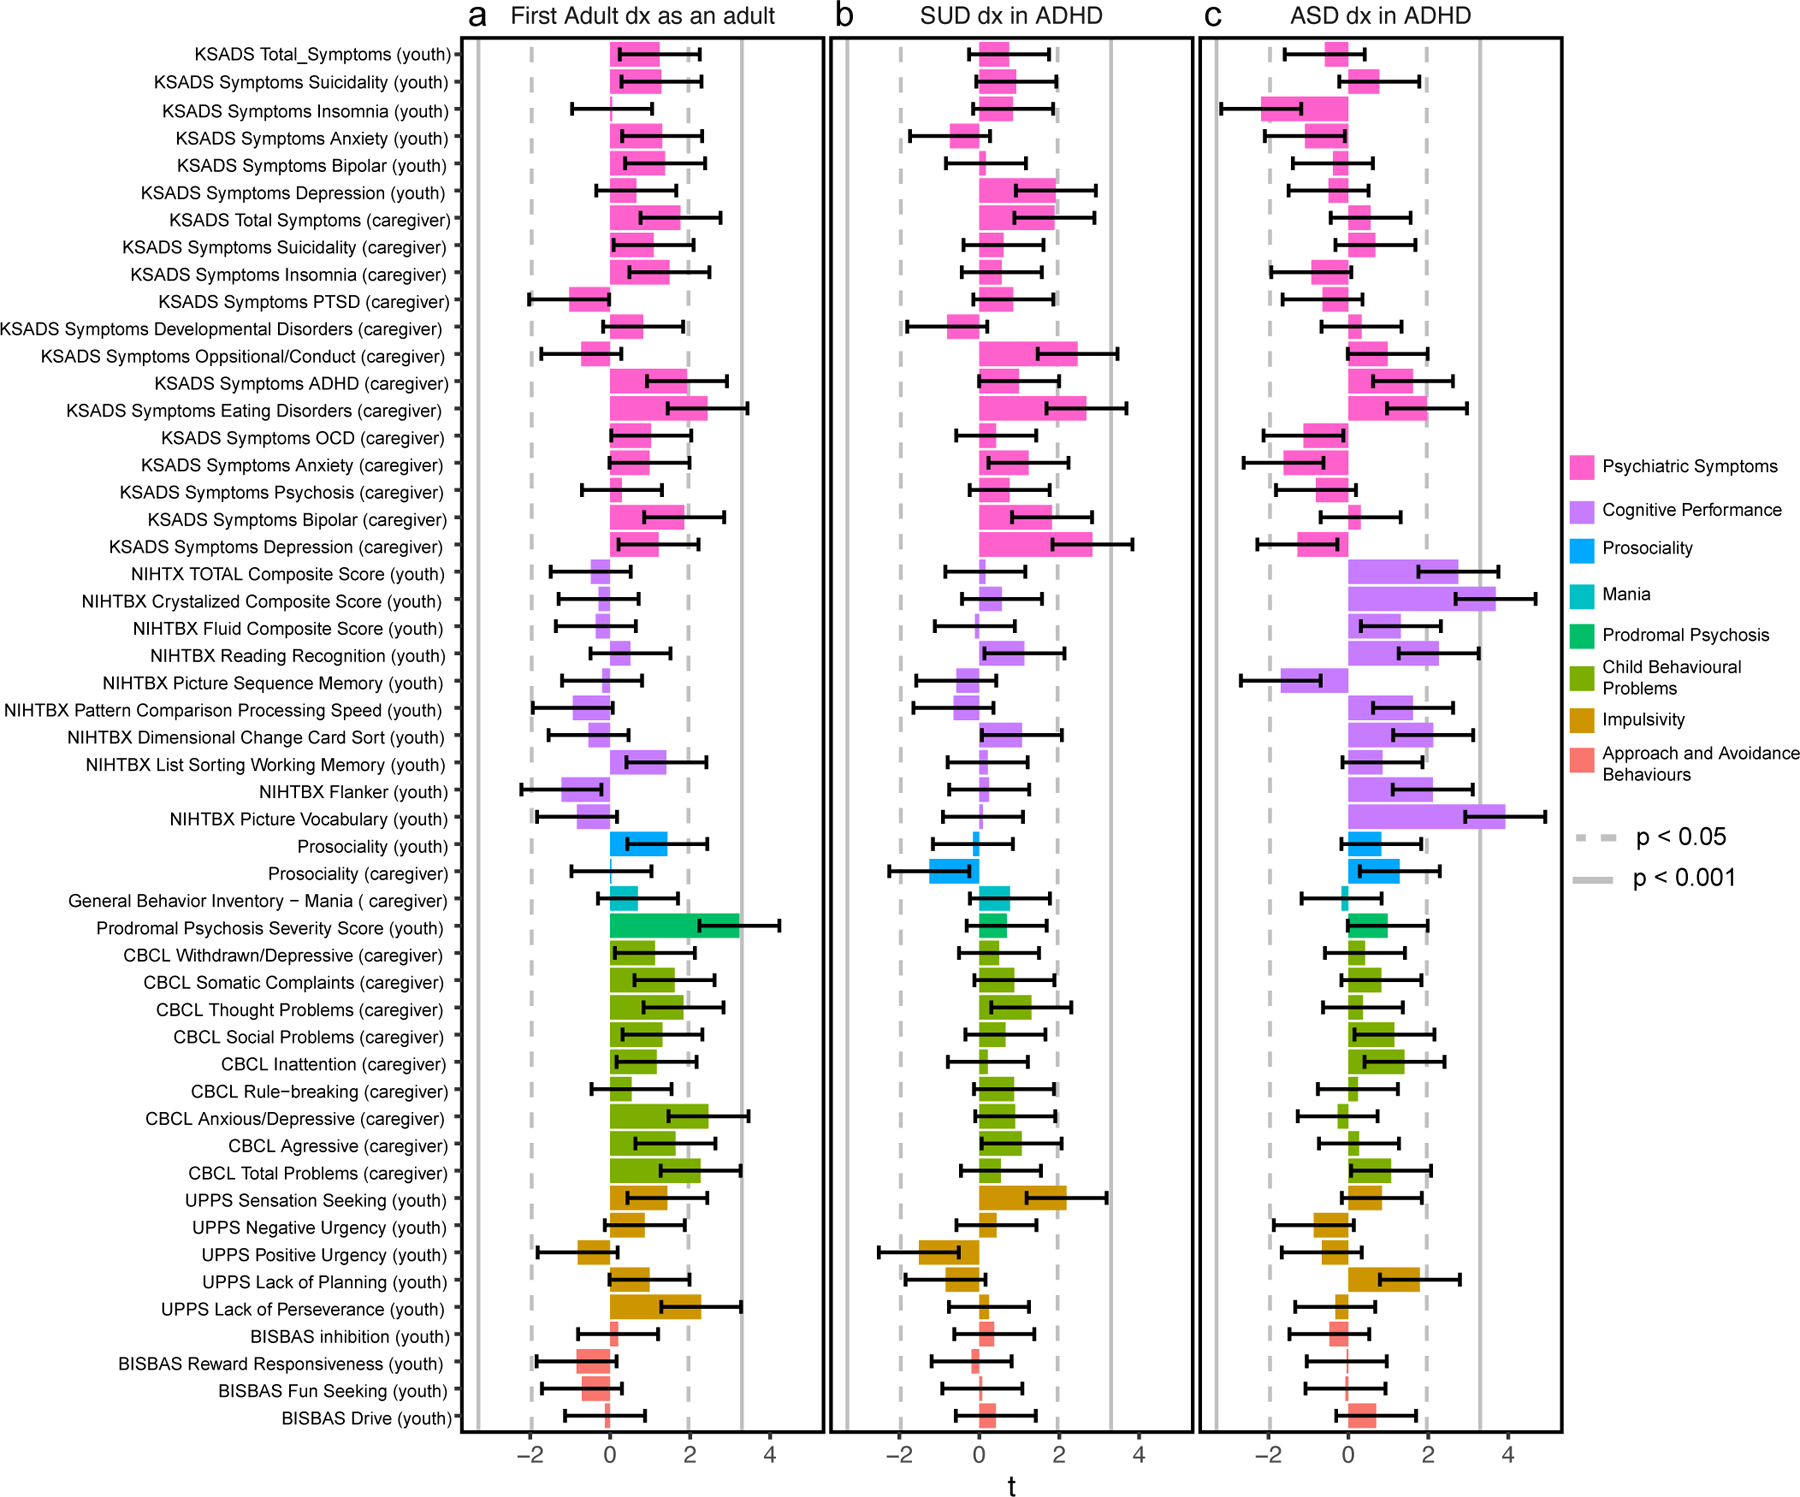
Attention deficit hyperactivity disorder (ADHD) is a complex disorder that manifests variability in long-term outcomes and clinical presentations. The genetic contributions to such heterogeneity are not well understood. Here we show several genetic links to clinical heterogeneity in ADHD in a case-only study of 14,084 diagnosed individuals. First, we identify one genome-wide significant locus by comparing cases with ADHD and autism spectrum disorder (ASD) to cases with ADHD but not ASD. Second, we show that cases with ASD and ADHD, substance use disorder and ADHD, or first diagnosed with ADHD in adulthood have unique polygenic score (PGS) profiles that distinguish them from complementary case subgroups and controls. Finally, a PGS for an ASD diagnosis in ADHD cases predicted cognitive performance in an independent developmental cohort. Our approach uncovered evidence of genetic heterogeneity in ADHD, helping us to understand its etiology and providing a model for studies of other disorders.


Conflict of interest statement

Competing Interests

The Authors declare no competing interests.

Figures

Fig. 1.
Fig. 1.. ADHD-adjacent traits associate with genetic variability among diagnosed individuals.
The same 14 084 individuals diagnosed with ADHD were repeatedly partitioned into 22 groups on the basis of ADHD-adjacent traits and the SNP-heritability (bars) of each trait was estimated with GCTA. Full statistical results and sample size for each estimate are available in Supplementary table 2. Significance (red star; p < 0.05/22=0.002) is after Bonferroni correction of one-tailed p-values from z-score tests. Error bars depict standard errors of the estimated observed scale SNP-heritability. Rx, prescription; dx, diagnosis; ADHD, attention-deficit hyperactivity disorder; ASD, autism spectrum disorders; AFF, affective disorders; ANO, anorexia; SCZ/BP, schizophrenia or bipolar disorder; SUD, substance use disorder
Fig. 2.
Fig. 2.. rs8178395 is specifically associated with an ADHD-adjacent ASD diagnosis.
a, Locus zoom of lead SNP (rs8178395) identified as genome-wide significant (two-sided p < 5×10⁻⁸) in GWAS using logistic regression comparing individuals diagnosed with both ADHD and ASD (n=2 284) to those only diagnosed with ADHD (n=11 800). LPO, DYNLL2, TSPOAP1, and SKA2 are prioritized as candidate genes according to different criteria. LD, linkage disequilibrium; cM, centimorgans; Mb, megabases; TAS, transcription association study; b, Using multinomial logistic regression, we observed the minor allele (T) of rs8178395 is significantly increased in frequency in the group of individuals diagnosed with both ADHD and ASD (ADHD +, ASD +) relative to those diagnosed with neither ADHD, nor ASD (black bracket; ADHD −, ASD −: two-tailed p=2.9×10⁻⁷) and either, exclusively (red brackets; ADHD +, ASD −: two-tailed p=2.4×10⁻⁸; ADHD −, ASD +: two-tailed p=1.0×10⁻⁶). Significance is based on multinomial logistic regression and Bonferroni correction for the 3 follow up tests. See Supplementary tables 8–9 for additional details. Sig, Significant. c, The proxy SNP for rs8178395 (rs8178289, r2 LD: 0.9) is associated with TSPOAP1 expression in brain (and other) tissue(s). d, rs8178289 is also reported as a member of a haplotype containing a splice QTL for a TSPOAP1 associated antisense RNA, TSPOAP1-AS1, in the same (and other) tissue(s). c,d, eQTL and sQTL results were visualized using the GTEx portal with two-sided, unadjusted p-values from linear regression, center line representing the median, and box spanning 1st to 3rd quartiles.
Fig. 3.
Fig. 3.. ADHD-adjacent traits share polygenes with psychiatric, cognitive, and socio-behavioral traits.
LD score regression was used to estimate the genetic correlations between ADHD-adjacent traits and a reference set of psychiatric, cognitive, and socio-behavioral traits. a, A first diagnosis of ADHD as an adult (n=3 323 cases with adult ADHD dx, n=10 761 cases with childhood ADHD dx), b, an ADHD-adjacent SUD diagnosis (n=2 627 ADHD cases with SUD dx, n=11 457 ADHD cases without SUD dx), and c, an ADHD-adjacent ASD diagnosis (n=2 284 ADHD cases with ASD dx, n=11 457 ADHD cases without ASD dx) show different patterns of genetic correlation (bars) with 46 reference traits.. Error bars denote standard error of the genetic correlation estimates, arrowheads indicate standard errors extend beyond the natural range of the estimand (>1 or < −1), and multiple comparisons were adjusted using FDR < 0.05 (corresponding to two-tailed z-score p-value < 3.9 × 10⁻⁴). See Supplementary table 15 for full statistical results and Supplementary table 28 for sample size of 46 reference GWAS. LDSC, LD score regression; FDR, false discovery rate; dx, diagnosis; ADHD, attention-deficit hyperactivity disorder; ASD, autism spectrum disorders; SUD, substance use disorder.
Fig. 4.
Fig. 4.. Profiles of polygenic scores for psychiatric, cognitive, and socio-behavioral traits define aspects of heterogeneity in ADHD.
The mean level of polygenic scores (PGS; bars) are displayed for ADHD subgroups, controls, and complementary disorder groups after centering and standardizing based on a population random sample. a. Individuals not diagnosed with ADHD (ADHD −, n=21 409), first diagnosed as an adult (1st Dx Adult, n=3 323), and first diagnosed as a child (1st Dx Child, n=10 761), b. Individuals diagnosed with neither ADHD, nor SUD (ADHD-, SUD-, n=20 509), both ADHD and SUD (ADHD+, SUD+, n=2 627), ADHD but not SUD (ADHD+, SUD-, n=11 457), and SUD but not ADHD (ADHD-, SUD+, n=5 943), and c. Individuals diagnosed with neither ADHD, nor ASD (ADHD-, ASD-, n=21 197), both ADHD and ASD (ADHD+, ASD+, n=2 284), ADHD but not ASD (ADHD+, ASD-, n=11 800), and ASD but not ADHD (ADHD-, ASD+, n=9 804), vary significantly with respect to multivariate profiles of PGS. Stars denote a significant global test (one-tailed p-value) for differences in PGS level among all groups, while brackets denote significant pairwise group contrasts (two-tailed p-value), accounting for all other PGS and 25 ancestry principle components in a joint multinomial logistic regression. Significance determined by Bonferonni correction, p<0.05/169=0.0003. Error bars denote standard error of mean. See Supplementary tables 18–20 for complete statistical results and Supplementary table 28 for details of reference GWAS used for PGS. ADHD, attention deficit hyperactivity disorder; ASD, autism spectrum disorder; SUD, substance use disorder; Dx, diagnosis; Sig., Significant, PGS, polygenic score.
Fig. 5.
Fig. 5.. Polygenes for ADHD-adjacent ASD are associated with cognitive performance in an independent, typically developing cohort.
Polygenic scores (PGS) constructed using summary statistics from ADHD-adjacent trait GWAS were tested in generalized linear models (GLM) for association with cognitive, behavioral, and psychiatric traits in n=5 449 nine or ten year-old children from the Adolescent brain cognitive development (ABCD) Study. The t-statistic of each regression (bars) reveals no significant associations for a PGS for adult diagnosed ADHD or b ADHD-adjacent SUD, although consistent trends are prevalent, but c the PGS for an ADHD-adjacent ASD diagnosis associated significantly with cognitive performance, replicating our previous finding that polygenes are shared among these two domains. Error bars depict standard deviation of the t-statistic. Two-tailed p-values were declared significant after Bonferroni correction (p<0.05/51=0.001;solid line) and suggestive with nominal trends(p<0.05; dotted line). Caregiver or youth in parenthesis denotes the informant for the assessment of the child. t, t-statistic. See Supplementary table 27 for complete statistical results and Supplementary table 28 for a description of the questionnaire used for each ABCD assessment.

References

    1. American Psychiatric Association. DSM-5 Task Force. Diagnostic and Statistical Manual of Mental Disorders: DSM-5. (CBS Publishers & Distributors, Pvt. Limited, 2017).
    1. World Health Organization. The ICD-10 Classification of Mental and Behavioural Disorders: Clinical Descriptions and Diagnostic Guidelines. (World Health Organization, 1992).
    1. World Health Organization. The ICD-10 Classification of Mental and Behavioural Disorders: Diagnostic criteria for research. 1. ed. (WHO, 1993).
    1. Franke B et al. Live fast, die young? A review on the developmental trajectories of ADHD across the lifespan. Eur. Neuropsychopharmacol 28, 1059–1088 (2018). - PMC - PubMed
    1. Luo Y, Weibman D, Halperin JM & Li X A Review of Heterogeneity in Attention Deficit/Hyperactivity Disorder (ADHD). Front. Hum. Neurosci 13, 42 (2019). - PMC - PubMed

MeSH terms