. 2023 Dec;55(12):2056-2059.
doi: 10.1038/s41588-023-01574-w. Epub 2023 Nov 30.

Personal transcriptome variation is poorly explained by current genomic deep learning models

Affiliations

Personal transcriptome variation is poorly explained by current genomic deep learning models

Connie Huang et al. Nat Genet. 2023 Dec.

Abstract

Genomic deep learning models can predict genome-wide epigenetic features and gene expression levels directly from DNA sequence. While current models perform well at predicting gene expression levels across genes in different cell types from the reference genome, their ability to explain expression variation between individuals due to cis-regulatory genetic variants remains largely unexplored. Here, we evaluate four state-of-the-art models on paired personal genome and transcriptome data and find limited performance when explaining variation in expression across individuals. In addition, models often fail to predict the correct direction of effect of cis-regulatory genetic variation on expression.


Conflict of interest statement

The authors declare no competing interests.

Figures

Fig. 1
Fig. 1. Cross-gene versus cross-individual gene expression prediction.
a, Overview of our approach, illustrating the cross-gene (blue) and cross-individual (green) measures of performance. Colored nucleotides on the left represent genetic variants present in each example individual. b, Performance of all tested models on reference sequence prediction, cross-gene prediction and cross-individual prediction. Bar heights represent means and error bars represent s.d. over all individuals (n = 421) for cross-gene Spearman rank correlation or over all genes (n = 3,259) for cross-individual Spearman rank correlation. c, Distribution of Enformer cross-gene Spearman rank correlations for all individuals (left histogram) and Enformer cross-individual Spearman rank correlations for all genes (right histogram). Histograms for the other tested models are shown in Extended Data Figs. 2 and 3. d, Example genes with strong positive cross-individual correlation (SLFN5) and strong negative cross-individual correlation (SNHG5) of observed and predicted expression for Enformer.
Fig. 2
Fig. 2. Models often disagree on predicted direction of effect of cis-regulatory variation.
a, Predictions from all four deep learning models on an example gene, SNHG5, that has strong negative cross-individual correlations for Enformer, Basenji2 and ExPecto, and positive cross-individual correlation for Xpresso. Points are colored by the corresponding individual’s dosage of the most statistically significant eQTL for this gene. Dashed lines indicate the predicted expression levels of the reference (Ref) and alternate (Alt) alleles of the most statistically significant eQTL. b, Comparison of cross-individual Spearman rank correlations for Enformer versus other models. A kernel density estimate of each scatterplot is overlaid (red). Note the increased density of genes along the y = x and y = −x axes. Related plots for all pairs of models are shown in Extended Data Fig. 4. c, Cross-individual Spearman rank correlations for Enformer compared with the P value of the most statistically significant eQTL in each gene (top left), the distance to the TSS for that eQTL (top right), the median observed expression level of the gene (bottom left) and the coefficient of variation of the predicted expression levels of the gene (bottom right). Note that negative cross-individual correlations are observed even for genes with strong eQTLs. For each plot, Pearson correlations and lines of best fit using ordinary least squares are shown in black when computed using all genes, and in orange or green when computed using only genes with positive or negative cross-individual correlations, respectively. Related plots for all tested models are shown in Extended Data Figs. 5–10.
Extended Data Fig. 1
Extended Data Fig. 1. Performance of all tested models on reference sequence prediction.
Median Geuvadis gene expression (log transformed) versus gene expression predictions (log transformed) obtained by inputting the reference genome sequence to (a) Enformer, (b) Basenji2, (c) ExPecto, and (d) Xpresso. For each model, gene expression predictions from the most relevant cell type were used, as described in Methods. Measurements and predictions for the 3,259 genes with at least one statistically signficant (FDR < 5%) eQTL in the Geuvadis analysis are displayed.
Extended Data Fig. 2
Extended Data Fig. 2. Performance of all tested models on cross-gene prediction.
Cross-gene performance for (a) Enformer, (b) Basenji2, (c) ExPecto, and (d) Xpresso. For a given individual, cross-gene performance is defined as the correlation between their measured gene expression levels and gene expression predictions obtained using their personalized genome sequences. Correlations were computed across the 3,259 genes with at least one statistically signficant (FDR < 5%) eQTL in the Geuvadis analysis. Each histogram displays the distribution of cross-gene performance over all individuals.
Extended Data Fig. 3
Extended Data Fig. 3. Performance of all tested models on cross-individual prediction.
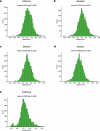
Cross-individual performance for (a) Enformer, (b) Basenji2, (c) ExPecto, (d) Xpresso, and (e) PrediXcan. For a given gene, cross-individual performance is defined as the correlation between measured gene expression levels in all 421 individuals and corresponding gene expression predictions obtained using each individual’s personalized genome sequence. Each histogram displays the distribution of cross-individual performance for the 3,259 genes with at least one statistically signficant (FDR < 5%) eQTL in the Geuvadis analysis.
Extended Data Fig. 4
Extended Data Fig. 4. Pairwise model comparisons of cross-individual correlation.
Comparison of cross-individual Spearman correlations between each pair of models: (a) Enformer & Basenji2, (b) Enformer & ExPecto, (c) Enformer & Xpresso, (d) Basenji2 & ExPecto, (e) Basenji2 & Xpresso, (f) ExPecto & Xpresso, (g) Enformer & PrediXcan, (h) Basenji2 & PrediXcan, (i) ExPecto & PrediXcan, and (j) Xpresso & PrediXcan. The scatterplots display, for each gene, the performance achieved by both models. A kernel density estimate of each scatterplot is overlaid (red). Note the increased density of genes along the y = x and y = -x axes.
Extended Data Fig. 5
Extended Data Fig. 5. Cross-individual correlation vs. top eQTL p-value for all tested models.
Cross-individual correlations for (a) Enformer, (b) Basenji2, (c) ExPecto, and (d) Xpresso compared to the p-value of the most statistically significant Geuvadis eQTL in each gene. For each model, the Pearson correlation and line of best fit using ordinary least squares are shown separately for genes with positive and negative cross-individual correlations (orange and green, respectively).
Extended Data Fig. 6
Extended Data Fig. 6. Cross-individual correlation vs. top eQTL effect size for all tested models.
Cross-individual correlations for (a) Enformer, (b) Basenji2, (c) ExPecto, and (d) Xpresso compared to the absolute value of the effect size of the most statistically significant Geuvadis eQTL in each gene. For each model, the Pearson correlation and line of best fit using ordinary least squares are shown separately for genes with positive and negative cross-individual correlations (orange and green, respectively).
Extended Data Fig. 7
Extended Data Fig. 7. Cross-individual correlation vs. top eQTL allele frequency for all tested models.
Cross-individual correlations for (a) Enformer, (b) Basenji2, (c) ExPecto, and (d) Xpresso compared to the global minor allele frequency (from Ensembl biomaRt) of the most statistically significant Geuvadis eQTL in each gene. For each model, the Pearson correlation and line of best fit using ordinary least squares are shown separately for genes with positive and negative cross-individual correlations (orange and green, respectively).
Extended Data Fig. 8
Extended Data Fig. 8. Cross-individual correlation vs. top eQTL distance to TSS for all tested models.
Cross-individual correlations for (a) Enformer, (b) Basenji2, (c) ExPecto, and (d) Xpresso compared to the distance between each gene’s TSS and its most statistically significant Geuvadis eQTL. For each model, the Pearson correlation and line of best fit using ordinary least squares are shown separately for genes with positive and negative cross-individual correlations (orange and green, respectively).
Extended Data Fig. 9
Extended Data Fig. 9. Cross-individual correlation vs. median gene expression for all tested models.
Cross-individual correlations for (a) Enformer, (b) Basenji2, (c) ExPecto, and (d) Xpresso compared to the median Geuvadis gene expression level (log transformed) for each gene. For each model, the Pearson correlation and line of best fit using ordinary least squares are shown.
Extended Data Fig. 10
Extended Data Fig. 10. Cross-individual correlation vs. predicted expression dispersion for all tested models.
Cross-individual correlations for (a) Enformer, (b) Basenji2, (c) ExPecto, and (d) Xpresso compared to the log coefficient of variation (log σ/μ), a measure of dispersion, in the model predictions for each gene. For each model, the Pearson correlation and line of best fit using ordinary least squares are shown.

References

    1. Kelley DR, et al. Sequential regulatory activity prediction across chromosomes with convolutional neural networks. Genome Res. 2018;28:739–750. doi: 10.1101/gr.227819.117. - DOI - PMC - PubMed
    1. Zhou J, et al. Deep learning sequence-based ab initio prediction of variant effects on expression and disease risk. Nat. Genet. 2018;50:1171–1179. doi: 10.1038/s41588-018-0160-6. - DOI - PMC - PubMed
    1. Agarwal V, Shendure J. Predicting mRNA abundance directly from genomic sequence using deep convolutional neural networks. Cell Rep. 2020;31:107663. doi: 10.1016/j.celrep.2020.107663. - DOI - PubMed
    1. Avsec Ž, et al. Effective gene expression prediction from sequence by integrating long-range interactions. Nat. Methods. 2021;18:1196–1203. doi: 10.1038/s41592-021-01252-x. - DOI - PMC - PubMed
    1. Fudenberg, G., Kelley, D. R. & Pollard, K. S. Predicting 3D genome folding from DNA sequence with Akita. Nat. Methods17, 1111–1117 (2020). - PMC - PubMed