. 2024 Apr;21(4):648-656.
doi: 10.1038/s41592-023-02085-6. Epub 2023 Nov 30.

StayGold variants for molecular fusion and membrane-targeting applications

Affiliations

StayGold variants for molecular fusion and membrane-targeting applications

Ryoko Ando et al. Nat Methods. 2024 Apr.

Abstract

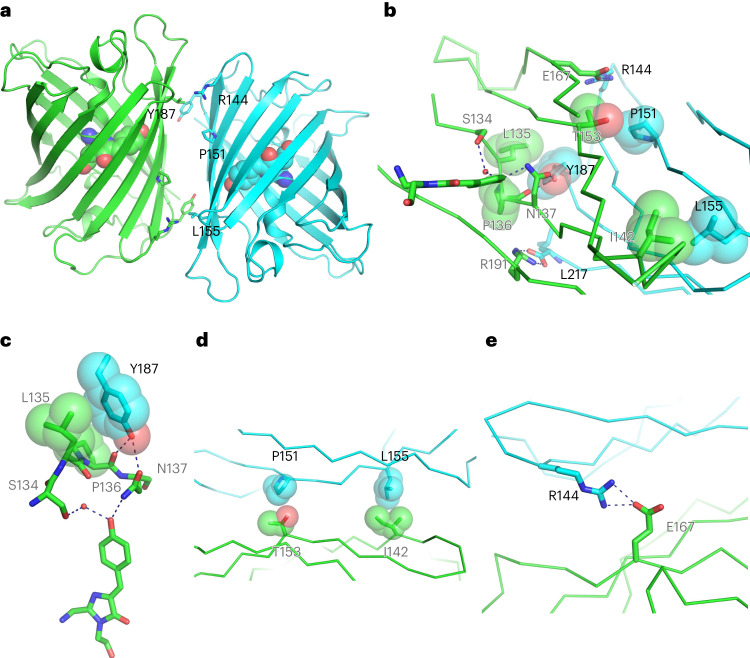
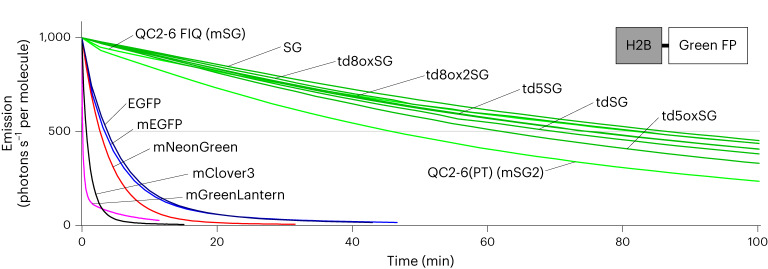
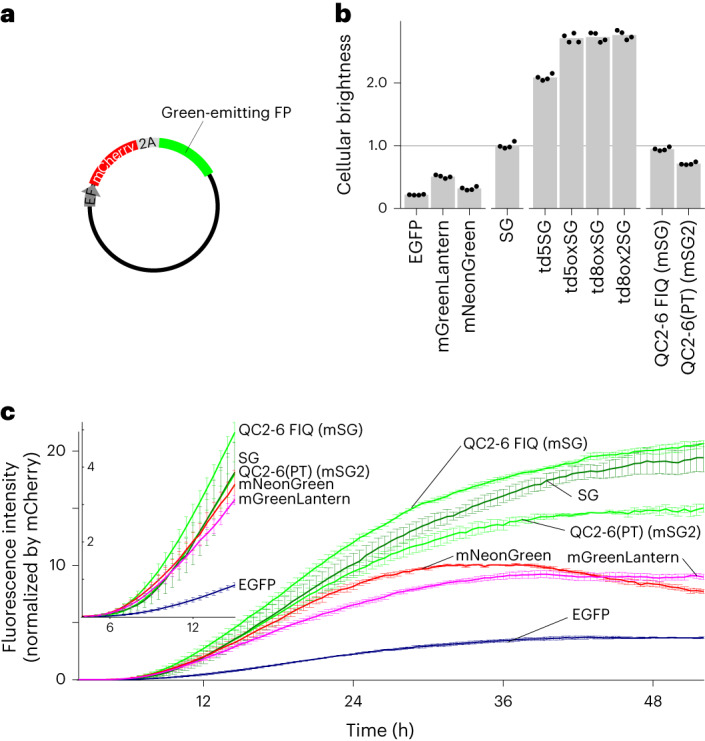
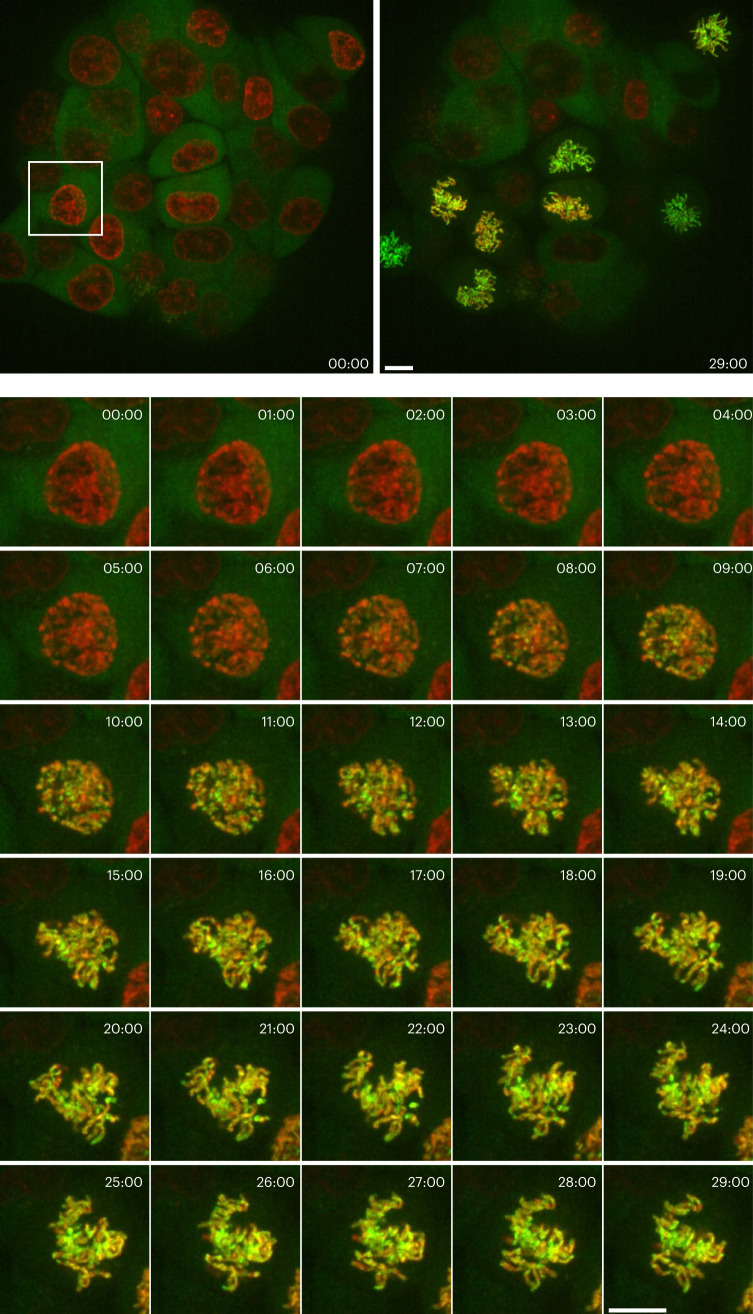
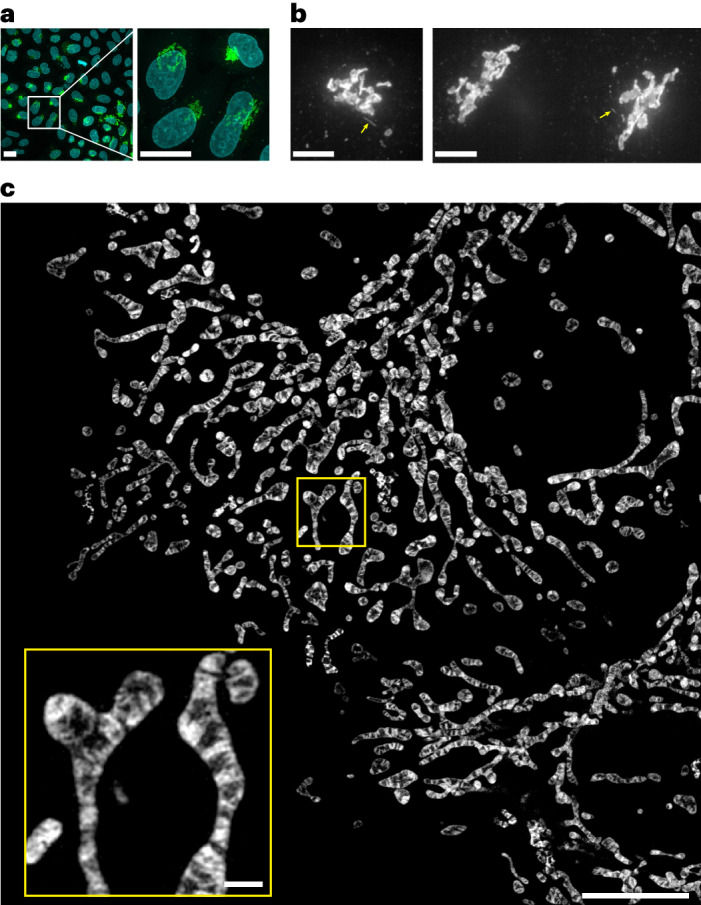
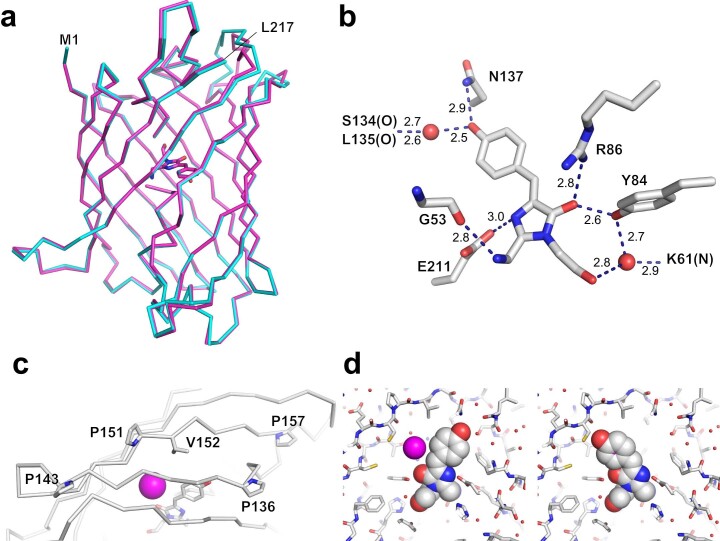
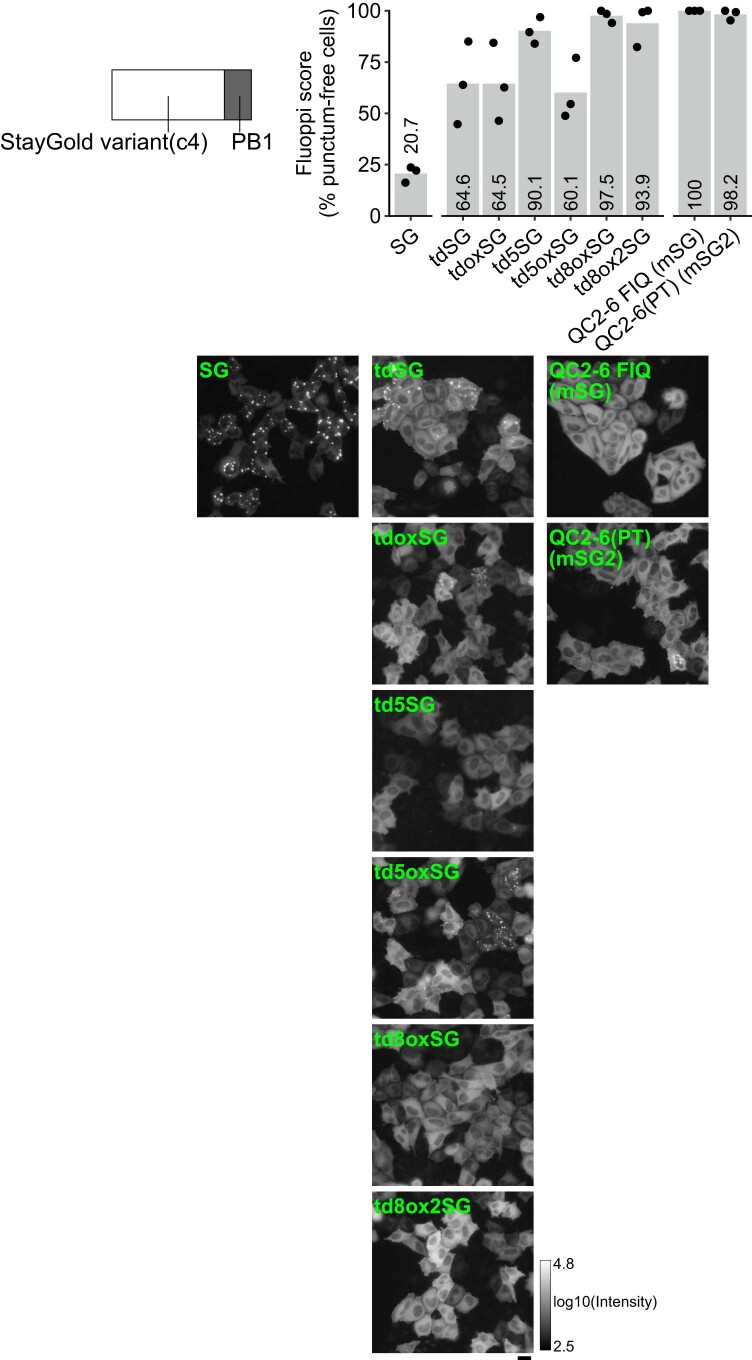
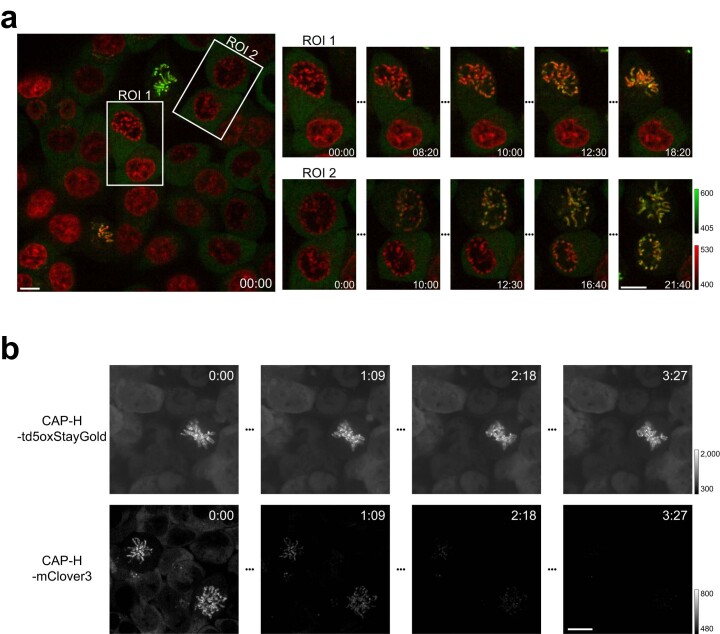
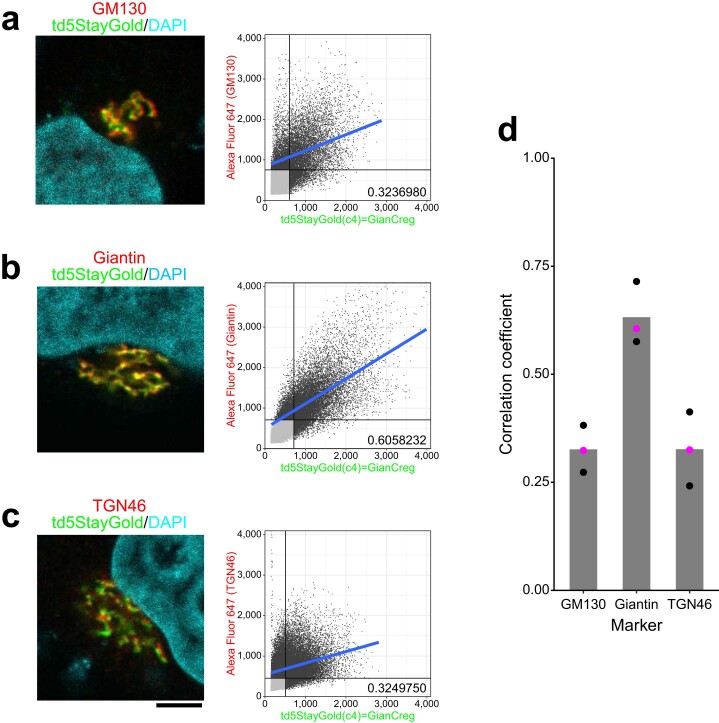
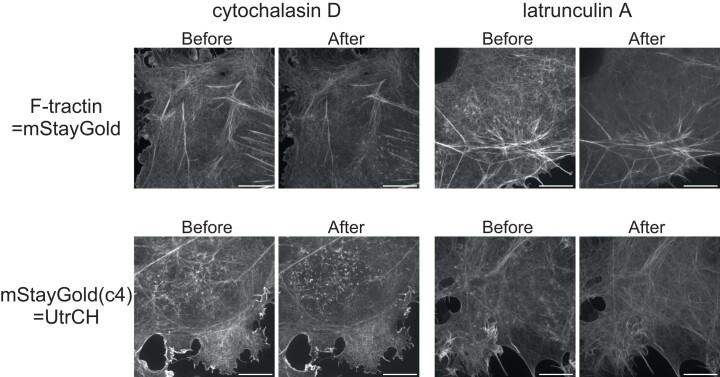
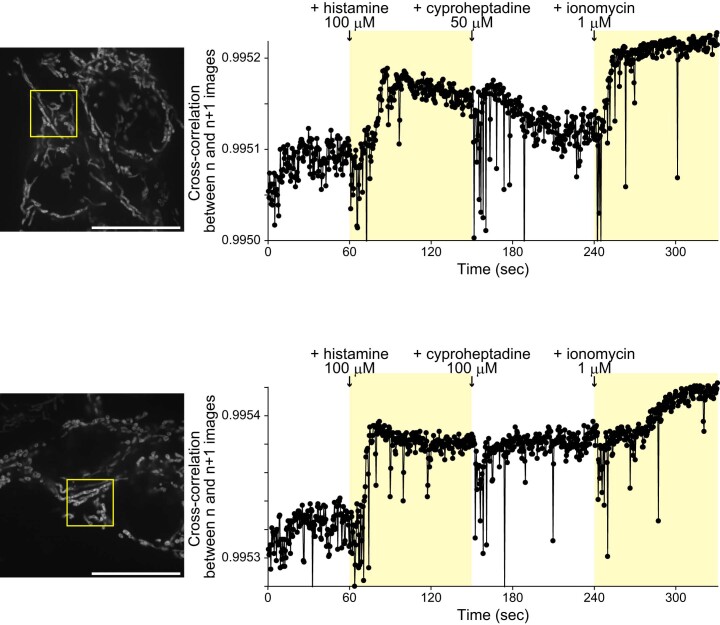
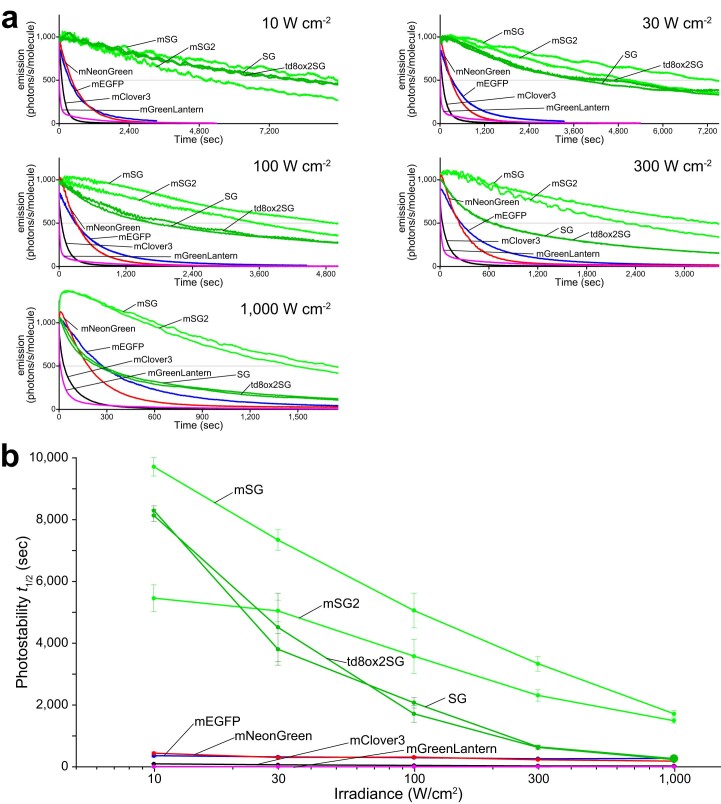
Although StayGold is a bright and highly photostable fluorescent protein, its propensity for obligate dimer formation may hinder applications in molecular fusion and membrane targeting. To attain monovalent as well as bright and photostable labeling, we engineered tandem dimers of StayGold to promote dispersibility. On the basis of the crystal structure of this fluorescent protein, we disrupted the dimerization to generate a monomeric variant that offers improved photostability and brightness compared to StayGold. We applied the new monovalent StayGold tools to live-cell imaging experiments using spinning-disk laser-scanning confocal microscopy or structured illumination microscopy. We achieved cell-wide, high-spatiotemporal resolution and sustained imaging of dynamic subcellular events, including the targeting of endogenous condensin I to mitotic chromosomes, the movement of the Golgi apparatus and its membranous derivatives along microtubule networks, the distribution of cortical filamentous actin and the remolding of cristae membranes within mobile mitochondria.


Conflict of interest statement

R.A., M.H. and A.M. are inventors on Japanese patent application no. 2021-065373 that covers the creation and use of StayGold. The remaining authors declare no competing interests.

Figures

Fig. 1
Fig. 1. Dimeric structure of StayGold.
a, Side view of the overall structure of the AC dimer with the chromophores (space-filling representation) and mutated residues (side chains) at the interface (stick representation). be, The dimer interface viewed from A protomer (b). Interacting side chains and the chromophore are represented in stick format. There is a salt bridge of Leu217 of C protomer and Arg191 of A protomer. Other interactions are resolved in three images (ce) viewed from different angles. Detailed view of the interaction between Tyr187 (C protomer) and a four-amino-acid stretch (134SLPN137) that anchors the chromophore apex (A protomer) (c). Hydrophobic contact sites between Pro151 of C protomer and Thr153 of A protomer and between Leu155 of C protomer and Ile142 of A protomer (d). A salt bridge between Arg144 of C protomer and Glu167 of A protomer (e). One protomer (A) is shown in green and the other (C) in light blue (ae). The atoms are color-coded as follows: carbon, green (A protomer) or light blue (C protomer); oxygen, red; nitrogen, blue. Mutated residues are displayed on the C protomer with black letters. The opposed residues are displayed on the A protomer with gray letters. The peptide backbones are shown in cartoon format (a) or as tubes (b, d and e). Hydrophobic interactions are shown with van der Waals surfaces of the side chains (bd). Polar interactions are shown as dashed lines (b, c and e). See Extended Data Fig. 4.
Fig. 2
Fig. 2. Photostability of StayGold variants and reference green-emitting FPs in live cells.
Plot of intensity versus normalized total exposure time, with an initial emission rate of 1,000 photons s−1 per molecule. FPs were expressed as fusions to H2B in HeLa cells. Illumination intensity, 8.66 W cm−2. The curves shown are representative of three repetitions (n = 3 independent experiments). The statistical values of t1/2 (time for photobleaching from an initial emission rate of 1,000 photons s−1 per molecule down to 500) are shown in Table 1. SG, StayGold. Curves are colored as follows. QC2-6 FIQ (mSG) and QC2-6(PT) (mSG2), green; SG and its tandem dimers, dark green; EGFP, dark blue; mEGFP, blue; mNeonGreen, red; mClover3, black; mGreenLantern, magenta. Intensity-normalized curves are shown in Supplementary Fig. 6. Source data
Fig. 3
Fig. 3. Brightness of StayGold variants and reference green-emitting FPs in live cells.
a, Cotranslation of green-emitting FP with mCherry using the bicistronic coexpression system. Transfection was performed with pCSII-EF/mCherry-T2A-green-emitting FP. b, Cellular brightness 48 h after transfection. The green fluorescence was corrected for the mCherry fluorescence and spectral throughput (Supplementary Fig. 7) and normalized to that of StayGold (Supplementary Table 2). Transfection was repeated four times; the mean values are shown by gray bars and are reported in Table 1 (cellular brightness). c, Fluorescence development after transfection. Side-by-side comparison of six green-emitting FPs for their chromophore maturation using an automated time-lapse imaging system that accommodates a six-well plate. The green fluorescence was corrected for the mCherry fluorescence (t = 48 h) (Supplementary Note 8) and spectral throughput (Supplementary Fig. 8). Data points are shown as mean ± s.e.m. (n = 3 independent experiments). Curves are colored as follows. QC2-6 FIQ (mSG) and QC2-6(PT) (mSG2), green; SG, dark green; EGFP, dark blue; mNeonGreen, red; mGreenLantern, magenta. Inset shows curves during the early stage. Source data
Fig. 4
Fig. 4. Visualization of chromosome targeting of td5oxStayGold-tagged condensin I at low copy number expressed via a genome-editing technique.
After release from cell cycle arrest, genome-edited HCT116 cells (#897) were imaged for CAP-H-td5oxStayGold (at 488 nm excitation) and SiR-DNA-labeled chromosomes (at 637 nm excitation) using spinning-disk LSCM (SpinSR10) at the indicated times (min:s). Every 1 min, three-dimensional (3D) scanning was executed with a z step size of 1 μm over an axial range of 13 μm and the green and far-red fluorescence images were merged. Maximum intensity projection (MIP) images are shown. Time-series image data of the cell (bottom) boxed in the entire field of view (top). Representative of n = 3 independent experiments. Scale bars, 10 μm. See Supplementary Video 2.
Fig. 5
Fig. 5. Visualization of td5StayGold-harboring Golgi membranes and mStayGold-harboring inner mitochondrial membranes.
a, Confocal images of td5StayGold(c4)=GianCreg (green) and DAPI (cyan) in fixed HeLa cells. A MIP image (20 slices, 1.0-μm z step). Low (left) and high (right) magnifications. Scale bars, 20 μm. b, Volumetric and continuous imaging of HeLa cells expressing td5StayGold(c4)=GianCreg by SDSRM (SpinSR10) revealed the occurrence of fast-moving tubular structures that emerged from the Golgi apparatus (yellow arrows). Two independent experiments (left and right). Scale bars, 5 μm. See Supplementary Video 5. Similar results were obtained from 17 other independent cultured cell samples. c, A MIP of HeLa cells expressing COX8a=mStayGold. Cells were 3D scanned with a z step size of 0.11 μm over an axial range of 2.08 μm by lattice SIM (Elyra 7). SIM2 was used for image reconstruction. This MIP corresponds to the image at t = 126 s in Supplementary Video 9. Scale bars, 10 μm, 1 μm (inset). Representative of n = 3 independent samples.
Extended Data Fig. 1
Extended Data Fig. 1. OSER assay for assessment of monomericity and dispersibility of StayGold variants and reference FPs.
HeLa cells transfected with constructs encoding CytERM-FP were imaged using wide-field (WF) microscopy. StayGold is abbreviated as SG. The constructs are grouped into four categories: eight reference FPs, StayGold, tandem dimers, and monomers, from left to right. For each construct, the percentage of cells scored without visible whorl structures is plotted (black dots) (top) and one representative close-up image is shown (bottom). The logarithmic gray scale (2.0–4.8) indicates that the lowest and highest fluorescence intensities of all the images are 102.0 and 104.8, respectively. Transfection was repeated three times; the mean scores are shown by gray bars with numerical values (top). Scale bar, 20 µm. Source data
Extended Data Fig. 2
Extended Data Fig. 2. Fluoppi assay for assessment of monomericity and dispersibility of StayGold variants and reference FPs for C-terminal tagging.
HeLa cells transfected with constructs encoding PB1-FP were imaged using WF microscopy. StayGold is abbreviated as SG. The constructs are grouped into four categories: eight reference FPs, SG, tandem dimers, and monomers, from left to right. For each construct, the percentage of cells scored without fluorescent puncta is plotted (black dots) (top) and one representative close-up image is shown (bottom). The logarithmic gray scale (2.5–4.8) indicates that the lowest and highest fluorescence intensities of all the images are 102.5 and 104.8, respectively. Transfection was repeated three times; the mean scores are shown by gray bars with numerical values (top). Scale bar, 20 µm. Source data
Extended Data Fig. 3
Extended Data Fig. 3. The evolution from (n1)StayGold to monomeric (top) and tandem dimer (bottom) variants.
StayGold (SG) and its variants are distinctly colored as follows. SG: khaki, oxSG: light green, ox2SG: dark sea-green, QC2-6: seafoam blue, QC2-6 FIQ (mSG): light blue. Adaptors and linkers are represented with the following deep colors. n1: black, c4: orange red, PT: purple, linker (for tandem construction): gray. #The 21-residue linker (gray) was composed of a 12-residue linker (GHGTGSTGSGSS) and a possibly protease-resistant linker. *Although we used two linkers of 13 and 22 residues reported in the tdTomato publication to generate td6oxSG and td7oxSG, respectively, neither of them matched td5oxSG. See Supplementary Fig. 3. Except QT2-6(PT) (mSG2), all the constructs shown here are used with no tagging or for tagging the C terminus of a host protein and thus have no c4 adaptor at their C-termini; please see Supplementary Fig. 14 concerning tagging the N terminus of a host protein.
Extended Data Fig. 4
Extended Data Fig. 4. Crystal structure of StayGold.
StayGold crystallized at pH 8.5 in space group P21 and diffracted to 1.56 Å. The final model has an Rwork of 18.63% and an Rfree of 21.53%. StayGold also crystallized at pH 5.6 in space group P61 and diffracted to 2.2 Å with the final model having an Rwork of 15.47% and an Rfree of 18.97%. See Supplementary Table 1 for a summary of the refinement statistics and model quality. The coordinates and structure factors have been deposited in the PDB data base (pH 8.5, entry ID: 8ILK; pH 5.6, entry ID: 8ILL). a, Superposition of the α-carbon backbone and chromophore (A protomer) of the two crystal structures (pH 8.5, cyan; pH 5.8, magenta). The root-mean-square deviation value was calculated to be 0.664 Å. M1 and L217 indicate the N- and C-terminal ends, respectively. Because of its higher resolution, the pH 8.5 crystal structure is used hereafter for characterizing the atomic structure of StayGold. b, The chromophore and surrounding side chains represented in stick format. Hydrogen bonds are represented as broken lines with indicated distances in angstroms. Water molecules are indicated as red spheres. c, Four proline residues (Pro136, Pro143, Pro151, and Pro157) located on the seventh and eighth β-strands, which are close to the hydroxy group of the p-hydroxyphenyl ring of the chromophore in the cis conformation (stick representation). These prolines may rigidify this region of the β-barrel, thus stabilizing the chromophore in the cis state. It is noted that most fluorescent proteins have only one proline in the corresponding region. The side chain of Val152 may also contribute to the stabilization of the chromophore. During the crystal structure refinement, placement of a chloride ion was found to account for the peak observed in the Fo–Fc map near the chromophore. The chloride ion (indicated as a magenta sphere) is expected to sterically prevent the chromophore from adopting a trans conformation. d, The chromophore (represented in the space-filling format) is positioned in its cis (left) or trans (right) conformation. In the latter case, there is an apparent collision against the chloride ion. b–d, The atoms are color-coded as follows: carbon, white; oxygen, red; nitrogen, blue; sulfur, yellow.
Extended Data Fig. 5
Extended Data Fig. 5. Fluoppi assay for assessment of monomericity and dispersibility of StayGold variants for N-terminal tagging.
HeLa cells transfected with constructs encoding FP-PB1 were imaged using WF microscopy. StayGold is abbreviated as SG. The constructs are grouped into three categories: SG, tandem dimers, and monomers, from left to right. For each construct, the percentage of cells scored without fluorescent puncta is plotted (black dots) (top) and one representative close-up image is shown (bottom). The logarithmic gray scale (2.5–4.8) indicates that the lowest and highest fluorescence intensities of all the images are 102.5 and 104.8, respectively. Transfection was repeated three times; the mean scores are shown by gray bars with numerical values (top). Scale bar, 20 µm. Source data
Extended Data Fig. 6
Extended Data Fig. 6. High-speed visualization of chromosome targeting of FP-tagged condensin I in genome-edited HCT116 cells.
a, After release from cell cycle arrest, genome-edited HCT116 cells (#897) were imaged under 488 nm excitation for observation of CAP-H-td5oxStayGold and under 637 nm excitation for observation of SiR-DNA–labeled chromosomes by spinning-disk LSCM (SpinSR10) at 1 frame per second. Merged images at the indicated times (min:s). Scale bars, 10 µm. See Supplementary Video 3. b, Photostability comparison between CAP-H-td5oxStayGold and CAP-H-mClover3 under the same optical conditions. Illumination intensity, 2.24 W cm−2. Genome-edited HCT116 cells (#897, top vs. #899, bottom) during prometaphase were volume imaged (z-step, 0.25 µm; z-range, 2.5 µm) every 6.9 s over a total period of 278 s, with continuous excitation at 488 nm. Each gray scale indicates that the lowest and highest fluorescence intensities. Scale bar, 10 µm. See Supplementary Video 4.
Extended Data Fig. 7
Extended Data Fig. 7. Immunocytochemistry for localizing td5StayGold(c4)=GianCreg within the Golgi complex.
HeLa cells stably expressing td5StayGold(c4)=GianCreg were chemically fixed and immunostained for three Golgi markers: GM130 (cis), Giantin (medial), and TGN46 (trans-Golgi network). Their immunosignals (Alexa Fluor 647) were imaged with td5StayGold fluorescence three-dimensionally with a z-step of 0.52 µm using a confocal microscope. For a scan format of 512 × 512 and a zoom factor of 4×, the pixel size was 0.104 µm, which was sufficiently small to make good use of the resolving power of the high–numerical-aperture (NA 1.2) objective lens. a–c, Analysis of colocalization between td5StayGold(c4)=GianCreg and GM130 (a), Giantin (b), or TGN46 (c) in a single experiment. left, Representative single-slice images. Nuclei were stained with DAPI. Scale bar, 5 µm. right, Pearson correlation plots based on 26 (a and b) and 27 (c) z-slices, showing the correlation coefficients: 0.324 (a), 0.606 (b), and 0.325 (c). d, The experiment was repeated three times. Individual correlation coefficients are plotted; the data plots derived from a–c are highlighted in magenta). The mean values are shown by gray bars. Source data
Extended Data Fig. 8
Extended Data Fig. 8. Effects of drugs on F-actin organization.
COS-7 cells expressing F-tractin=mStayGold (top) or mStayGld(c4)=UtrCH (bottom) were treated with cytochalasin D (left) or latrunculin A (right) during continuous imaging by SDSRM (SpinSR10) (Supplementary Video 8). UtrCH: utrophin calponin homology domain. Single confocal images sectioned nearest the cell bottom were acquired. A pair of representative images (Before and After) are shown for each experiment. Scale bars, 10 µm. Punctate structures accumulated on the plasma membrane mostly below the nucleus after the application of cytochalasin D was applied. By contrast, they disappeared after the application of latrunculin A was applied. The images shown are representative of n = 12 independent experiments for cytochalasin D/F-tractin=mStayGold, n = 7 independent experiments for latrunculin A/F-tractin=mStayGold, n = 7 independent experiments for cytochalasin D/mStayGold(c4)=UtrCH, n = 4 independent experiments for latrunculin A/mStayGold(c4)=UtrCH.
Extended Data Fig. 9
Extended Data Fig. 9. Agonist-, antagonist-, and Ca2+ ionophore-induced longitudinal changes in IMM structures revealed by fast, sustained, wide imaging.
HeLa cells expressing COX8a=mStayGold were continuously imaged by SDSRM (SpinSR10) at a temporal resolution of 2.5 frames per second. Two representative experimental data are shown. Histamine, cyproheptadine, and ionomycin were applied at 1 min, 2.5 min, and 4 min, respectively. The time zones of Ca2+ mobilization are shaded. IMM rearrangements were quantified by normalized cross-correlation (https://typeset.io/papers/fast-normalized-cross-correlation-1u76lu073u). Normalized cross-correlation was calculated between n and n + 1 images in individual pixels. Calculated values were averaged in each image and plotted as a function of time. Regions indicated by yellow boxes are zoomed-in for movie presentation (Supplementary Video 12). Scale bars, 10 µm. Shown are two representatives of n = 12 independent experiments (transfections) that observed histamine- and ionomycin-induced decreases in the mobility of IMM structures. Source data
Extended Data Fig. 10
Extended Data Fig. 10. Photostability of StayGold, mStayGold, mStayGold2, and reference green-emitting FPs in live cells under continuous WF illumination with high irradiances.
FPs were expressed as fusions to histone 2B (H2B) in HeLa cells and photobleached. Illumination intensities: 10, 30, 100, 300, and 1,000 W cm−2. StayGold is abbreviated as SG. a, Plot of intensity vs. normalized total exposure time, with an initial emission rate of 1,000 photons s−1 molecule−1. The curves shown are representative of three repetitions (n = 3 independent experiments). A photoactivation component was observed for both mStayGold and mStayGold2 as illumination intensity was increased. Signal fluctuation was due to some movements of intranuclear structures such as nucleoli. b, The statistical values of t1/2 (time for photobleaching from an initial emission rate of 1,000 photons s−1 molecule−1 down to 500) are plotted against the irradiances. Data points are shown as means ± s.d. (n = 3 independent experiments). The values are also shown in Supplementary Table 3. a, b, Lines are colored as follows. StayGold and td8ox2StayGold, dark green; mStayGold and mStayGoldG2, green; mEGFP, blue; mNeonGreen, red; mClover3, black; mGreenLantern, magenta. Source data

References

    1. Hirano M, et al. A highly photostable and bright green fluorscent protein. Nat. Biotechnol. 2022;40:1132–1142. doi: 10.1038/s41587-022-01278-2. - DOI - PMC - PubMed
    1. Campbell RE, et al. A monomeric red fluorescent protein. Proc. Natl Acad. Sci. USA. 2002;99:7877–7782. doi: 10.1073/pnas.082243699. - DOI - PMC - PubMed
    1. Watanabe T, et al. Genetic visualization of protein interactions harnessing liquid phase transitions. Sci. Rep. 2017;7:46380. doi: 10.1038/srep46380. - DOI - PMC - PubMed
    1. Costantini LM, Fossati M, Francolini M, Snapp EK. Assessing the tendency of fluorescent proteins to oligomerize under physiological conditions. Traffic. 2012;13:643–649. doi: 10.1111/j.1600-0854.2012.01336.x. - DOI - PMC - PubMed
    1. Costantini LM, et al. A palette of fluorescent proteins optimized for diverse cellular environments. Nat. Commun. 2015;6:7670. doi: 10.1038/ncomms8670. - DOI - PMC - PubMed

MeSH terms