. 2024 Apr;21(4):680-691.
doi: 10.1038/s41592-023-02100-w. Epub 2023 Nov 30.

Improved green and red GRAB sensors for monitoring dopaminergic activity in vivo

Affiliations

Improved green and red GRAB sensors for monitoring dopaminergic activity in vivo

Yizhou Zhuo et al. Nat Methods. 2024 Apr.

Abstract

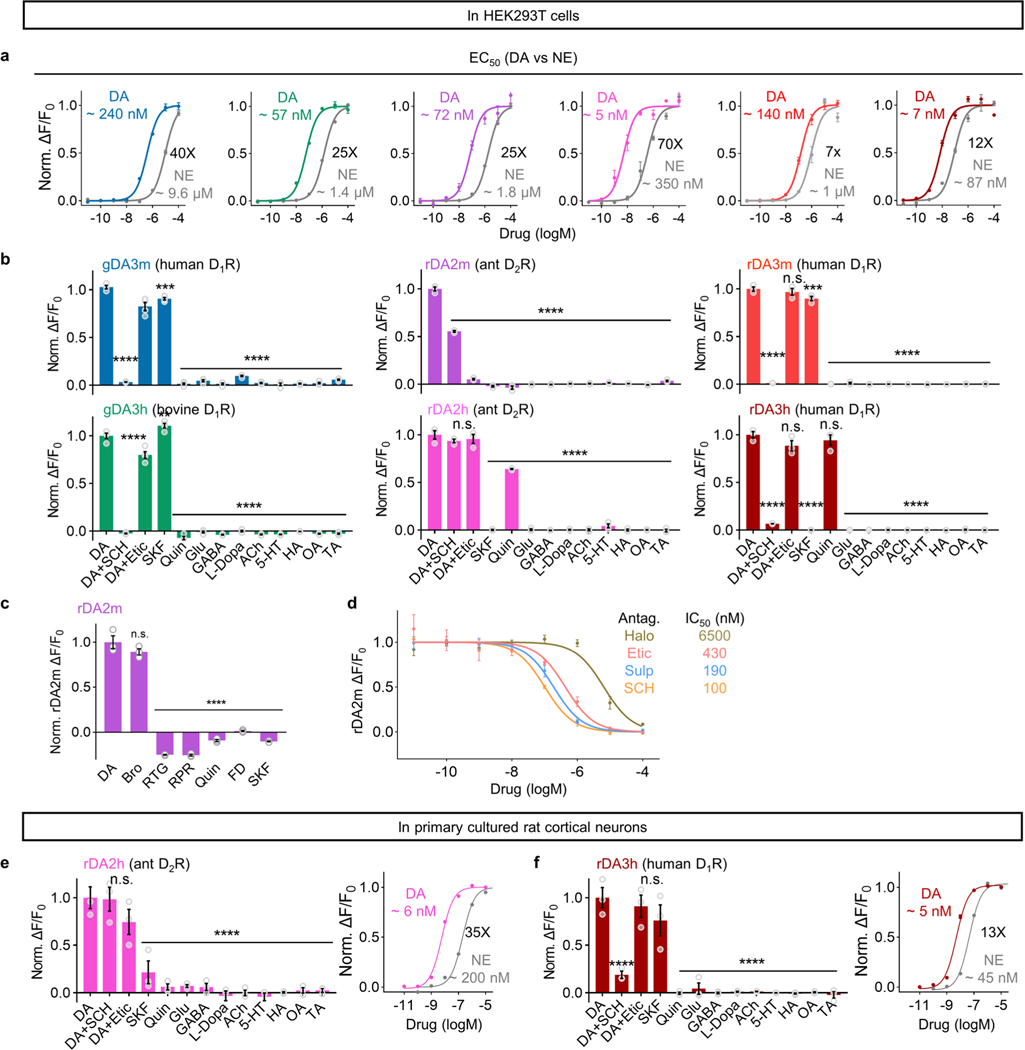
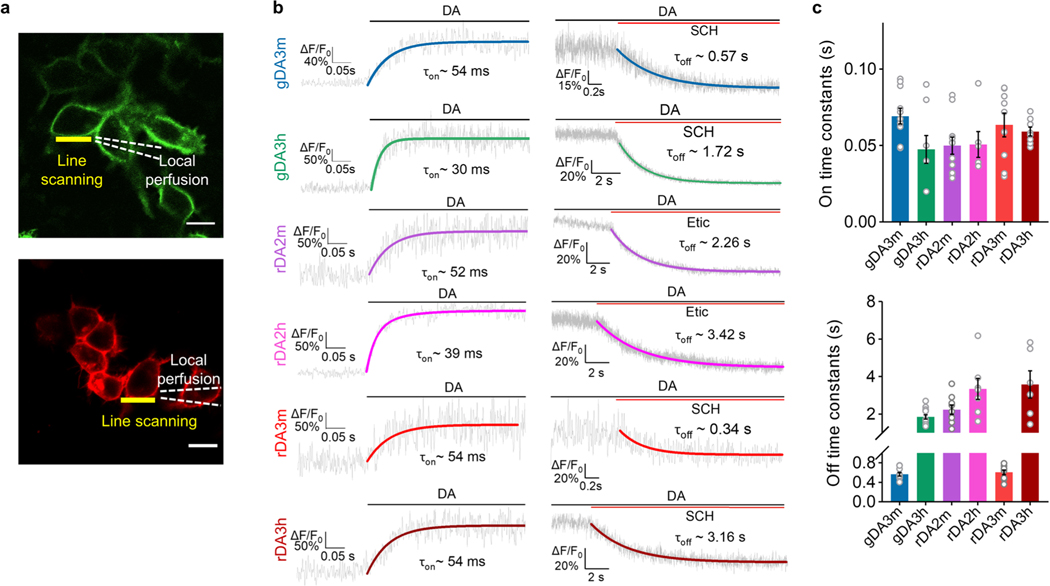
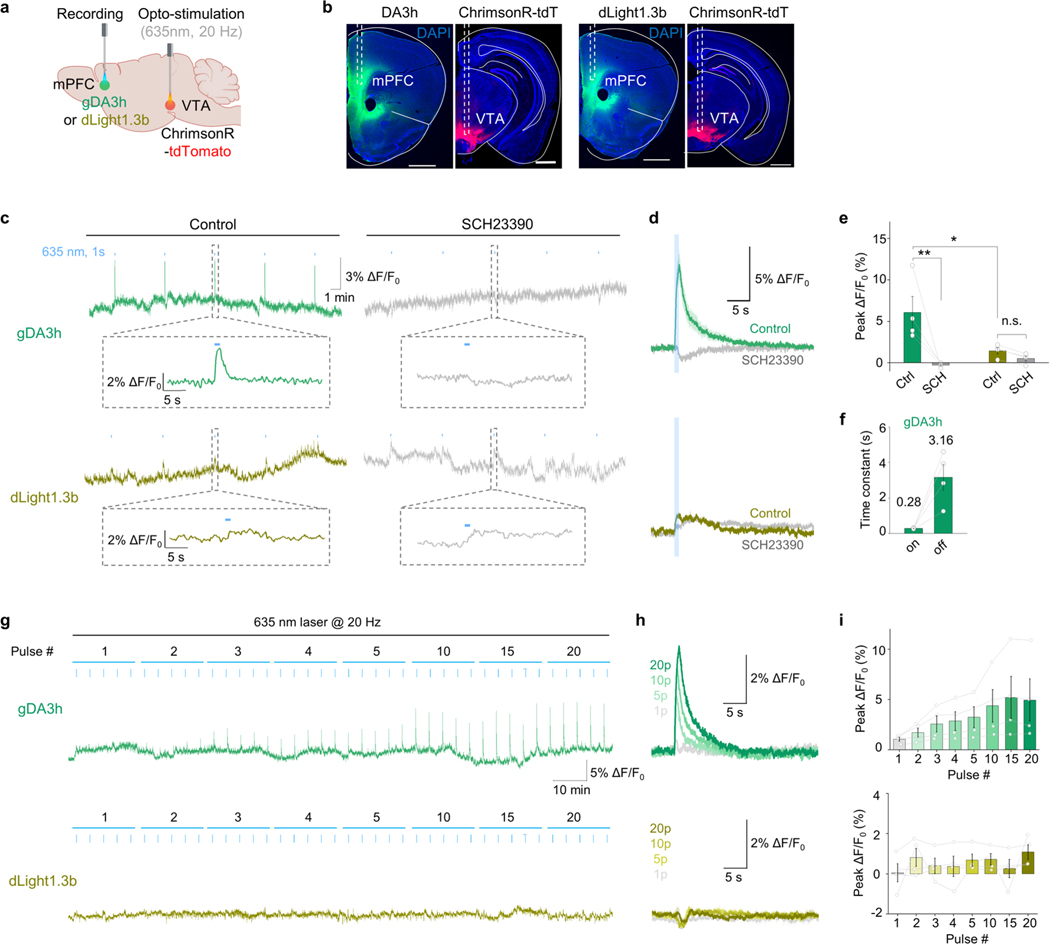
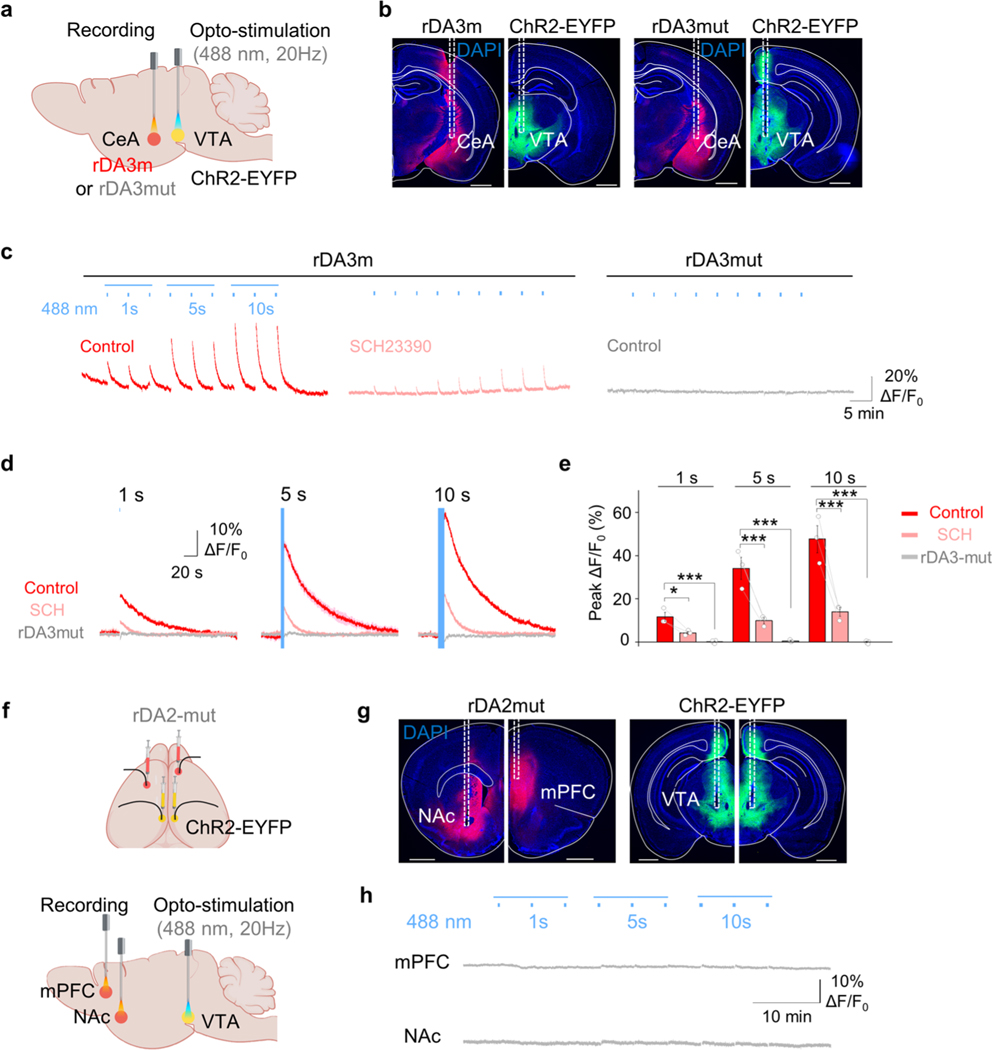
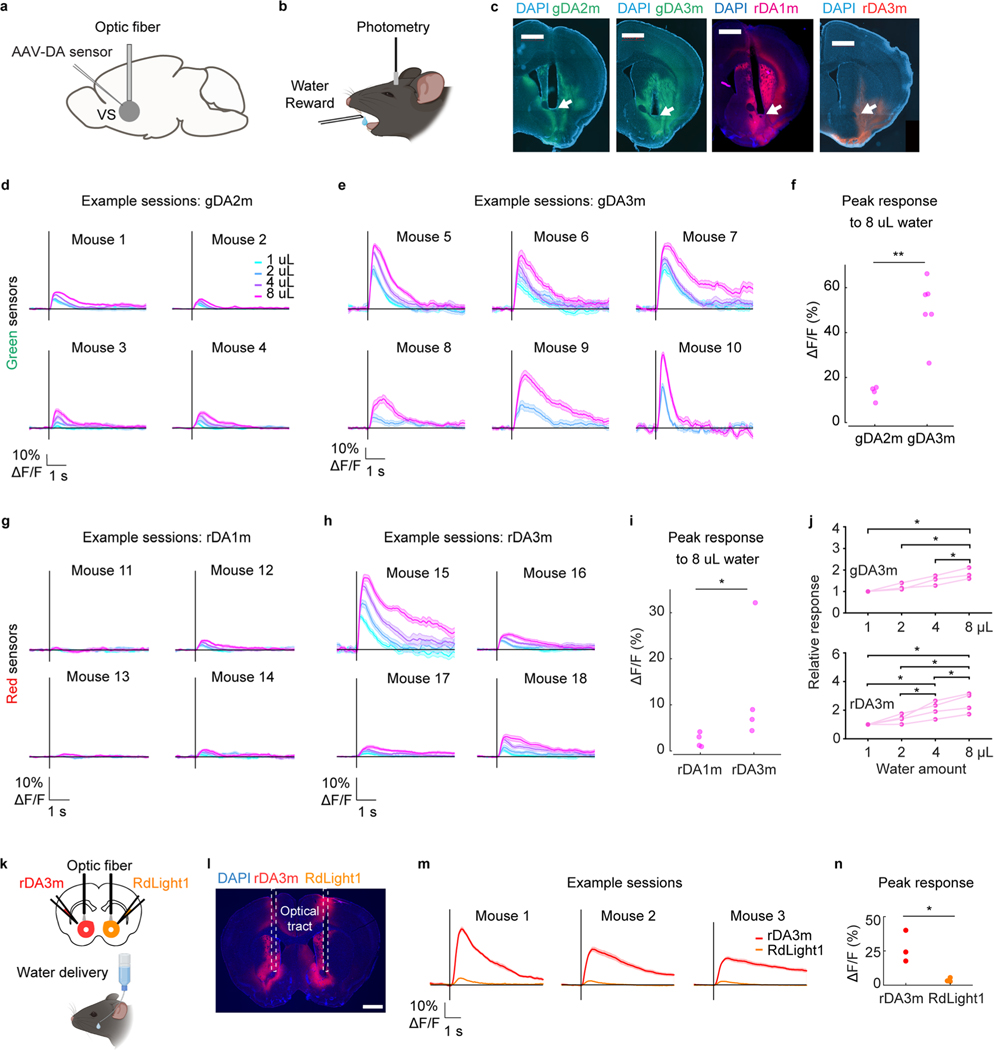
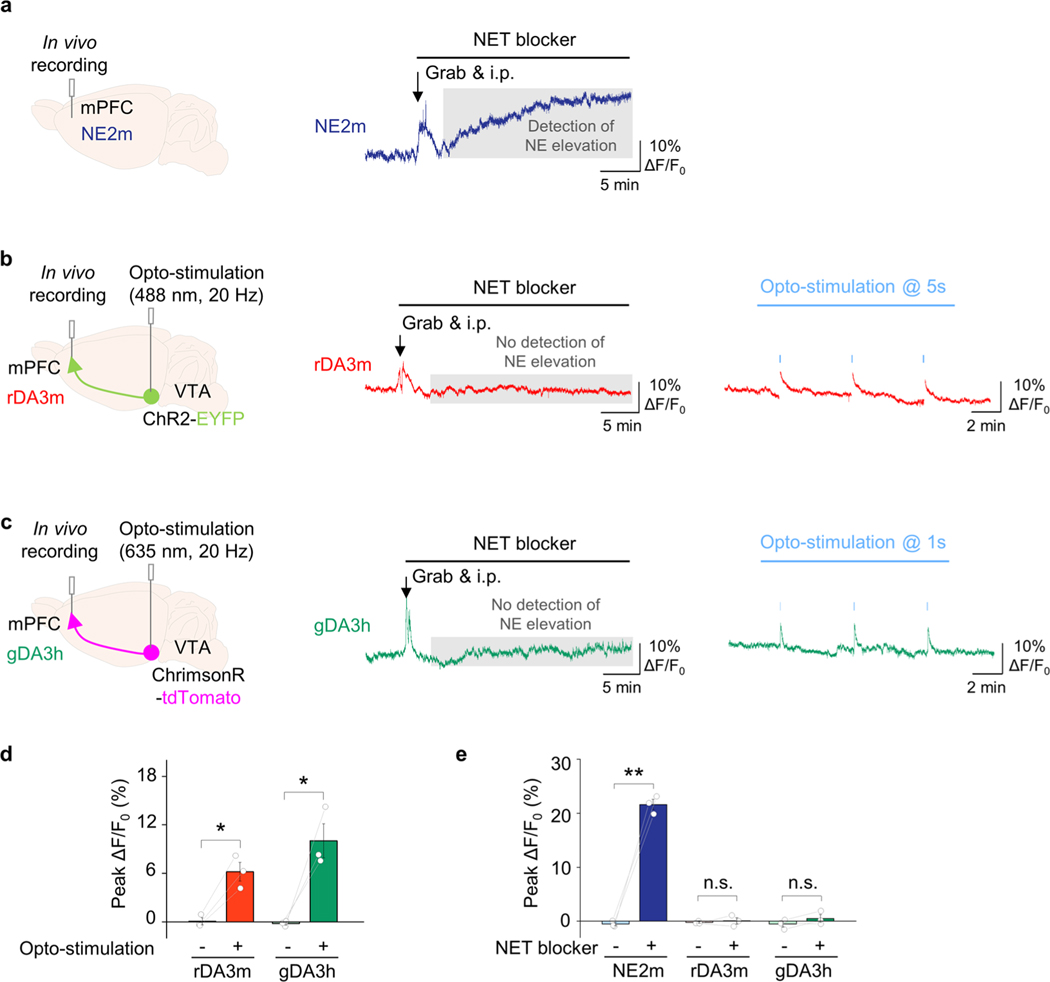
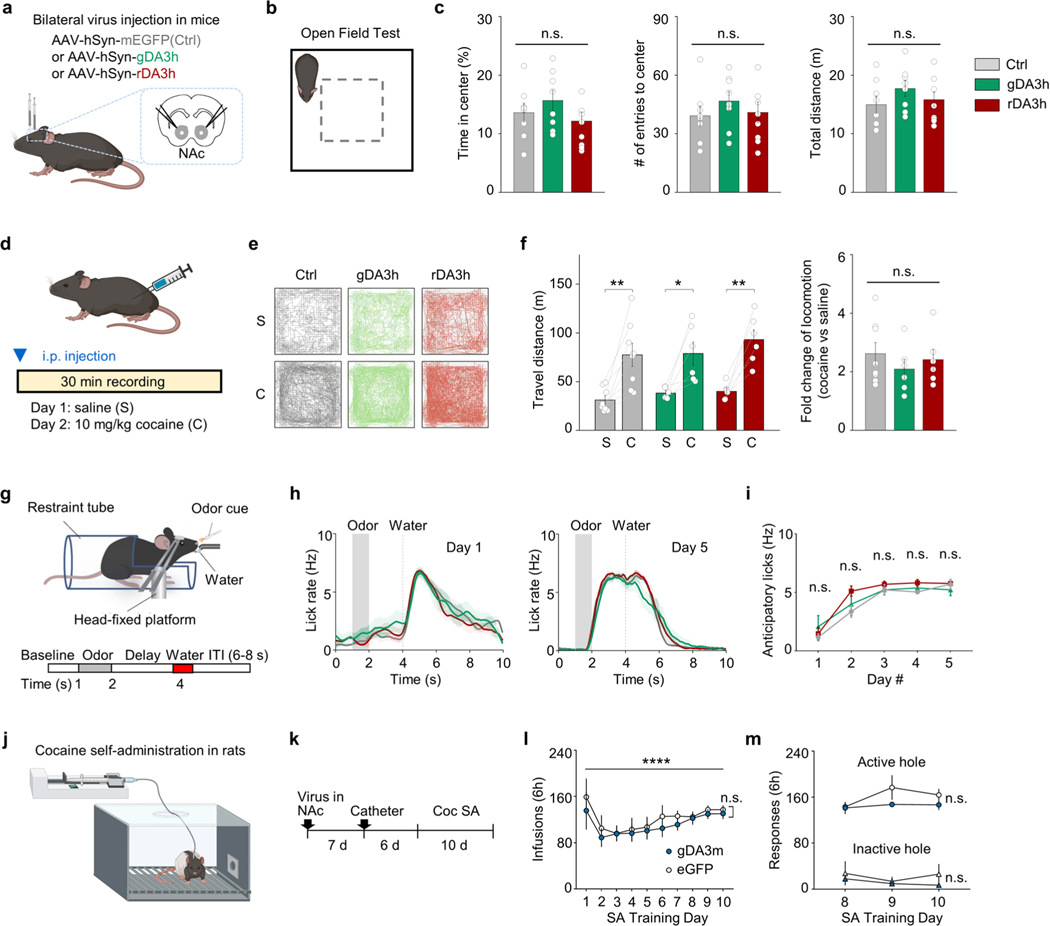
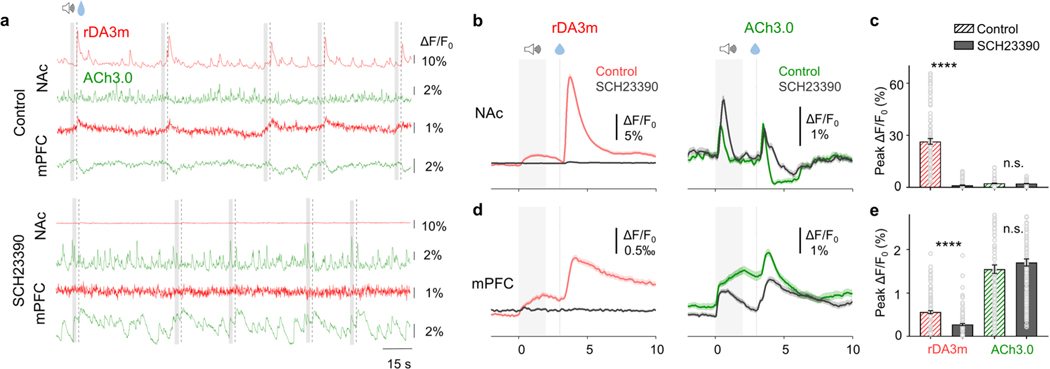
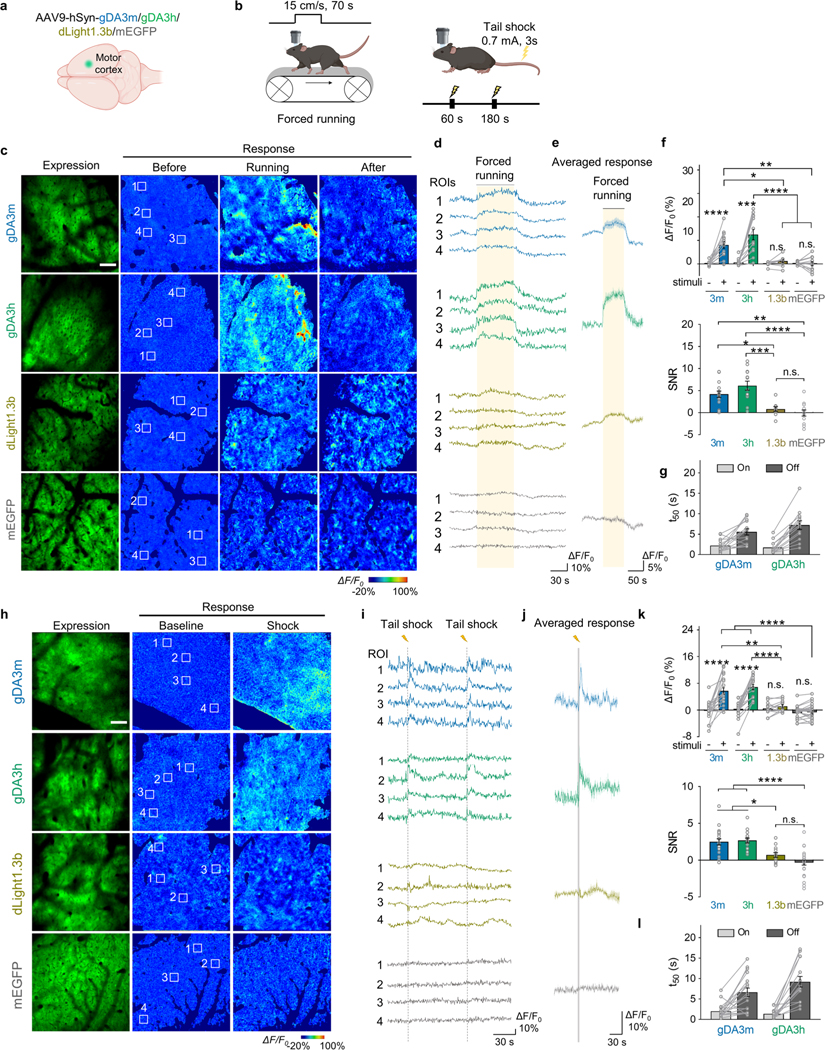
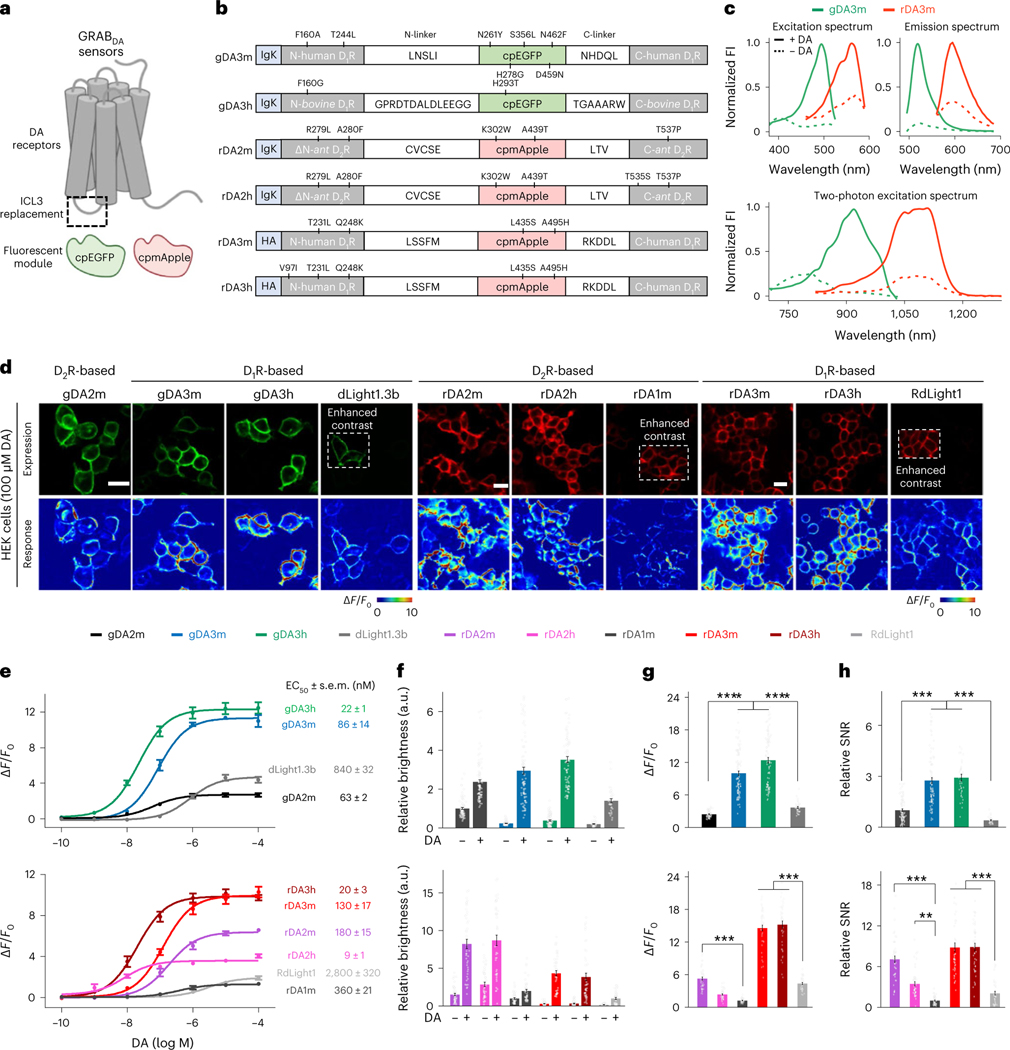
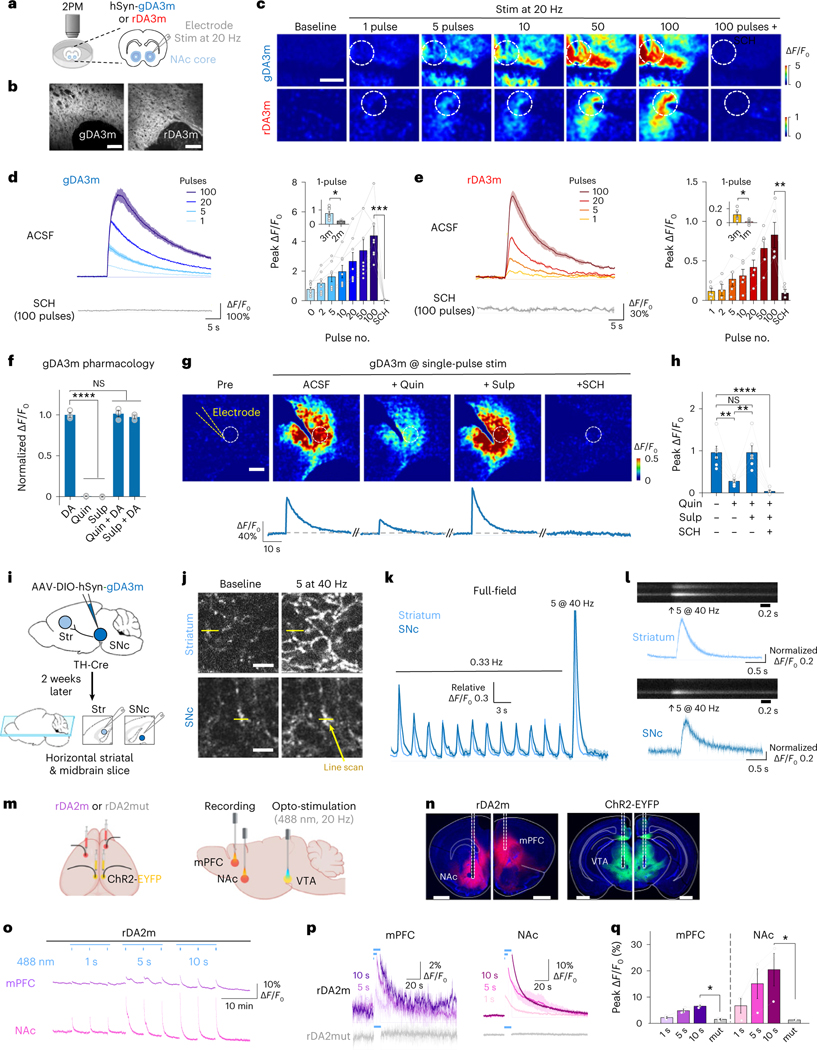
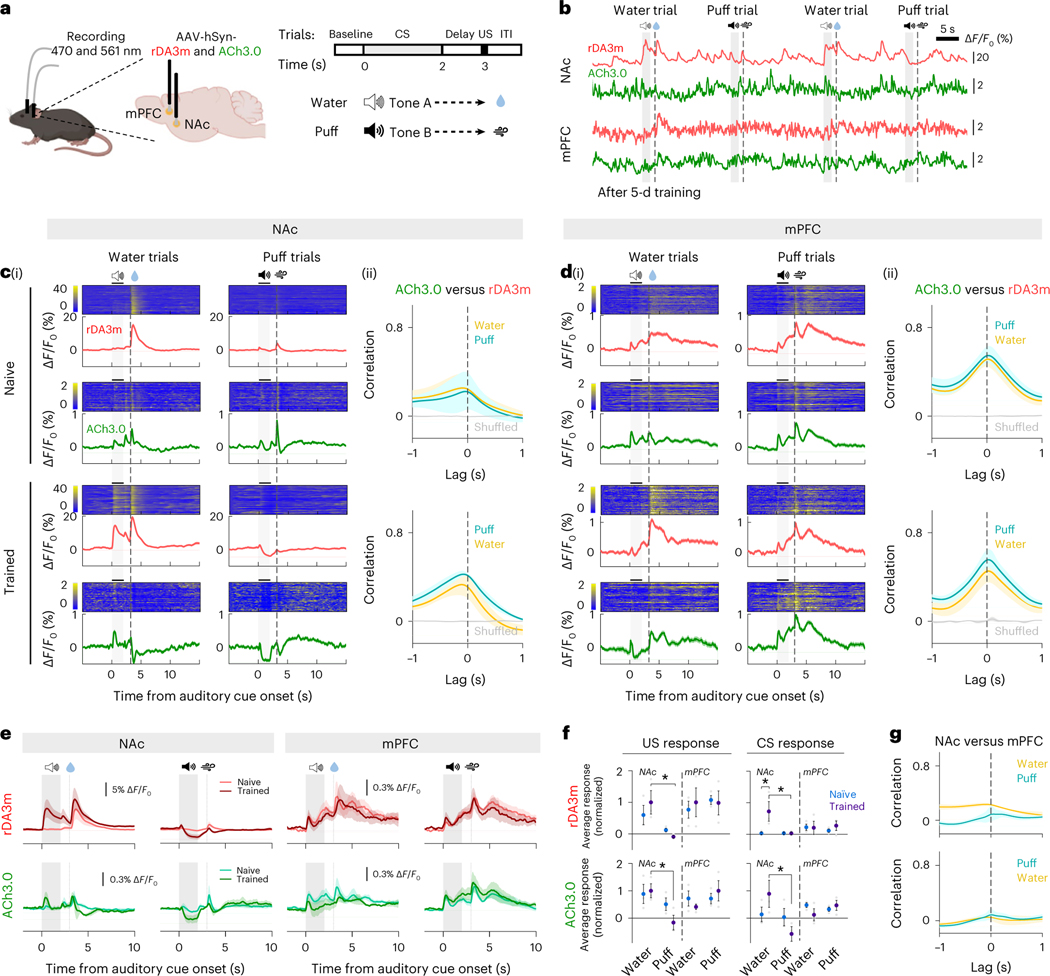
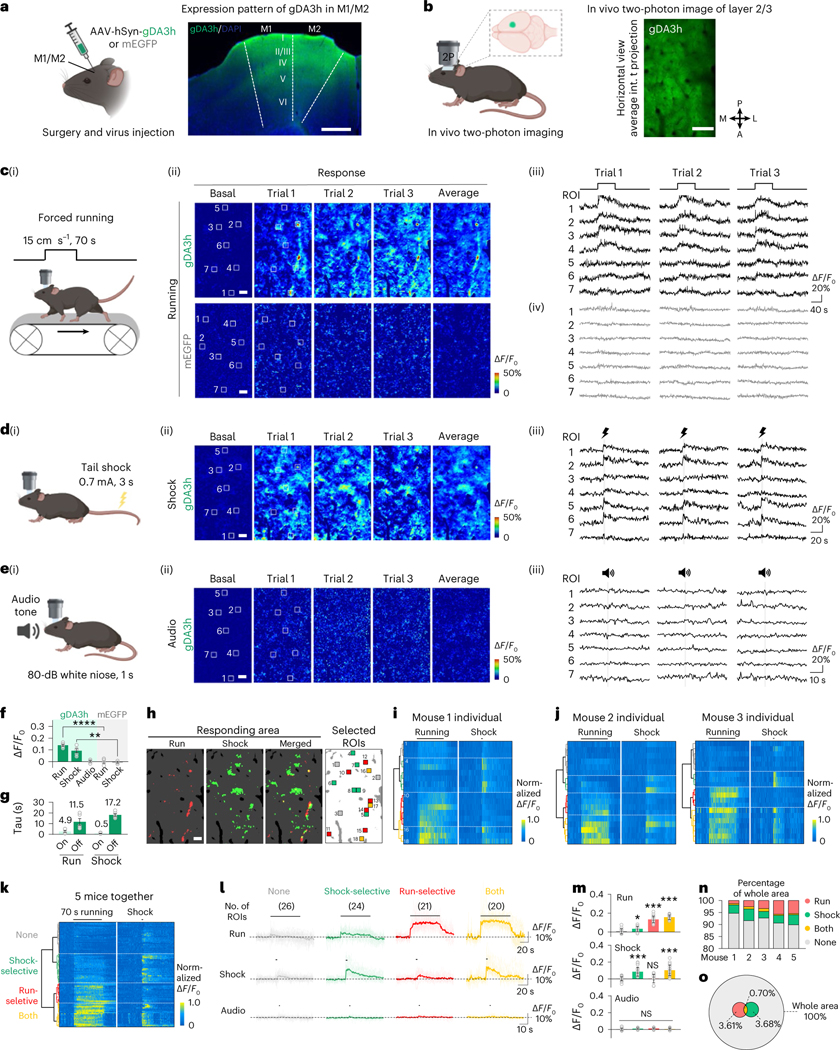
Dopamine (DA) plays multiple roles in a wide range of physiological and pathological processes via a large network of dopaminergic projections. To dissect the spatiotemporal dynamics of DA release in both dense and sparsely innervated brain regions, we developed a series of green and red fluorescent G-protein-coupled receptor activation-based DA (GRABDA) sensors using a variety of DA receptor subtypes. These sensors have high sensitivity, selectivity and signal-to-noise ratio with subsecond response kinetics and the ability to detect a wide range of DA concentrations. We then used these sensors in mice to measure both optogenetically evoked and behaviorally relevant DA release while measuring neurochemical signaling in the nucleus accumbens, amygdala and cortex. Using these sensors, we also detected spatially resolved heterogeneous cortical DA release in mice performing various behaviors. These next-generation GRABDA sensors provide a robust set of tools for imaging dopaminergic activity under a variety of physiological and pathological conditions.


Conflict of interest statement

Competing interests

The authors declare no competing interests.

Figures

Extended Data Fig. 1 |
Extended Data Fig. 1 |. Performance of DA-insensitive mutant sensors.
a, Representative images showing sensor expression (top) in HEK293T cells and fluorescence response to 100 μM DA (bottom) of indicated sensor variants. Scale bar, 20 μm. b, Group summary of maximal ΔF/F0 in response to 100 μM DA (left) and titration DA curves (right) of indicated sensors in HEK293T cells. Left, n = 6, 6, 15, 15, 12, 3 wells for gDA3m, gDA3mut, rDA2m, rDA2mut, rDA3m and rDA3mut. Each well contains 400–500 cells. Two-tailed Student’s t-test was performed. Right, n = 3 wells (with 400–500 cells per well) for each group. c, Representative images showing sensor expression (top) in cultured neurons and fluorescence response to 100 μM DA (bottom) of indicated sensor variants. Scale bar, 50 μm. d, Group summary of maximal ΔF/F0 of indicated sensors in response to 100 μM DA in cultured neurons. n = 60 neurons from 4 cultures for rDA2mut, n = 30/2 for others, mean±s.e.m. Two-tailed Student’s t-test was performed.
Extended Data Fig. 2 |
Extended Data Fig. 2 |. Pharmacological profiles of GRABDA sensors measured in cultured cells.
a, Titration curves of indicated sensors for the response to DA or NE in HEK293T cells. n = 3 cells with 400–500 cells per well, mean±s.e.m. b, The normalized ΔF/F0 in sensor-expressing HEK293T cells in response to the indicated compounds. Antagonists were applied at 10 μM, others at 1 μM. n = 4 wells for gDA3m and gDA3h, n = 3 wells for others, mean±s.e.m. One-way Anova, post hoc Dunnett’s test: gDA3m, p = 0.0002, 8.9 × 10⁻¹⁰ between DA and SFK, or DA+Etic, p = 1.3 × 10⁻¹³ between DA and others; gDA3h, p = 0.0020, 4.3 × 10⁻⁹ between DA and SFK, or DA+Etic, p = 1.3 × 10⁻¹³ between DA and others; rDA2m, p = 3.3 × 10⁻¹⁴ between DA and others; rDA2h, p = 0.6059, 0.9530 between DA and DA + SCH, or DA+Etic, p = 3.3 × 10⁻¹⁴ between DA and others; rDA3m, p = 0.9182, 0010 between DA and DA+Etic, or SKF, p = 3.3 × 10⁻¹⁴ between DA and others; rDA3h, p = 0.0724, 0.8723 between DA and DA+Etic, or Quin, p = 3.3 × 10⁻¹⁴ between DA and others. c, The normalized ΔF/F0 in rDA2m-expressing HEK293T cells in response to indicated DA agonists. Bromocriptine (Bro), Rotigotine (RTG), D2R/ D1R agonists; Ropinirole (RPR), Quin, D2R-specific agonists; Fenodopam (FD), SKF, D1R-specific agonist. All chemicals were bath-applied in 100 μM. n = 3 wells, mean±s.e.m. One-way Anova, post hoc Dunnett’s: p = 0.1074 between DA and Bro, p = 8.0 × 10⁻¹² between DA and others. d, Titration curves of indicated dopamine receptor antagonists. The fluorescence intensity in the presence with 10 μM DA was set as F0 and the relative fluorescence changes under indicated compound concentration were plotted. n = 3 wells with 400–500 cells per well, mean±s.e.m. e, f, Pharmacological specificity (left) and titration curves of indicated sensors for the response to DA or NE (right) in cultured neurons. Left, antagonists at 10 μM, others at 1 μM. n = 3 wells, mean±s.e.m. One-way Anova, post hoc Dunnett’s test: rDA2h, p = 0.9998, 0.1458 between DA and DA + SCH, or DA+Etic, p = 1.5 × 10⁻⁷ between DA and others; rDA3h, p = 0.9591, 0.1309 between DA and DA+Etic, or SKF, p = 4.0 × 10⁻⁹ between DA and others.
Extended Data Fig. 3 |
Extended Data Fig. 3 |. Kinetics measurement of GRABDA sensors in HEK293T cells.
a, Schematic illustration showing the local perfusion system using a glass pipette containing 100 μM DA and/or receptor-specific antagonist positioned above the sensor-expressing cell. The yellow line indicates the area for line scanning. The dash lines indicate the pipette. Scale bar, 20 μm. b, Representative traces showing the response measured using line-scanning; when indicated, DA and receptor-specific antagonist were puffed onto the cell. The trace were the average of 3 different ROIs on the scanning line. Data are shown as mean ± SD. Each trace was fitted with a single-exponential function to determine the τon (left) and τoff (right). c, Group summary of τon and τoff. τon, n = 11, 8, 11, 6, 9, 8 cells for gDA3m, gDA3h, rDA2m, rDA2h, rDA3m, rDA3h; τoff, n = 10, 14, 9, 7, 10, 6 cells for gDA3m, gDA3h, rDA2m, rDA2h, rDA3m, rDA3h, mean±s.e.m.
Extended Data Fig. 4 |
Extended Data Fig. 4 |. gGRABDA3h sensors report optogenetically-elicited DA release in the mouse mPFC.
a, Schematic illustration depicting the experimental design for panel b-i. b, Histological verification of indicated sensor expression in mPFC and ChrimsonR expression in VTA. Dashed boxes indicate the location of optical tract. Scale bar, 1 mm. c, Representative fluorescence changes and zoom-in view (indicated by dashed box) of indicated sensors during optogenetic stimulations under control condition or in the presence of SCH-23390 (SCH). d, Average traces of the change in gDA3h (top) or dLight1.3b (bottom) fluorescence from a mouse. Data are shown as mean±s.d. e, Group summary of ΔF/F0 for the indicated sensors. n = 4 mice for gDA3h and dLight1.3b, respectively, mean±s.e.m. One-way ANOVA, post hoc Tukey’s test was performed. **p = 0.0035 for gDA3h; n.s. p = 0.9122 for dLight1.3b; *p = 0.0295 between gDA3h and dLight1.3b. f, Group summary of the rise and decay time constant of the gDA3h signals in response to optogenetic stimulations. n = 4 mice, mean±s.e.m. g, h, Example fluorescence response (g) and corresponding average traces (e) of gDA3h (top) or dLight1.3b (bottom) to indicated optogenetic stimulation. The average traces are shown as mean±s.d. i, Group summary of peak ΔF/F0 of gDA3h or dLight1.3b in response to indicated optogenetic stimulation. n = 4 mice for gDA3h and dLight1.3b, mean±s.e.m.
Extended Data Fig. 5 |
Extended Data Fig. 5 |. rGRAB sensors report optogenetically-elicited DA release in multiple brain regions in vivo.
a, Schematic illustration depicting the experimental design for panel b-e. b, Histological verification of indicated sensor expression in CeA and ChrimsonR expression in VTA. Dashed boxes indicate the location of optical tract. Scale bar, 1 mm. c, Representative traces of rDA3m or rDA3mut signals during optogenetic stimulations. rDA3m signals were measured before and after SCH-23390 (SCH) administration. d, Average traces of the change in sensor fluorescence to 1-, 5- or 10-s opto-stimulation from a mouse. Data are shown as mean ± SD. The blue shaded area indicates the application of opto-stimulation. e, Group summary of peak response of rDA3m or rDA3mut to indicated optogenetic stimulation. n = 3 mice for rDA3m and n = 5 for rDA3mut, mean±s.e.m. Two-tailed Student’s t-test was performed. p = 0.0278, 0.0101, 0.0068 between control and SCH to 1-, 5-, 10-s opto-stimulation. p = 0.0003, 0.0001, 0.00004 between rDA3m and rDA3mut to 1-, 5-, 10-s opto-stimulation. f, Schematic illustration depicting the experimental design for panel g, h. g, Histological verification of rDA2mut expression in mPFC and NAc, and ChrimsonR expression in VTA. Dashed boxes indicate the location of optical tract. Scale bar, 1 mm. h, Representative traces of rDA2mut signals simultaneously recorded in the mPFC (top) and NAc (bottom) during optogenetic stimulations.
Extended Data Fig. 6 |
Extended Data Fig. 6 |. In vivo comparison of the third-generation DA sensors versus previous variants in water-restricted mice receiving water rewards.
a, Diagram of mouse surgical procedure. AAVs carrying gGRABDA2m, gGRABDA3m, rGRABDA1m, or rGRABDA3m were injected unilaterally into NAc. An optic fiber was implanted above the injection site. b, Illustration of behavioral experiment. c, Histological verification of indicated sensor expression in NAc. White arrows indicate the location of fiber tips. Scale bar, 1 mm. d, Recording sessions from gDA2m mice, mean±s.e.m. Vertical black bars indicate water delivery. Colors indicate water volume. e, Recording sessions from gDA3m mice, mean±s.e.m. f, Peak response to 8 μL water for the sessions shown in d and e. n = 4 mice for gDA2m, n = 6 for gDA3m. p = 0.0095, Two-tailed Mann-Whitney U test. g, Recording sessions from rDA1m mice, mean±s.e.m. h, Recording sessions from rDA3m mice, mean±s.e.m. i, Peak response to 8 μL water for the sessions shown in g and h. n = 4 for rDA1m, n = 4 for rDA3m. p = 0.0286, Two-tailed Mann-Whitney U test. j, Group summary of sensor responses to each water amount. The response of each mouse was relative to that to 1 μL water reward. n = 3 mice for gDA3m, n = 4 mice for rDA3m. Two-tailed Student’s t-test was performed between groups. For gDA3m, p = 0.032, 0.0185 and 0.0312 between 1, 2, 4 vs 8 μL, respectively; For rDA3m, p = 0.0217, 0.017 and 0.0179 between 1, 2, 4 vs 8 μL, and p = 0.032 and 0.0378 between 1, 2 vs 4 μL respectively. k, Schematic illustration depicting the mouse surgical procedure and the experimental design for panel l-n. l, Histological verification of rDA3m (left side) and RdLight1 (right side) in NAc. Dashed boxes indicate the location of optical tract. Scale bar, 1 mm. m, Recording sessions from 3 mice. Vertical black bars indicate water delivery. Colors indicate sensor version. n, Peak response of rDA3m and RdLight1 for the sessions shown in m. n = 3 mice for rDA3m and RdLight1. p = 0.0249, Two-tailed Student’s t-test.
Extended Data Fig. 7 |
Extended Data Fig. 7 |. GRABDA sensors show minimal signal changes towards endogenous NE elevation.
a, Schematic illustration (left) depicting the experimental design and representative fluorescence changes of NE2m towards systematic administration of NET blocker (3 mg/kg desipramine). b, Schematic illustration (left) depicting the experimental design and representative fluorescence changes of rDA3m towards systematic administration of NET blocker (middle) and upon optogenetic stimulations (right). c, Schematic illustration (left) depicting the experimental design and representative fluorescence changes (right) of gDA3h towards systematic administration of NET blocker (middle) and upon optogenetic stimulations (right). d, Group summary of ΔF/F0 for the indicated sensors upon opto-stimulation of VTA neurons. n = 3 mice for rDA3m and gDA3h, mean±s.e.m. Paired two-tailed Student’s t-test was performed within group. *p = 0.0167 for rDA3m and *p = 0.0463 for gDA3h. e, Group summary of ΔF/F0 for the indicated sensors towards systematic administration of NET blocker. n = 3 mice for NE2m, rDA3m and gDA3h, respectively, mean±s.e.m. Paired two-tailed Student’s t-test was performed within group. p = 0.6827, 0.2155 and 0.0012 for rDA3m, gDA3h and NE2m.
Extended Data Fig. 8 |
Extended Data Fig. 8 |. GRABDA expression in NAc has minimal effects on DA-related animal behaviors.
a, Schematic representation of viral injections in the bilateral NAc. b. Schematic illustration showing the open field test (OFT). c, Quantification of behavioral parameters in the OFT. n = 8, 8 and 10 mice for the control, gDA3h and rDA3h group, respectively, mean±s.e.m. One-way ANOVA was performed. p = 0.3118, 0.5870 and 0.3736. d, Schematic illustration depicting the experimental designs for panel e-f. e, Representative track of control, gDA3h and rDA3h animals. f, Quantification of behavioral parameters during the experiments. n = 8, 6 and 6 mice for the control, gDA3h and rDA3h group, respectively, mean±s.e.m. Two-tailed Student’s t tests were performed within groups: p = 0.0026, 0.0196 and 0.0039; One-way ANOVA was performed among groups: p = 0.6016. g, Schematic illustration showing the odor-reward associative learning task. h, Mean lick rate of Ctrl, gDA3h and rDA3h mice on day 1 and day 5 conditioning. n = 5 mice for each, mean±s.e.m. i, Quantification of anticipatory lick rate across five conditioning days. n = 5 mice for each, mean±s.e.m. Two-way ANOVA was performed among groups, p = 0.1076. j, Schematic diagram illustrating intravenous cocaine self-administration in rats. k, Timeline describing intravenous cocaine self-administration experiments. l, Cocaine infusions over 10 days of SA training did not differ between rats expressing gDA3m and eGFP virus bilaterally in the NAc core. n = 8 rats for each, mean±s.e.m. Two-way ANOVA mixed-effects model (Day x Virus): Day, F(9,126) = 4.50, p = 0.00004; Virus, F(1,14) = 0.35, p = 0.56; Day x Virus, F(9,126) = 0.21, p = 0.99. m, Nose-pokes in the active and inactive ports over the last 3 days of SA training did not differ between virus groups. Two-way ANOVA mixed-effects models (Day x Virus). n = 8 rats for each, mean±s.e.m. Active port: Day, F(2,28) = 3.21, p = 0.06; Virus, F(1,14) = 1.35, p = 0.27; Day x Virus, F(2,28) = 1.48, p = 0.24. Inactive port: Day, F(2, 28) = 1.97, p = 0.16; Virus, F(1,14) = 0.48, p = 0.50; Day x Virus, F(2,28) = 0.92, p = 0.41.
Extended Data Fig. 9 |
Extended Data Fig. 9 |. The signals in the mouse NAc and mPFC during Pavlovian conditioning.
a, Representative fluorescence signals recorded during consecutive water trials pre (top, control) and post SCH-23390 (bottom, SCH-23390) treatment. The audio and water delivery are indicated above. b, Averaged traces of rDA3m (left) and ACh3.0 (right) fluorescence measured in the NAc from a mouse under control condition or in the presence of SCH-23390 in one mouse, mean±s.e.m. The grey shaded area indicates the application of audio. The dashed line indicates the delivery of water. c, Group summary of the peak fluorescence change of rDA3m and ACh3.0 signals in the NAc under the indicated condition. n = 155 trials from 3 mice for each group, mean±s.e.m. Two-tailed Student’s t-test was performed between control and SCH-23390 group. p = 0.2624 for ACh3.0. d, e. same as (b, c) with simultaneously recorded rDA3m and ACh3.0 signals in the mPFC. Two-tailed Student’s t-test was performed between control and SCH-23390 group. p = 0.2274 for ACh3.0.
Extended Data Fig. 10 |
Extended Data Fig. 10 |. In vivo two-photon imaging of cortical DA dynamics in mice.
a, b, Schematic illustration depicting the experimental design for panel c-j. c–e, Representative expression and pseudocolored response images (c), representative traces measured at the indicated ROIs (d), and average traces per forced running (e) measured in the motor cortex expressing indicated sensors. Scale bar, 100 μm. f, Group summary of the peak response (top) and SNR (bottom) of indicated sensors measured during forced running. n = 14/4 (14 trials from 4 mice), 13/4, 9/3 and 12/4 for gDA3m, gDA3h, dLight1.3b and mEGFP, respectively, mean±s.e.m. Paired two-tailed Student’s t-test was performed for response: p = 6 × 10⁻⁵, 0.0002, 0.0683, 0.6275 for gDA3m, gDA3h, dLight1.3b and mEGFP. One-way ANOVA, post hoc Tukey’s test was performed across groups: response, p = 9 × 10⁻⁵, 4 × 10⁻⁶, 0.0214, 0.0022, 0.1611 and 0.9577 between gDA3h and dLight1.3b, gDA3h and EGFP, gDA3m and dLight1.3b, gDA3m and mEGFP, gDA3m and gDA3h, and dLight1.3b and mEGFP, respectively; SNR, p = 9 × 10⁻⁶, 0.0004, 0.0016, 0.0337 and 0.8812 between gDA3h and mEGFP, gDA3h and dLight1.3b, gDA3m and mEGFP, gDA3m and dLight1.3b, and dLight1.3b and mEGFP, respectively. g, Summary of the rise and decay t50 values of indicated sensors to forced running. n = 14/4 for gDA3m, n = 13/4 for gDA3h, mean±s.e.m. h–j, Same as (c-e) except mice were subjected to tail shock. k, Group summary of the response (top) and SNR (bottom) of indicated sensors measured upon tail shock. n = 19/4 for gDA3m, 16/4 for gDA3h, 12/3 for dLight1.3b, 26/4 for mEGFP, mean±s.e.m. Paired two-tailed Student’s t-test was performed for response: p = 3 × 10⁻⁵, 4 × 10⁻⁷, 0.1774 and 0.2554 for gDA3m, gDA3h, dLight1.3b and mEGFP. One-way ANOVA, post hoc Tukey’s test was performed across groups: response, p = 8 × 10⁻⁵, 1 × 10⁻⁸, 0.0.0013, 4 × 10⁻⁸, 0.7169 and 0.3714 between gDA3h and dLight1.3b, gDA3h and EGFP, gDA3m and dLight1.3b, gDA3m and mEGFP, gDA3m and gDA3h, and dLight1.3b and mEGFP, respectively; SNR, p = 1 × 10⁻⁷, 0.0104, 1 × 10⁻⁶, 0.0186 and 0.2607 between gDA3h and mEGFP, gDA3h and dLight1.3b, gDA3m and mEGFP, gDA3m and dLight1.3b, and dLight1.3b and mEGFP, respectively. l, Summary of the rise and decay t50 values of indicated sensors to tail shock. mEGFP data replotted from Fig. 6f. n = 18/4 for gDA3m, n = 15/4 for gDA3h, mean±s.e.m.
Fig. 1 |
Fig. 1 |. Development and performance of improved dual-color GRABDA sensors.
a, Schematic illustration showing the principle of next-generation DA sensors. b, Schematics of improved GRABDA sensors. Mutations are indicated with respect to wild-type receptors and fluorescent proteins. Immunoglobulin κ-chain (Igk) leader sequenceor histamine (HA), N terminus leader sequence. c, Spectral profiles of GRABDA sensors. One-photon excitation (top-left), emission (top-right) and two-photon excitation (bottom) spectra of indicated sensors with (dashed lines) or without (continuous lines) DA are shown. d, Representative images showing sensor expression (top) and fluorescence response to 100 μM DA (bottom) of indicated sensors. Scale bar, 20 μm. e, Titration DA curves of indicated sensors on HEK293T cells. Apparent EC50 values are defined as the concentration of half-maximal fluorescence changes (maxΔF/F0), mean ± s.e.m. n = 4, 7, 10, 8, 7, 6, 6, 12, 12 and 12 wells for gDA3m, gDA3h, gDA2m, dLight1.3b, rDA2m, rDA2h, rDA1m, rDA3m, rDA3h and rDA3m, respectively, with an average of 400 cells per well. f, Group summary of brightness (relative to gDA2m and rDA1m, respectively) of indicated sensors before and after 100 μM DA addition. n = 90/5 (90 cells from 5 separate experiments), 81/5, 88/5, 36/3, 45/3, 45/3, 45/3, 45/3, 45/3 and 38/3 for gDA3m, gDA3h, gDA2m, dLight1.3b, rDA2m, rDA2h, rDA1m, rDA3m, rDA3h and RdLight1, respectively. g, Group summary of maximal ΔF/F0 of indicated sensors in response to 100 μM DA. n = 61/7, 102/10, 91/9, 35/3, 45/3, 45/3, 45/3, 45/3, 45/3, 38/3 for gDA3m, gDA3h, gDA2m, dLight1.3b, rDA2m, rDA2h, rDA1m, rDA3m, rDA3h and RdLight1, respectively, mean ± s.e.m. One-way ANOVA with post hoc Tukey’s test was performed. P = 1 × 10⁻⁸ between gDA3m and gDA2m, or dLight1.3b; P = 1 × 10⁻⁸ between gDA3h and gDA2m, or dLight1.3b; P = 1 × 10⁻⁹ between rDA2m and rDA1m; P = 1 × 10⁻⁹ between RdLight1 and rDA3m, or rDA3h. h, Group summary of SNR (relative to gDA2m and rDA1m, respectively) of indicated sensors. n = 95/5, 40/3, 96/5, 31/3, 45/3, 45/3, 45/3, 45/3, 45/3, 38/3 for gDA3m, gDA3h, gDA2m, dLight1.3b, rDA2m, rDA2h, rDA1m, rDA3m, rDA3h and RdLight1, respectively, mean ± s.e.m. One-way ANOVA with post hoc Tukey’s test was performed. P = 1 × 10⁻⁸ between gDA3m and gDA2m, or dLight1.3b; P = 1 × 10⁻⁸ between gDA3h and gDA2m, or dLight1.3b; P = 0.0016 between rDA2h and rDA1m; P = 1 × 10⁻⁹ between rDA2m and rDA1m; P = 1 × 10⁻⁹ between RdLight1 and rDA3m, or rDA3h. EC50, half-maximum effective concentration; FI, fluorescence intensity.
Fig. 2 |
Fig. 2 |. Characterization of GRABDA sensors in cultured cells.
a, Representative images of gDA3m- or rDA3m-expressing neurons. Scale bars, 100 μm (left) and 20 μm (right). b, Representative images showing expression and fluorescence response of indicated sensors in neurons. Scale bar, 50 μm. Similar results were observed in more than 30 cells. c, Titration DA curves (left) and group summary of peak response (top-right) and relative SNR (bottom-right) of indicated green sensors in neurons. Left, n = 60, 60, 120, 60 neurons for gDA2m, gDA3m, gDA3h and dLight1.3b, respectively; right, n = 130, 175, 200, 80 neurons, mean ± s.e.m. One-way ANOVA, post hoc Tukey’s test: for both response and SNR, P = 5 × 10⁻¹⁰ between gDA3m and gDA2m, or dLight1.3b; P = 5 × 10⁻¹⁰ between gDA3h and gDA2m, or dLight1.3b. d, Similar to c except for red sensors. Left, n = 30 neurons for each sensor; right, n = 60 neurons for each, mean ± s.e.m. One-way ANOVA, post hoc Tukey’s test: response, P = 1 × 10⁻⁹ between rDA2h and rDA1m; P = 1 × 10⁻¹¹ between rDA2m and rDA1m; P = 1 × 10⁻¹¹ between RdLight1 and rDA3m, or rDA3h; SNR, P = 0.0006 between rDA2h and rDA1m; P = 1 × 10⁻¹¹ between rDA2m and rDA1m; P = 1 × 10⁻¹¹ between RdLight1 and rDA3m, or rDA3h. e, Pharmacological specificity of indicated sensors in neurons. SCH, D1R antagonist; eticlopride (Etic), D2R antagonist; SKF-81297 (SKF), D1R agonist; quinpirole (Quin), D2R agonist; Glu, glutamate; GABA, γ-aminobutyric acid; L-Dopa, levodopa; 5-HT, serotonin; OA, octopamine; TA, tyramine. Antagonists were applied at 10 μM, others at 1 μM. n = 4, 5, 3 and 3 wells for gDA3m, gDA3h, rDA2m and rDA3m, respectively, with an average of 100 neurons per well, mean ± s.e.m. One-way ANOVA, post hoc Dunnett’s test: gDA3m, P = 0.0831 between DA and DA + Etic; P = 1.3 × 10⁻¹³ between DA and others; gDA3h, P = 0.2744, 0.0008 between DA and DA + Etic, or SKF; P = 1.0 × 10⁻¹⁵ between DA and others; rDA2m, P = 1.0 × 10⁻¹³ between DA and others; rDA3m, P = 0.8251, 0.9993 between DA and DA + Etic, or SKF; P = 4.0 × 10⁻¹⁴ between DA and others. f, Titration curves of indicated sensors for the response to DA or NE in neurons. DA, n = 45, 80, 60 and 90 neurons from 3 experiments for gDA3m, gDA3h, rDA2m and rDA3m; NE, n = 45, 120, 30 and 60 neurons from 3 experiments for gDA3m, gDA3h, rDA2m and rDA3m, mean ± s.e.m. g, Representative traces (left) and group summary of ΔF/F0 (right) of indicated sensors upon blue-light illumination. n = 71, 13, 17, 18, 14, 8, 8, 18, 16 cells for jRGECO1a, rDA1m, rDA2m, rDA2h, rDA2mut, RdLight1, rDA3m, rDA3h and rDA3mut, respectively, mean ± s.e.m. One-way ANOVA, post hoc Dunnett’s test: P = 0.2726 between jRGECO1a and D1R-based red sensors; P = 1 × 10⁻¹⁵ between jRGECO1a and D2R-based red sensors. h, Representative images (left) and quantification (right) of sensor fluorescence in response to 2-h application of 100 μM DA. Scale bar, 20 μm. n = 3 and 9 cultures for gDA3m and rDA3m, respectively, mean ± s.e.m. One-way ANOVA test was performed for each sensor among DA-containing groups: P = 0.4375, 0.1895 for gDA3m and rDA3m. i, Luciferase complementation assay for assessing G-protein coupling. Cells expressing mGs/i alone serve as the control. n = 3 cultures each, mean ± s.e.m. One-way ANOVA, post hoc Tukey’s test: P = 2 × 10⁻⁸ between bD1R and gDA3h; P = 1 × 10⁻⁸ between hD1R and gDA3m; P = 3 × 10⁻⁷ between aD2R and rDA2m, or rDA2h; P = 0.92, 0.95 between Gi-LgBit and rDA2m, or rDA2h; P = 9 × 10⁻⁷, 5 × 10⁻⁷ between hD1R and rDA3m, or rDA3h; P = 0.77, 0.99 between Gs-LgBit and rDA3m, or rDA3h. j, Tango assay for assessing β-arrestin coupling. n = 3 cultures each, mean ± s.e.m. NA, not applicable. One-way ANOVA, post hoc Tukey’s test: P = 6 × 10⁻⁶ between bD1R and gDA3h; P = 1 × 10⁻⁸ between hD1R and gDA3m; P = 2 × 10⁻⁷, 3 × 10⁻⁷ between aD2R and rDA2m, or rDA2h; P = 0.0002, 0.0002 between hD1R and rDA3m, or rDA3h. NS, not significant.
Fig. 3 |
Fig. 3 |. Ex vivo and in vivo validation of GRABDA sensors. a, Schematic
illustration depicting the experimental design for panels be. b, Representative images showing gDA3m or rDA3m expression in the NAc. Scale bar, 100 μm. Similar results were observed from more than four mice. c, Example fluorescence response to indicated electrical stimulation in the sensor-expressing brain slices. Dashed circles, ROIs used to analyze the responses. Scale bar, 100 μm. d, Representative traces (left) and group summary (right) of the change in gDA3m sensor fluorescence to electrical stimulation. Left, mean ± s.d. Right, mean ± s.e.m. n = 8 slices from 5 mice (8/5) for gDA3m. The inset shows quantification of the ΔF/F0 of indicated sensors to 1-pulse stimulation. Data were replotted from previous results of gDA2m (ref. 13). Two-tailed Student’s t-test: P = 0.0429 for gDA3m, P = 0.0076 between gDA3m and gDA2m. e, Representative traces (left) and group summary (right) of the change in rDA3m sensor fluorescence to electrical stimulation. Left, mean ± s.d. Right, mean ± s.e.m. n = 5/4 for rDA3m. The inset shows quantification of the ΔF/F0 of indicated sensors to 1-pulse stimulation. Two-tailed Student’s t-test: P = 0.0138 for rDA3m, P = 0.0008 between rDA3m and rDA1m. Data were replotted from previous results of rDA1m (ref. 13). f, Normalized fluorescence change in gDA3m to indicated compounds (1 μM). Sulpiride (Sulp), D2R antagonist. n = 3 wells with 500–600 cells per well, mean ± s.e.m. One-way ANOVA, post hoc Dunnett’s test: P = 0.9813, 0.8848 between DA and DA+Quin, or DA+Sulp. g, Representative pseudocolored images (top) and fluorescence response traces (bottom, mean ± s.d.) of gDA3m to electrical stimuli in indicated conditions (drugs in 1 μM). Yellow dashed line, electrode placement; dashed circles, ROIs. Scale bar, 100 μm. h, Group summary of fluorescence response of gDA3m to electrical stimulation either in artificial cerebrospinal fluid (ACSF) or with indicated drugs. n = 6 slices from 5 mice, mean ± s.e.m. One-way ANOVA, post hoc Tukey’s test: P = 0.0023, P = 0.9999, P = 0.0008 between ACSF and Quin, Sulp or SCH; P = 0.00231 between Quin and Sulp. i, Schematic illustration depicting the experimental design of panels jl. j, Representative images showing gDA3m expression in the striatum (top) and SNc (bottom) in the control condition (left) and upon stimulation (right). Scale bar, 5 μm. Yellow lines, line-scanning regions. Similar results were observed from more than five slices. k, Full-frame fluorescence response (relative to the peak of the first stimulation) to indicated electrical stimulations. n = 6 slices for striatum, n = 9 slices for SNc, mean ± s.e.m. l, Representative line-scan image in the striatum (top) and the SNc (bottom) and averaged normalized traces to multi-pulse stimulus. n = 6 areas for striatum and SNc, respectively, mean ± s.e.m. m, Schematic illustration depicting the experimental design for panels nq. n, Histological verification of rDA2m expression in mPFC and NAc, and ChrimsonR expression in VTA. Dashed boxes, optical tracts. Scale bar, 1 mm. o, Representative traces of rDA2m signals in the mPFC (top) and NAc (bottom) during optogenetic stimulations. p, Average traces of sensor response in the mPFC (left) and NAc (right) to indicated optogenetic stimulation from a mouse, mean ± s.d. The length of blue lines indicates the duration of opto-stimulation. q, Group summary of peak response of indicated sensors to indicated optogenetic stimulation. n = 3 mice for rDA2m and rDA2mut, mean ± s.e.m. Two-tailed Student’s t-test was performed between groups for 10-s opto-induced response. mPFC, P = 0.0007; NAc, P = 0.0364. 1m, rDA1m; 2m, gDA2m; 3m in d, gDA3m; 3m in e, rDA3m; 2PM, two-photon microscope.
Fig. 4 |
Fig. 4 |. Multiplexed measurements of DA and other neurochemical signals during natural behaviors.
a, Schematic illustration depicting the experimental design for panels bf. b, Histological verification of rDA3m and G-Flamp1 expression in NAc. DAPI, 4,6-diamidino-2-phenylindole. Scale bar, 1 mm. c, Example traces (top) and magnified traces of rDA3m (red) and G-Flamp1 (green) signals simultaneously measured during the indicated mating stages. d, Group-averaged rDA3m and G-Flamp1 fluorescence aligned to event onset for all mice. The signals were normalized to respective maxima and minimum. n = 4 mice, mean ± s.e.m. e, Cross-correlation between simultaneously recorded rDA3m and G-Flamp1 signals during indicated stages and of shuffle group. n = 4 mice, mean ± s.e.m. f, Group summary of peak correlation coefficient (top) and time lag of cross-correlation peak (bottom) between rDA3m and G-Flamp1 signals across mating stages. n = 4 mice, mean ± s.e.m. One-way ANOVA with post hoc Tukey’s test was performed. g, Schematic illustration depicting the experimental design for panels gk. h, Histological verification of rDA2m and eCB2.0 expression (left) and rDA1m and eCB2.0 expression (right) in BLA. Scale bar, 1 mm. i, Pseudocolored fluorescence responses of rDA2m and eCB2.0 measured in the BLA to ten consecutive foot shocks. j, Average traces of the change in rDA2m (top) and eCB2.0 (bottom) fluorescence from a mouse. The gray-shaded area indicates the application of electrical foot shock, mean ± s.d. k, Same as h with simultaneously recorded contralateral rDA1m and eCB2.0 signals. l, Group summary of the peak change in fluorescence of indicated sensors to foot shock. n = 4 mice, mean ± s.e.m. Paired two-tailed Student’s t-test was performed. P = 0.0390 between rDA2m and rDA1m; P = 0.7019 between eCB2.0 groups. m, Summary of rise and decay time constants measured for the fluorescence change of indicated sensors to foot shock. The inset shows the example average trace of rDA2m and eCB2.0 signals that were normalized to respective maxima and minimum. n = 4 mice, mean ± s.e.m. One-way ANOVA with post hoc Dunnett’s test was performed. Rise time, P = 0.5742 and 0.0087 between rDA2m and rDA1m, or eCB2.0. Decay time, P = 0.2180 for all groups.
Fig. 5 |
Fig. 5 |. DA and ACh signals in mouse NAc and mPFC during an auditory Pavlovian conditioning task.
a, Schematic illustration depicting experimental design for panels bg. b, Example traces of rDA3m (red) and ACh3.0 (green) signals (ΔF/F0) simultaneously measured in the NAc (top) and mPFC (bottom) from a trained mouse during four consecutive trials. The audio, water and puff delivery are indicated above. c, Representative time-aligned pseudocolored images and averaged traces (mean ± s.e.m.) of rDA3m and ACh3.0 fluorescence from a mouse in naive (top) and trained (bottom) state (c(i)). The gray-shaded area indicates the application of audio. The dashed line indicates the delivery of water or puff. Session-wide correlation between rDA3m and ACh3.0 signals across naive (top) and trained sessions (bottom) (c(ii)). n = 3 mice. d, The same as c with simultaneously recorded rDA3m and ACh3.0 signals in the mPFC. e, Group-averaged rDA3m (top) and ACh3.0 (bottom) fluorescence in the NAc (left) and mPFC (right) for all mice under naive and trained states. Water or puff sessions are indicated above. n = 3 mice. f, Group analysis of the normalized average change of rDA3m (top) and ACh3.0 (bottom) signals to US (left) and CS (right) in different sessions. The average response was calculated as the average ΔF/F0 in the 1 s after the behavior onset. The gray points indicate data from individual animals; average and s.e.m. are shown by data points with state-represented color. n = 3 mice. Two-way ANOVA with post hoc Sidak’s test was performed between water and puff sessions and between naive and trained states. Responses in the trained mice NAc, P = 0.0145 (rDA3m-US), 0.0287 (rDA3m-CS), 0.0371 (ACh3.0-US), 0.0356 (ACh3.0-CS) between water and puff trials; rDA3m water trial CS response in the NAc, P = 0.0290 between naive and trained. g, Session-wide cross-correlation between rDA3m (top) or ACh (bottom) signals recorded in the NAc and mPFC. n = 3 mice. CS, conditional stimulus; ITI, inter-trial interval; US, unconditional stimulus.
Fig. 6 |
Fig. 6 |. Spatially resolved heterogenous cortical DA dynamics in mice.
a,b, Schematic illustration depicting virus injection and head-fixed two-photon imaging in the mouse motor cortex. a, Example image showing gDA3h expression in the M1/M2 in a coronal brain slice. Scale bar, 500 μm. b, Representative in vivo two-photon image of layer 2/3 in the M1/M2 showing gDA3h fluorescence. Scale bar, 100 μm. c, Schematic cartoon illustrating forced running experiments (c(i)), representative pseudocolored response images (c(ii)) and traces measured at indicated ROIs (white squares) during three trials (c(iii)) in mice expressing gDA3h (top) or mEGFP (bottom). Scale bar, 50 μm. d,e, Similar to c except mice were subjected to tail shock (d) or audio (e). Two-photon imaging was performed in the same region across behaviors. f, Group summary of the peak fluorescence changes of gDA3h and mEGFP to indicated stimulus. n = 5 and 4 mice for gDA3h and mEGFP, mean ± s.e.m. Two-tailed Student’s t-test: running, P = 4 × 10⁻⁵; shock, P = 0.0017. g, Group summary of the rise and decay time constant of gDA3h signals to forced running and tail shock. n = 5 mice, mean ± s.e.m. h, Example image showing the spatial responding pattern to forced running, tail shock, merge and ROI selection. i, Hierarchical clustering of ROI-specific responses to running and shock from a mouse. ROIs are indicated in h. j, Same to h with data from another two mice. k, Population data showing hierarchical clustering of ROI-specific response. n = 91 ROIs from 5 mice. l,m, Average (bold lines) and individual (thin lines) traces (l) and quantifications of response amplitudes (m) from ROIs within each cluster in k during different behaviors. The black lines indicate the application of indicated stimulus. n = 26, 24, 21 and 20 ROIs from 5 mice for each cluster, mean ± s.e.m. One-way ANOVA, post hoc Tukey’s test: forced running, P = 0.0128, 0.0585 between none and shock, or between running and both; tail shock, P = 0.9989, 0.6474 between none and running, or between shock and both; audio, P = 0.0766 among clusters. n, Percentage of area that was responsive to the indicated stimulus as in h. o, Venn diagram of the imaged motor cortex area that was responsive to the indicated stimulus. n = 5 mice. A, anterior; L, lateral; M, medial; P, posterior.

Update of

References

    1. Aransay A, Rodríguez-López C, García-Amado M, Clascá F. & Prensa L. Long-range projection neurons of the mouse ventral tegmental area: a single-cell axon tracing analysis. Front. Neuroanat 9, 59 (2015). - PMC - PubMed
    1. Slaney TR, Mabrouk OS, Porter-Stransky KA, Aragona BJ & Kennedy RT Chemical gradients within brain extracellular space measured using low flow push-pull perfusion sampling in vivo. ACS Chem. Neurosci 4, 321–329 (2013). - PMC - PubMed
    1. Björklund A. & Dunnett SB Dopamine neuron systems in the brain: an update. Trends Neurosci. 30, 194–202 (2007). - PubMed
    1. Klaus A, Alves da Silva J. & Costa RM What, if, and when to move: basal ganglia circuits and self-paced action initiation. Annu. Rev. Neurosci 42, 459–483 (2019). - PubMed
    1. Wise RA Dopamine, learning and motivation. Nat. Rev. Neurosci 5, 483–494 (2004). - PubMed

LinkOut - more resources