. 2024 Jan;21(1):60-71.
doi: 10.1038/s41592-023-02101-9. Epub 2023 Nov 30.

System-wide analysis of RNA and protein subcellular localization dynamics

Affiliations

System-wide analysis of RNA and protein subcellular localization dynamics

Eneko Villanueva et al. Nat Methods. 2024 Jan.

Abstract

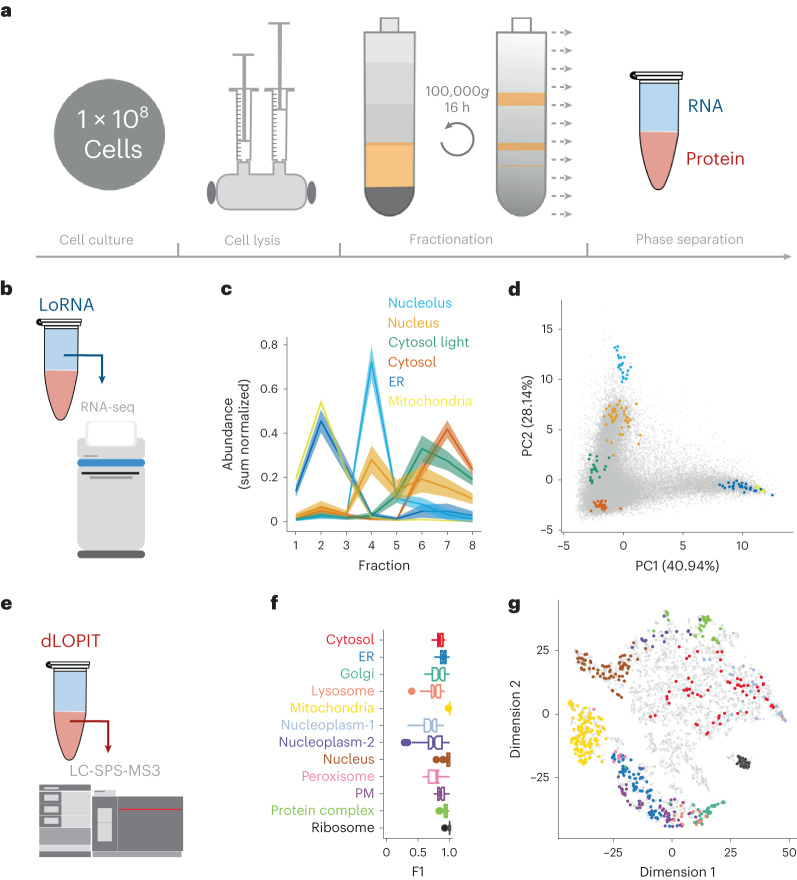
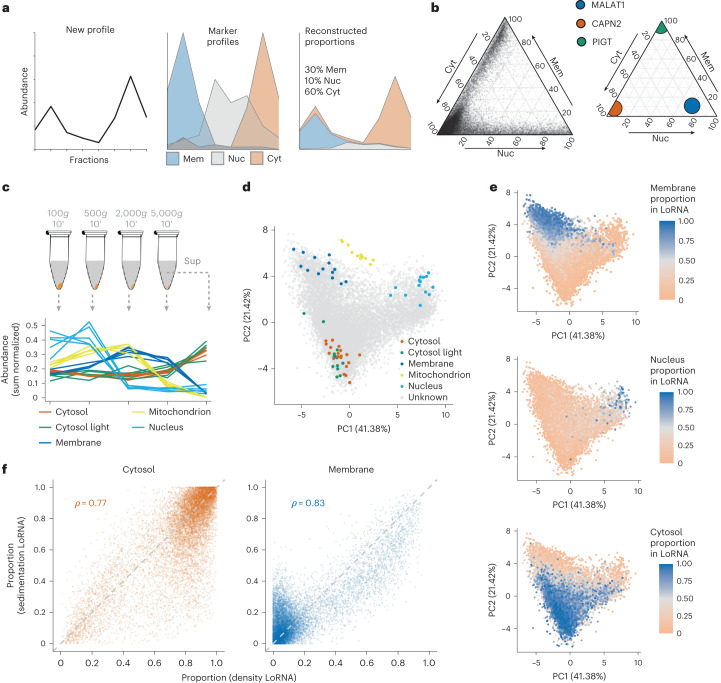
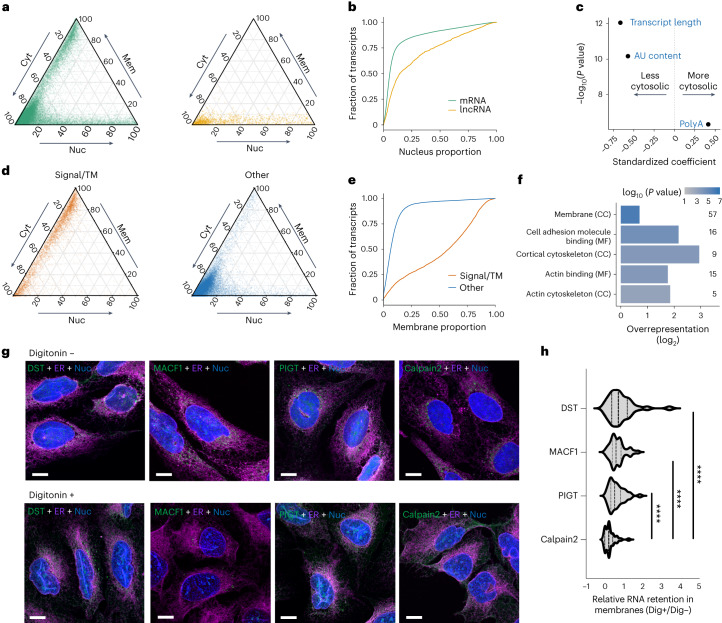
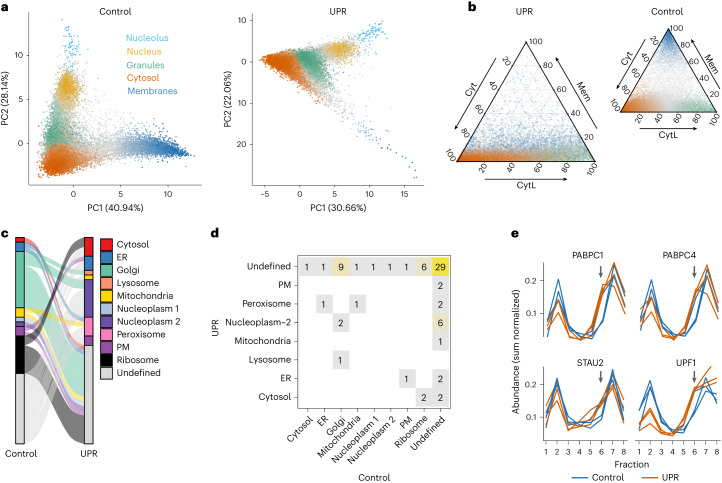
Although the subcellular dynamics of RNA and proteins are key determinants of cell homeostasis, their characterization is still challenging. Here we present an integrative framework to simultaneously interrogate the dynamics of the transcriptome and proteome at subcellular resolution by combining two methods: localization of RNA (LoRNA) and a streamlined density-based localization of proteins by isotope tagging (dLOPIT) to map RNA and protein to organelles (nucleus, endoplasmic reticulum and mitochondria) and membraneless compartments (cytosol, nucleolus and cytosolic granules). Interrogating all RNA subcellular locations at once enables system-wide quantification of the proportional distribution of RNA. We obtain a cell-wide overview of localization dynamics for 31,839 transcripts and 5,314 proteins during the unfolded protein response, revealing that endoplasmic reticulum-localized transcripts are more efficiently recruited to cytosolic granules than cytosolic RNAs, and that the translation initiation factor eIF3d is key to sustaining cytoskeletal function. Overall, we provide the most comprehensive overview so far of RNA and protein subcellular localization dynamics.


Conflict of interest statement

The authors declare no competing interests.

Figures

Fig. 1
Fig. 1. Simultaneous analysis of RNA and protein subcellular localization.
a, Schematic representation of the subcellular fractionation framework. Cells are lysed and fractionated by density equilibrium centrifugation. RNA and protein are extracted from each fraction to perform LoRNA and dLOPIT. Cell lysate and the gradient banding pattern are represented in yellow. Aqueous and organic phases are blue and red, respectively. b, Application of LoRNA to U-2 OS cells. c, Mean profiles for RNA markers along pooled gradient fractions in a single experiment. Shaded regions denote ± one standard error. d, Principal component analysis projection of RNA profiles across three replicate experiments, with marker RNAs highlighted. e, Application of dLOPIT to U-2 OS cells. f, Distributions of F1 scores for protein markers for each localization using support vector machine classification. n = 50 iterations. PM, plasma membrane. g, t-Distributed stochastic neighbor embedding projections for protein localization profiles across three replicate experiments, with marker proteins highlighted.
Fig. 2
Fig. 2. System-wide quantification of RNA localization.
a, Schematic representation of how localization proportions are estimated. New profile (left) is decomposed into different proportions of each marker profile (middle) to approximate the original profile (right). b, Cytosol (Cyt), membrane (Mem) and nuclear (including nucleolus) (Nuc) proportions for all transcripts (left) and well-documented localization markers (right). c, Schematic representation of cell fractionation by sedimentation coefficient and linear profiles of the localization markers. d, Principal component analysis projections of RNA profiles, with markers highlighted. e, Membrane, nucleus and cytosol proportions obtained by equilibrium density centrifugation-based LoRNA projected on the sedimentation-based RNA localization results. f, Correlations between proportions obtained using different fractionation approaches. Cytosol proportion by density is the sum of cytosol and cytosol-light proportions. Membrane proportion by sedimentation is the sum of mitochondrial and ER proportions.
Fig. 3
Fig. 3. Features driving RNA localization.
a, Cytosol (Cyt), nucleus (Nuc) and membrane (Mem) proportions for mRNAs and lncRNAs. b, Empirical cumulative frequency distributions for nucleus proportions for mRNAs and lncRNAs. c, Coefficient estimates for logistic regression model of lncRNA cytosol proportions. P values derived from two-tailed z-test. d, Proportions for mRNAs encoding signal peptides and/or TM domains. e, Membrane proportions for mRNAs shown in d. f, GO terms significantly enriched in mRNAs not encoding signal peptides and/or TM domains but over 35% membrane localized. P values derived from a two-tailed hypergeometric test and adjusted for multiple testing using the Benjamini–Hochberg FDR correction. CC, cell compartment. MF, molecular function. g, smFISH/IF images of digitonin-extracted (Dig+) and control (Dig−) U-2 OS cells co-stained for the ER (calnexin, magenta), and MACF1 and DST RNAs (green). Calpain2 and PIGT RNAs are shown as examples of cytosolic transcripts and known ER transcripts, respectively. Scale bar, 10 μm. h, Quantification of RNA transcripts in digitonin-treated cells, using control (untreated) cells for normalization. At least 30 cells were quantified per condition. ****P < 0.0001 (two-tailed Mann–Whitney U test).
Fig. 4
Fig. 4. Transcriptome and proteome subcellular redistribution upon UPR.
a, Principal component analysis projection of RNA profiles in control and UPR. Color and intensity indicate RNA proportions for the primary localization. PC2 in UPR is inverted. b, Cytosol (Cyt), membrane (Mem) and cytosol light (CytL) proportions in control and UPR. Point color indicates RNA major localization (excluding nucleus and nucleolus) in control, with color intensity denoting proportion. c, Localizations for proteins with confident differential localization between control and UPR, excluding Undefined to Undefined. PM, plasma membrane. d, Differential localizations frequencies between control and UPR. e, Abundance profiles for SG proteins relocalizing from ribosomes to the fraction discriminating the cytosol-light-RNA profile under UPR; gray arrows mark cytosol light discriminating fraction.
Fig. 5
Fig. 5. Analysis of the characteristics driving RNAs to granules.
a, Distributions for changes in granule proportions upon UPR activation for lncRNA and mRNAs. Results from a two-sample Kolmogorov–Smirnov (K–S) test that the distributions are different are shown. D, distance statistic. b, Relocalization to granules upon UPR activation. RNAs are binned by transcript length and split by gene biotype. lncRNAs and mRNAs are represented as gray and pink dots respectively. Black bar, median. *P < 0.001 two-tailed Wilcoxon rank-sum test for lncRNAs versus mRNAs. For exact P values and n numbers, see Supplementary Table 4. c, As per b, with bins by AU content. d, Relocalization to granules upon UPR activation. RNAs are binned by transcript length and split by localization in control condition. Box extends to the 25th and 75th percentiles. Whiskers extend to range, excluding outliers. Outliers are defined as greater than 1.5× the interquartile range from the box. *P < 0.001 two-tailed Wilcoxon rank-sum test for membrane versus cytosol. For exact P values and n numbers, see Supplementary Table 4. e, Representative smFISH/IF images showing PIGT and CD9 RNA localization relative to the ER (calnexin) in control conditions and relative to SGs (G3BP1) upon UPR activation, n = 3 independent experiments. Scale bar, 10 μm. f, Coefficients for features selected by lasso regression model of mRNA relocalization to granules. Coefficients for RNA length features. g, Coefficients for features describing RBP binding or the interaction between RBP binding and localization in control. RBP eCLIP cell line indicated in the feature name. Positive coefficients mean increased relocalization to granules. h, Coefficients and AU content for k-mer features. i, Coefficients for codon features.
Fig. 6
Fig. 6. Analysis of the RNAs retaining membrane association under UPR.
a, Membrane proportions in control and UPR. Yellow line indicates fit from GAM with cubic regression spline. b, Relationship between residual from GAM and the distance between the first signal or TM domain and stop codon. Blue line indicates smoothed fit by LOESS local regression. AA, amino acid. c, Coefficients for RBPs that are predictors of GAM residuals for RNAs that do not encode a signal peptide/TM domain. RBP eCLIP cell line is indicated in the feature name. P value from analysis of variance comparing GAM ± stratification by eIF3d binding. d, Membrane proportions as per a, for RNAs bound by eIF3d according to eCLIP or Subunit-seq. e, GO terms enriched in membrane RNAs bound by eIF3d, relative to all membrane RNAs. BP, biological process. CC, cellular compartment. MF, molecular function. f, Cytosolic (Cyt) and membrane (Mem)-associated RNA extraction using digitonin under UPR induction. MTX1, SSR2 and PSK1N are non-eIF3d ER-associated controls. All RNAs are normalized to the MT-ND6 housekeeping transcript. Changes in RNA localization upon eIF3d siRNA are relative to the RNA localization in the scrambled siRNA condition. Error bars represent standard deviation (n = 5 independent cytosol and membrane RNA extractions per condition). **P = 0.0079 (two-tailed Mann–Whitney U test). g, Representative U-2 OS cell migration time series for eIF3d knockdown and siRNA control (siCt) cells in control and UPR conditions. Cell index denotes impedance measured from migrating cells. h, Quantification of cell migration from g at 24 h post UPR induction in eIF3d knockdown and siRNA control cells (n = 5 independent experiments). P value derived from a two-tailed paired t-test.

References

    1. Keene JD. RNA regulons: coordination of post-transcriptional events. Nat. Rev. Genet. 2007;8:533–543. - PubMed
    1. Chouaib R, et al. A dual protein-mRNA localization screen reveals compartmentalized translation and widespread co-translational RNA targeting. Dev. Cell. 2020;54:773–791.e5. - PubMed
    1. Christopher, J. A., Geladaki, A., Dawson, C. S., Vennard, O. L. & Lilley, K. S. Subcellular transcriptomics & proteomics: a comparative methods review. Mol. Cell. Proteomics10.1016/j.mcpro.2021.100186 (2021). - PMC - PubMed
    1. Christopher JA, et al. Subcellular proteomics. Nat. Rev. Methods Prim. 2021;1:32. - PMC - PubMed
    1. Christoforou A, et al. A draft map of the mouse pluripotent stem cell spatial proteome. Nat. Commun. 2016;7:9992. - PMC - PubMed