. 2023 Nov 30;20(1):285.
doi: 10.1186/s12974-023-02941-4.

Single-cell RNA sequencing unveils Lrg1's role in cerebral ischemia‒reperfusion injury by modulating various cells

Affiliations

Single-cell RNA sequencing unveils Lrg1's role in cerebral ischemia‒reperfusion injury by modulating various cells

Zhaohui Ruan et al. J Neuroinflammation. .

Abstract

Background and purpose: Cerebral ischemia‒reperfusion injury causes significant harm to human health and is a major contributor to stroke-related deaths worldwide. Current treatments are limited, and new, more effective prevention and treatment strategies that target multiple cell components are urgently needed. Leucine-rich alpha-2 glycoprotein 1 (Lrg1) appears to be associated with the progression of cerebral ischemia‒reperfusion injury, but the exact mechanism of it is unknown.

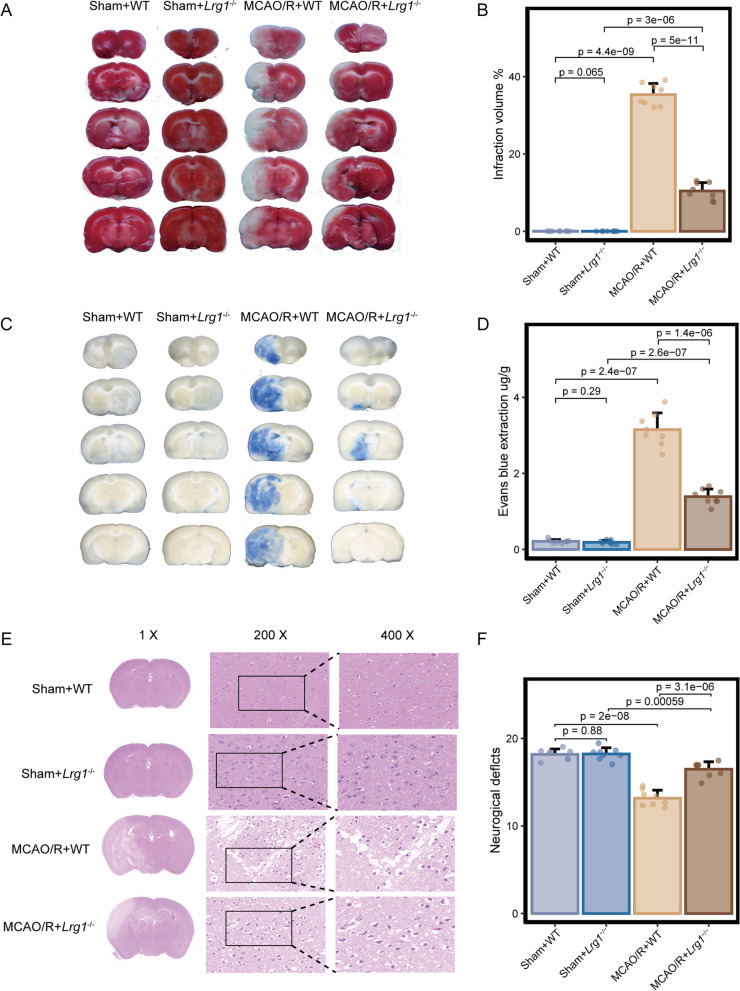
Methods: Wild-type (WT) and Lrg1 knockout (Lrg1-/-) mice were used to investigate the role of Lrg1 after cerebral ischemia‒reperfusion injury. The effects of Lrg1 knockout on brain infarct volume, blood‒brain barrier permeability, and neurological score (based on 2,3,5-triphenyl tetrazolium chloride, evans blue dye, hematoxylin, and eosin staining) were assessed. Single-cell RNA sequencing (scRNA-seq), immunofluorescence, and microvascular albumin leakage tests were utilized to investigate alterations in various cell components in brain tissue after Lrg1 knockout.

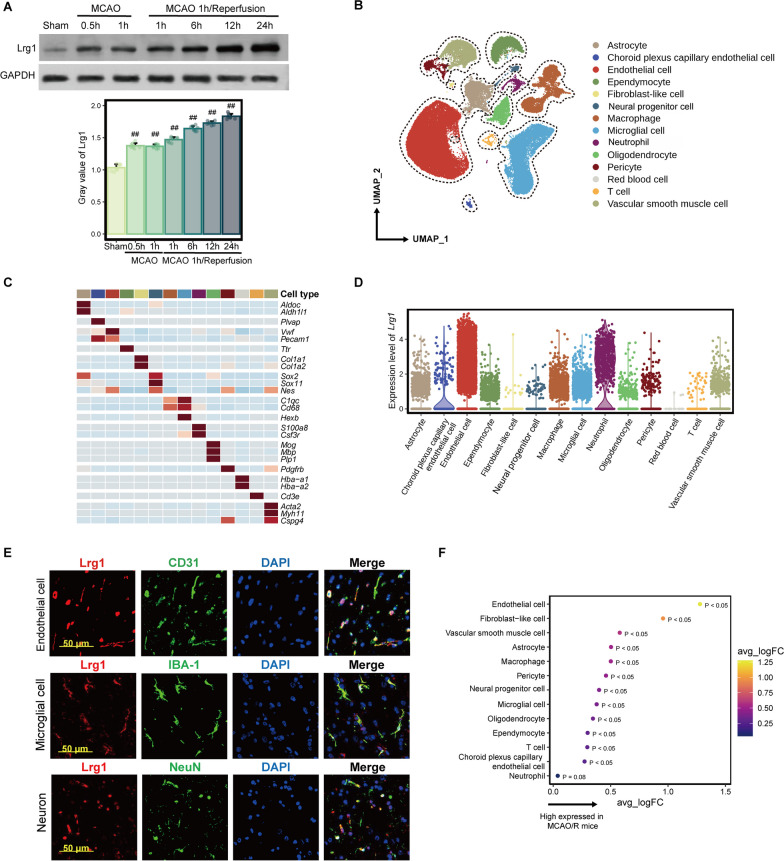
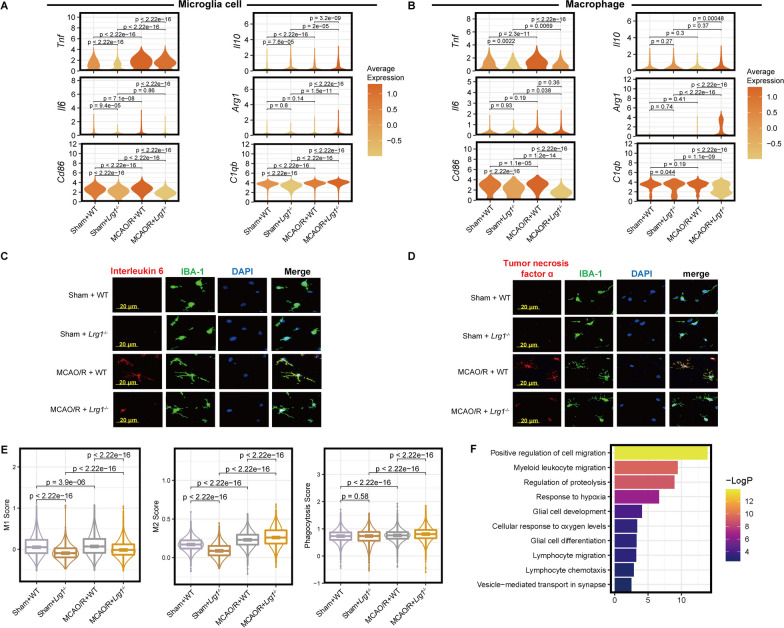
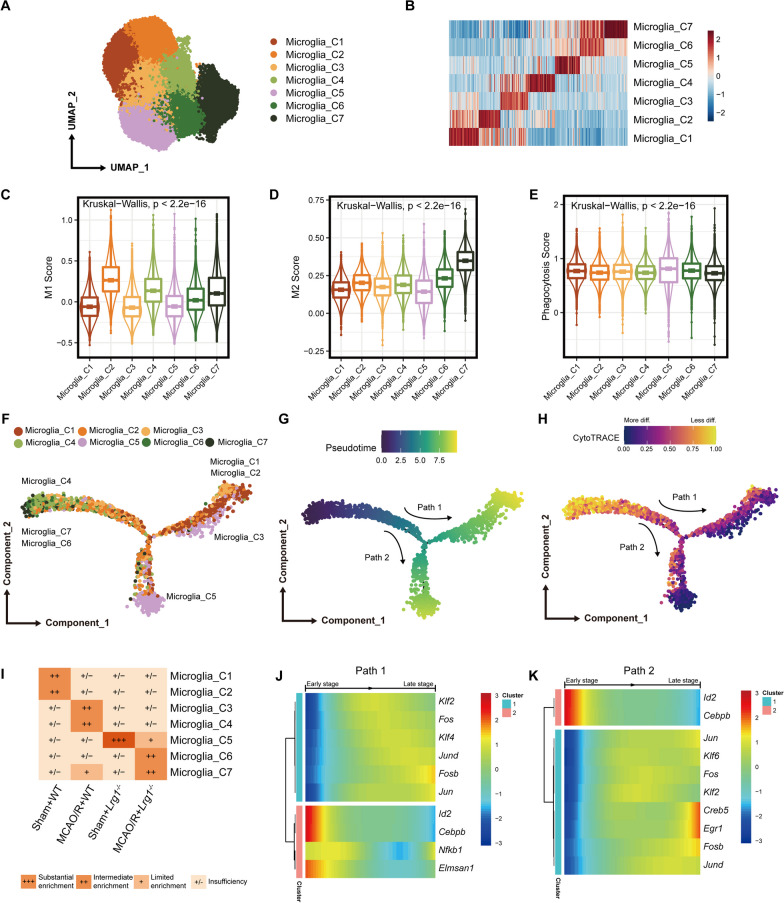
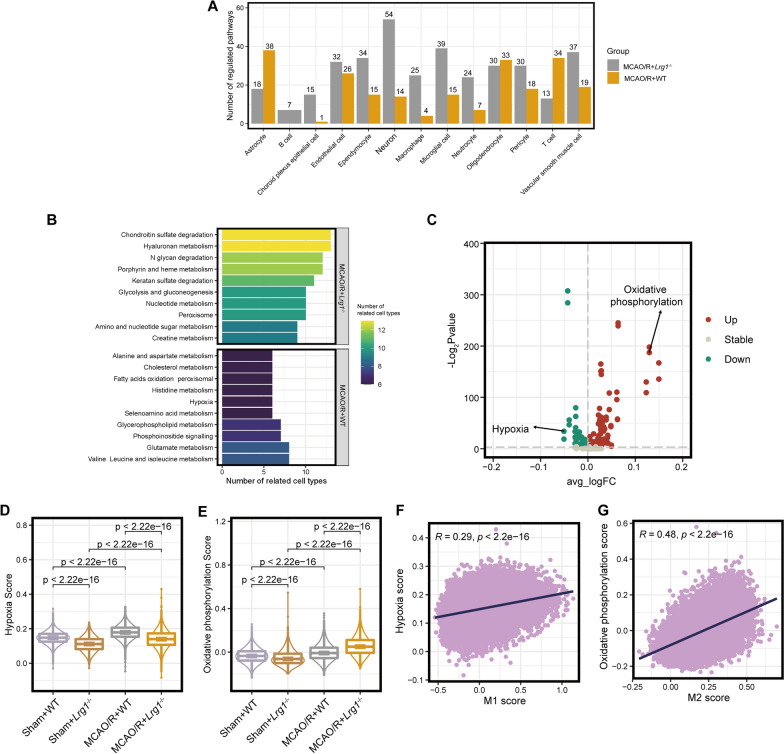
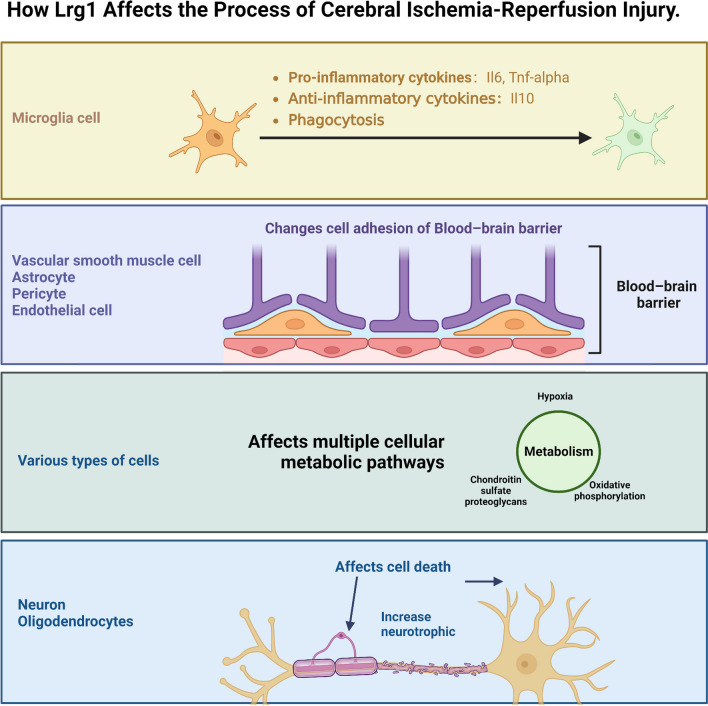
Results: Lrg1 expression was increased in various cell types of brain tissue after cerebral ischemia‒reperfusion injury. Lrg1 knockout reduced cerebral edema and infarct size and improved neurological function after cerebral ischemia‒reperfusion injury. Single-cell RNA sequencing analysis of WT and Lrg1-/- mouse brain tissues after cerebral ischemia‒reperfusion injury revealed that Lrg1 knockout enhances blood‒brain barrier (BBB) by upregulating claudin 11, integrin β5, protocadherin 9, and annexin A2. Lrg1 knockout also promoted an anti-inflammatory and tissue-repairing phenotype in microglia and macrophages while reducing neuron and oligodendrocyte cell death.

Conclusions: Our results has shown that Lrg1 mediates numerous pathological processes involved in cerebral ischemia‒reperfusion injury by altering the functional states of various cell types, thereby rendering it a promising therapeutic target for cerebral ischemia‒reperfusion injury.

Keywords: Cerebral ischemia–reperfusion injury; Lrg1 knockout; Microglial cell; Single-cell RNA-seq.


Conflict of interest statement

The authors declare that they do not have any competing interests. Figure 8 in Supplementary Information was created with BioRender https://biorender.com/ (accessed on 7 November 2023).

Figures

Fig. 1
Fig. 1
Elevated Lrg1 expression in multiple cell types in brain tissue during cerebral ischemia‒reperfusion injury. A Western blotting was used to determine total Lrg1 expression in brain tissues during different durations in MCAO/R mice. Mice were exposed to 0.5 and 1 h of ischemia and 1, 6, 12, and 24 h of reperfusion. Data are the mean ± SD, n = 8. ##p < 0.01 vs. sham group. B The UMAP plot presents the single-cell atlas of brain tissue after cerebral ischemia‒reperfusion injury. C The heatmap illustrates the expression of recognized marker genes in different cell types. D The violin plot displays Lrg1 expression in different cell types. E Immunofluorescence staining verified Lrg1 expression (red) in endothelial cells, neurons, and microglial cells in mouse brain tissues after MCAO/R. Scale bar = 50 μm. F The dot plot presents the differential expression analysis results of Lrg1 in various cell types between the MCAO/R and sham groups. An average log fold change (avg_logFC) value > 0 indicates that Lrg1 is expressed at higher levels in the MCAO/R group than in the sham group
Fig. 2
Fig. 2
Effects of Lrg1 knockout on brain tissue damage in cerebral ischemia‒reperfusion mice. Mice were exposed to 1 h of ischemia and 24 h of reperfusion. A, B Gross slice figures of MCAO/R mouse brains stained with 2,3,5triphenyl tetrazolium chloride. The brain appeared red based on the interaction between TTC and dehydrogenase in the no infarction area, and the color faded to white in the no infarction area. Error bar graph showing the results of TTC staining in different groups. Data are expressed as the mean ± SD, n = 8. C, D Gross appearance of brains exposed to 1 h of ischemia and 24 h of reperfusion was observed based on Evans blue staining. Error bar graph showing the results of Evans blue staining in different groups. Data are expressed as the mean ± SD, n = 8. E H&E staining reveals morphology of brain tissues of MCAO/R mice based on light microscopic assessment. The damaged brain tissues exhibited white interspaces, pyknotic nuclei, appeared holes, and signs of bleeding. Scale bar = 1 × ; 200 × ; 400 × . F Measurement of neurological deficit scores of MCAO/R mice. Error bar graph showing the results of neurological deficit score in different groups. Data are expressed as the mean ± SD, n = 8
Fig. 3
Fig. 3
Single-cell transcriptomic data demonstrate that the impact of Lrg1 knockout on various cellular components in brain tissue of cerebral ischemia‒reperfusion mice. A A schematic representation of the experimental design employed in this study is depicted. B UMAP plots of 99,991 cells from 11 mice, including 14 cell types. C Heatmap of gene expression across different cell types. D Boxplot displaying cell purity for cell types. E Bar graph showing the number of differentially expressed genes for different cell types. F Bar graph showing the proportion of genes with unique changes in a single cell type among differentially upregulated or downregulated genes in MCAO/R + Lrg1−/− mice compared to MCAO/R + WT mice
Fig. 4
Fig. 4
Lrg1 knockout reduces BBB dysfunction after cerebral ischemia‒reperfusion injury in mice. A Venn diagram illustrating the overlapping differentially expressed genes in BBB constituent cells (upregulated in brain tissue of Lrg1−/− mice after cerebral ischemia‒reperfusion injury compared to WT mice). B Pathway enrichment analysis results of the 99 overlapping differentially expressed genes of BBB constituent cells. C Violin plots displaying the expression of intercellular adhesion molecules in BBB constituent cells of different groups and colored according to the standardized expression median. DG Representative immunofluorescence images showing the protein expression of Claudin 11, Annexin A2, Integrin β5, and Protocadherin 9 in the brain tissues of mice from different groups. Scale bar = 20 μm. H Microvascular albumin leakage test showing the change in albumin leakage in the venules of the brain tissues from different mouse groups. I Error bar graph showing the results of the microvascular albumin leakage test in different groups. Data are expressed as the mean ± SD, n = 8. Scale bar = 400 ×
Fig. 5
Fig. 5
Lrg1 knockout alters the functional state of microglial cells and macrophages after cerebral ischemia‒reperfusion injury in mice. A Violin plot showing the expression of functional molecules in microglial cells of different groups. The coloring is based on the standardized median expression of each group. B Violin plot exhibiting the expression of functional molecules in macrophages of different groups. The coloring is based on the standardized median expression of each group. C Representative images showing interleukin 6 protein expression in the brain tissues of mice from different groups. Scale bar = 20 μm. D Representative images showing tumor necrosis factor α protein expression in the brain tissues of mice from different groups. Scale bar = 20 μm. E Box plot showing the functional state score of microglial cells from different groups. F Pathway enrichment analysis of upregulated differentially expressed genes in microglial cells in brain tissues of Lrg1−/− mice after MCAO/R compared with WT mice after MCAO/R
Fig. 6
Fig. 6
Lrg1 knockout affects microglial cell maturation after cerebral ischemia‒reperfusion injury in mice. A The UMAP plot illustrates the clustering results of microglial cells in brain tissue after MCAO/R. B The heatmap depicts the expression of the top 50 differentially expressed genes in distinct microglia subpopulations. C The box plot demonstrates the M1 score in microglial cells across different clusters. D The box plot exhibits the M2 score in microglial cells across different clusters. E The box plot displays the phagocytosis scores in microglia across different clusters. F The dot plot demonstrates the distribution of different clusters in the differentiation trajectory plot of microglial cells in Sham + WT group constructed using monocle2. G The dot plot illustrates the differentiation trajectories of microglial subpopulations in Sham + WT group drawn by monocle2. The direction of arrows indicates the direction of differentiation and development. H The dot plot illustrates the differentiation trajectories of microglial subpopulations in Sham + WT group drawn by CytoTRACE. The direction of arrows indicates the direction of differentiation and development. I Heatmap visualizations depicted the enrichment profiles of distinct cell clusters (rows) across diverse groups (columns). The coloration within the cells corresponds to the Ro/e values, denoting the extent of cell cluster enrichment as delineated below: Insufficiency: Ro/e  ≤ 1; Limited Enrichment: 1 <  Ro/e  ≤ 1.5; Intermediate Enrichment: 1.5 <  Ro/e  ≤ 3; Substantial Enrichment: Ro/e  > 3. J The heatmap illustrates the transcription factors of Path 1 that change with the trajectory in Sham + WT group. Different TF clusters signify TFs with varying expression patterns along the trajectory. K The heatmap demonstrates the transcription factors of Path 2 that change with the trajectory in Sham + WT group. Different TF clusters represent TFs with distinct expression patterns along the trajectory
Fig. 7
Fig. 7
Lrg1 knockout alters the metabolic status of multiple cell populations after cerebral ischemia‒reperfusion injury in mice. A The bar chart displays the differences in metabolic pathways between various cell populations in different groups. B The bar chart presents the common differentially regulated metabolic pathways in various cell populations between different groups. C The volcano plot depicts the differentially regulated metabolic pathways in microglial cells between different groups. D The box plot shows the results of oxidative phosphorylation scores in microglial cells from different groups. E The box plot displays the results of hypoxia scores in microglial cells from different groups. F The dot plot demonstrates the correlation between hypoxia scores and M1 scores in microglial cells. G The dot plot illustrates the correlation between oxidative phosphorylation scores and M2 scores in microglial cells
Fig. 8
Fig. 8
Schematic diagram of the mechanism by which Lrg1 affects the process of cerebral ischemia‒reperfusion injury in mice

References

    1. Global, regional, and national disability-adjusted life-years (DALYs) for 333 diseases and injuries and healthy life expectancy (HALE) for 195 countries and territories, 1990–2016: a systematic analysis for the Global Burden of Disease Study 2016. Lancet (London, England). 2017; 390(10100): 1260–344. - PMC - PubMed
    1. Kalogeris T, Baines CP, Krenz M, Korthuis RJ. Ischemia/Reperfusion. Compr Physiol. 2016;7(1):113–170. doi: 10.1002/cphy.c160006. - DOI - PMC - PubMed
    1. Eltzschig HK, Eckle T. Ischemia and reperfusion—from mechanism to translation. Nat Med. 2011;17(11):1391–1401. doi: 10.1038/nm.2507. - DOI - PMC - PubMed
    1. Guo X, Liu R, Jia M, Wang Q, Wu J. Ischemia reperfusion injury induced blood brain barrier dysfunction and the involved molecular mechanism. Neurochem Res. 2023;8:2320–2334. doi: 10.1007/s11064-023-03923-x. - DOI - PubMed
    1. Menaceur C, Gosselet F, Fenart L, Saint-Pol J. The blood-brain barrier, an evolving concept based on technological advances and cell-cell communications. Cells. 2022;11(1):133. doi: 10.3390/cells11010133. - DOI - PMC - PubMed

Substances