. 2023 Nov 30;11(1):268.
doi: 10.1186/s40168-023-01677-w.

Salivary microbiome changes distinguish response to chemoradiotherapy in patients with oral cancer

Affiliations

Salivary microbiome changes distinguish response to chemoradiotherapy in patients with oral cancer

Marcell Costa de Medeiros et al. Microbiome. .

Abstract

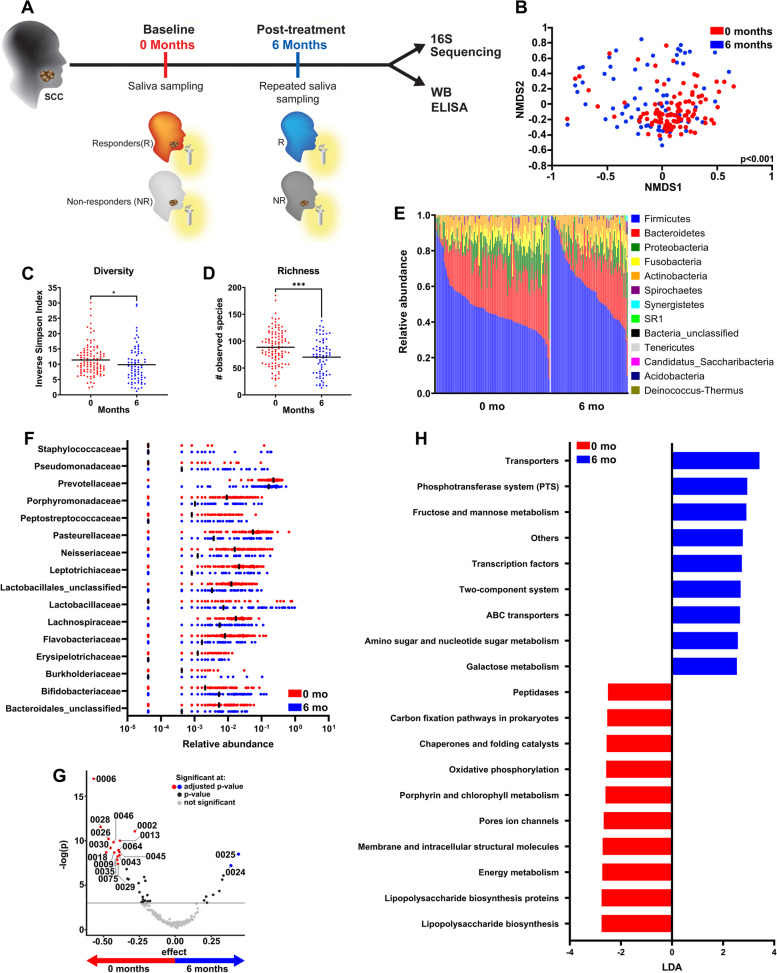
Background: Oral squamous cell carcinoma (SCC) is associated with oral microbial dysbiosis. In this unique study, we compared pre- to post-treatment salivary microbiome in patients with SCC by 16S rRNA gene sequencing and examined how microbiome changes correlated with the expression of an anti-microbial protein.

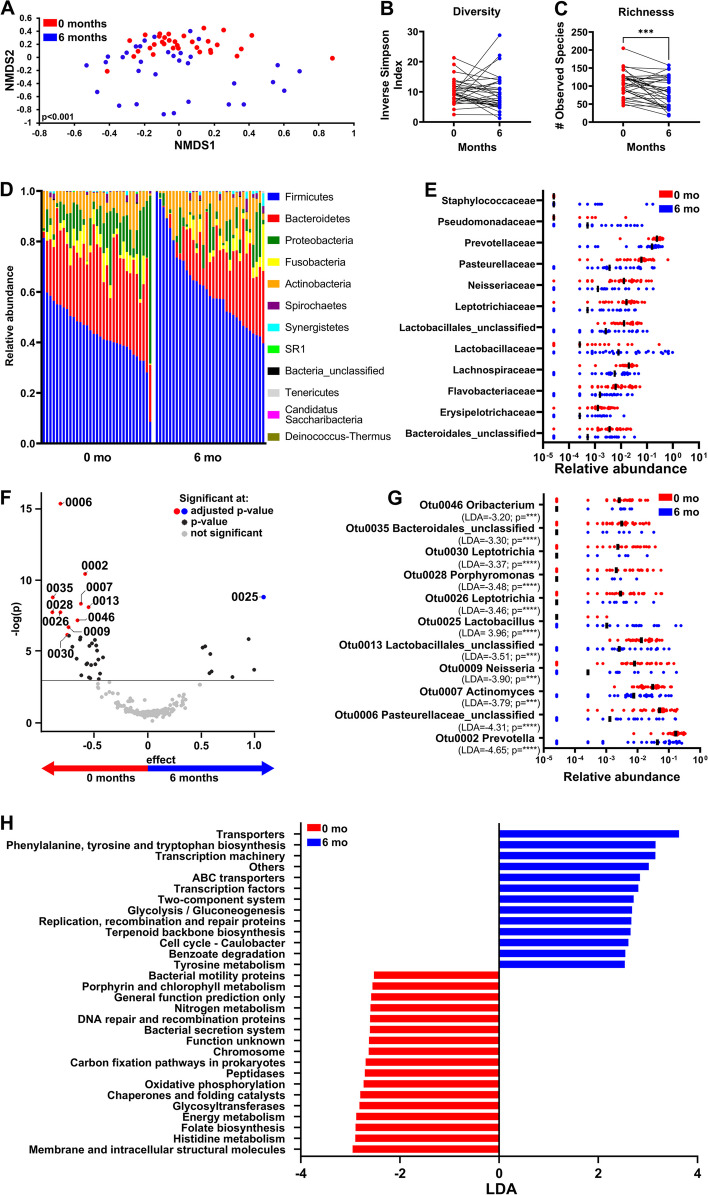
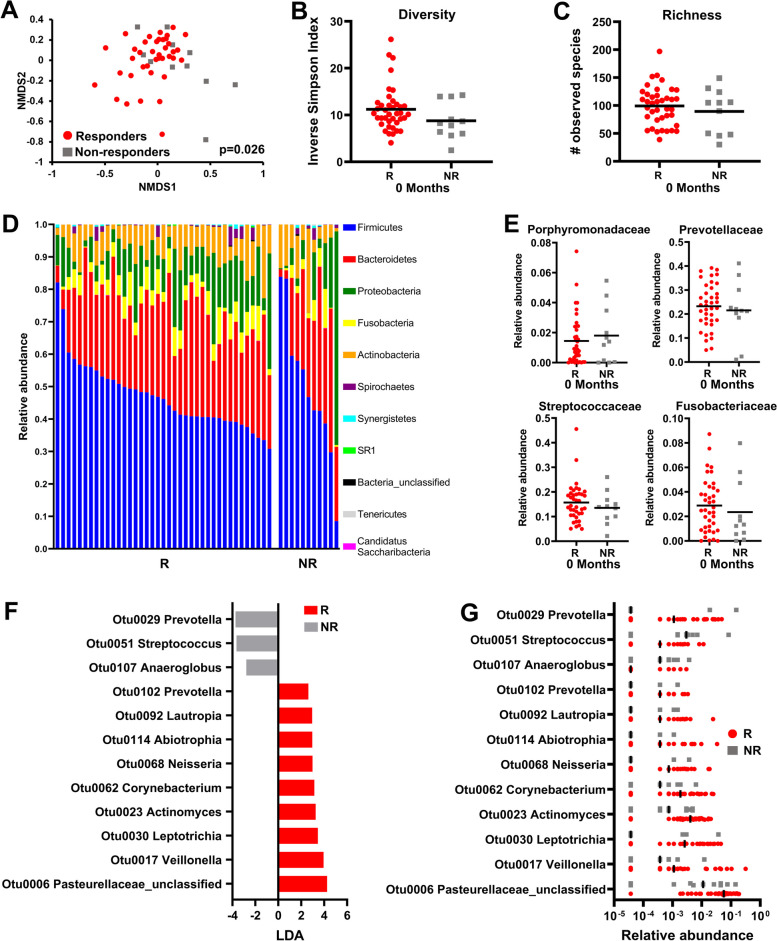
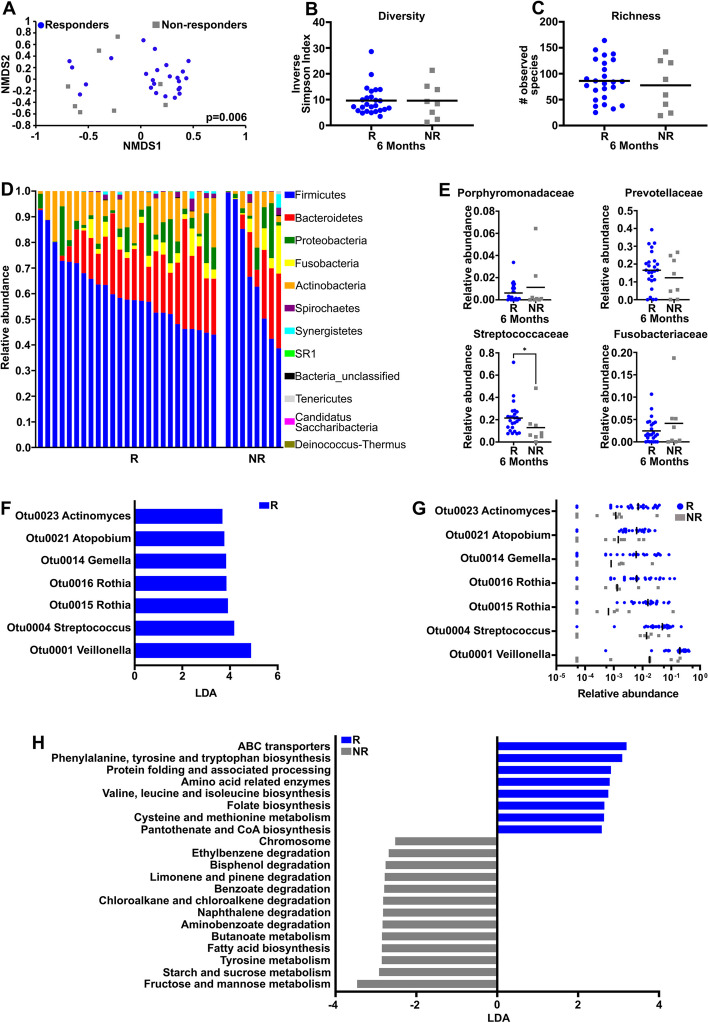
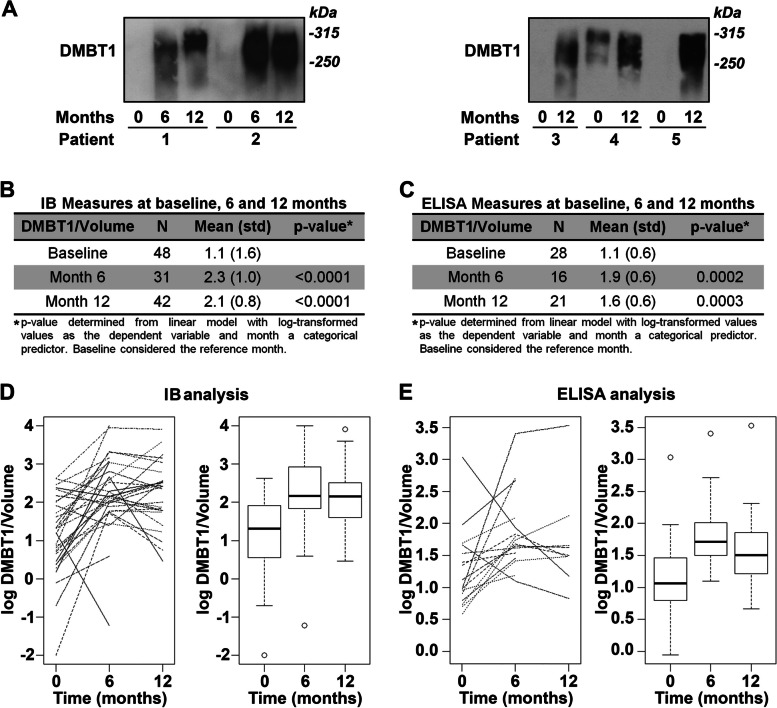
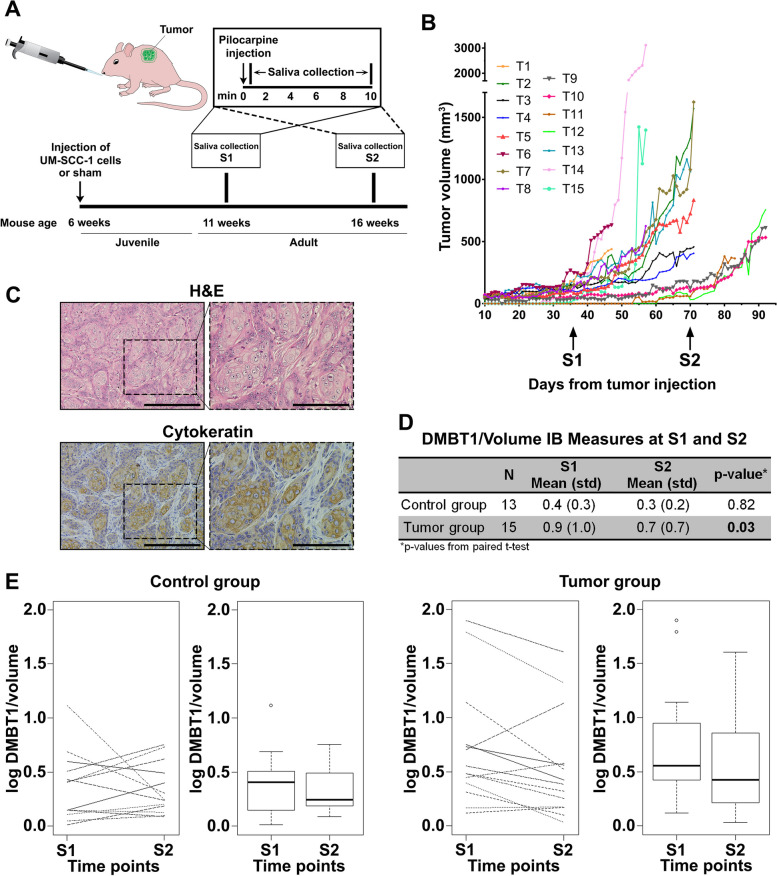
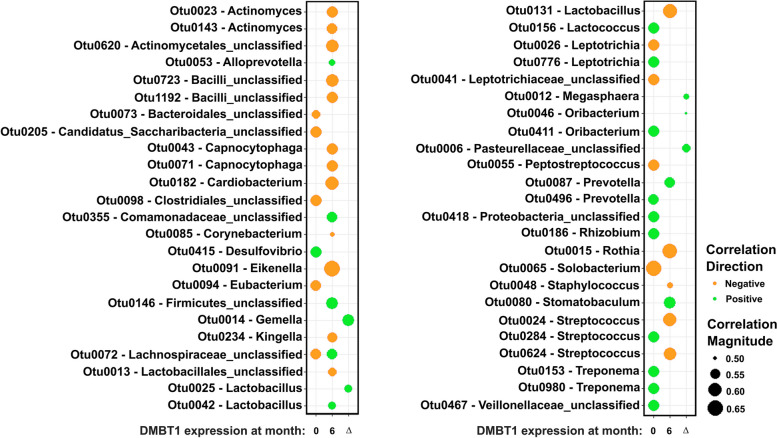
Results: Treatment of SCC was associated with a reduction in overall bacterial richness and diversity. There were significant changes in the microbial community structure, including a decrease in the abundance of Porphyromonaceae and Prevotellaceae and an increase in Lactobacillaceae. There were also significant changes in the microbial community structure before and after treatment with chemoradiotherapy, but not with surgery alone. In patients treated with chemoradiotherapy alone, several bacterial populations were differentially abundant between responders and non-responders before and after therapy. Microbiome changes were associated with a change in the expression of DMBT1, an anti-microbial protein in human saliva. Additionally, we found that salivary DMBT1, which increases after treatment, could serve as a post-treatment salivary biomarker that links to microbial changes. Specifically, post-treatment increases in human salivary DMBT1 correlated with increased abundance of Gemella spp., Pasteurellaceae spp., Lactobacillus spp., and Oribacterium spp. This is the first longitudinal study to investigate treatment-associated changes (chemoradiotherapy and surgery) in the oral microbiome in patients with SCC along with changes in expression of an anti-microbial protein in saliva.

Conclusions: The composition of the oral microbiota may predict treatment responses; salivary DMBT1 may have a role in modulating the oral microbiome in patients with SCC. After completion of treatment, 6 months after diagnosis, patients had a less diverse and less rich oral microbiome. Leptotrichia was a highly prevalent bacteria genus associated with disease. Expression of DMBT1 was higher after treatment and associated with microbiome changes, the most prominent genus being Gemella Video Abstract.


Conflict of interest statement

The authors declare no competing interests.

Figures

Fig. 1
Fig. 1
Oral microbiome decreases in diversity and richness after treatment of SCC. A Workflow schematic of the entire study, including the sample collection, main methods, and comparisons. B Nonmetric multidimensional scaling (NMDS) ordination based on θYC distances for patients pre- and post-treatment. Diversity (C) and richness (D) of the salivary microbiome at time 0 (pre-treatment) versus 6 months (post-treatment). E Relative abundance of different phyla at 0 and 6 months. F Bacterial family members that are > 0.1% in relative abundance and significantly different between pre- and post-treatment saliva (adjusted p < 0.05). G Volcano plot indicating significantly different OTUs between 0 and 6 months based on ALDEx2 analysis (adjusted p < 0.05). H Most differentially abundant PICRUSt-predicted KEGG pathways between pre- and post-treatment groups based on LEfSe analysis (LDA cutoff of 2.5). *p < 0.05, ***p < 0.001, and ****p < 0.0001
Fig. 2
Fig. 2
Significant changes in microbiome after chemoradiotherapy. A NMDS ordination plot showing community structure differences (β-diversity), diversity (B), and richness (C) of chemoradiotherapy-treated SCC patients at 0 and 6 months. D Relative abundance of bacteria at the phylum level. E Bacterial families that are > 0.1% in abundance and significantly different (adjusted p < 0.05) before and after chemoradiotherapy. F Differentially abundant OTUs at 0 and 6 months post-chemoradiotherapy based on ALDEx2 data analysis (adjusted p < 0.05). G Relative abundance of significantly different OTUs identified by ALDEx2 and LEfSe analysis. H PICRUSt-predicted KEGG pathways that are most differentially abundant between pre- and post-chemoradiotherapy samples based on LEfSe analysis (LDA cutoff of 2.5) *p < 0.05, ***p < 0.001, and ****p < 0.0001
Fig. 3
Fig. 3
Significant change in the richness of the salivary microbiome after surgery alone. A β-diversity shown by NMDS plot, (B) diversity, and (C) richness of the salivary microbiome at 0 and 6 months in SCC patients treated with surgery alone. D Relative abundance of salivary bacteria at 0 and 6 months at the phylum level. E Most differentially abundant OTUs between pre- and post-surgery salivary microbiomes based on LEfSe analysis and (F) their relative abundances. G Most differentially abundant PICRUSt-predicted KEGG pathways before and after surgery. *p < 0.05
Fig. 4
Fig. 4
Prevotella is associated with non-responders to chemoradiotherapy at baseline. A β-diversity shown by NMDS plot, (B) diversity, and (C) richness of the salivary microbiome sampled before treatment in SCC patients that were responders (R) (i.e., no local or distant recurrences) versus non-responders (NR) to chemoradiotherapy. D Relative abundance of salivary bacteria at the phylum level between responders and non-responders at baseline. E Relative abundance of the bacterial families Porphyromonadaceae, Prevotellaceae, Streptococcocaceae, and Fusobacteriaceae. F LEfSe analysis showing the most differentially abundant OTUs at baseline between responders versus non-responders and (G) their relative abundances
Fig. 5
Fig. 5
Microbiome differences between responders and non-responders to chemoradiotherapy at 6 months. A NMDS plot comparing responders (R) vs non-responders (NR) after treatment. Diversity (B) and Richness (C) plots. D Phylogenetic composition at the phylum level in saliva samples based on treatment response after chemoradiotherapy. E Relative abundance of Porphyromonadaceae, Prevotellaceae, Streptococcaceae, and Fusobacteriaceae. F LEfSe analysis identifying the most differentially abundant OTUs between responders and non-responders after chemoradiotherapy. G Relative abundance of OTUs as identified by LEfSe (LDA > 3.5). H Most differentially abundant PICRUSt-predicted KEGG pathways in the salivary microbiome of responders and non-responders after chemoradiotherapy. *p < 0.05
Fig. 6
Fig. 6
DMBT1 secretion is suppressed in saliva from untreated SCC patients. DMBT1 levels were analyzed at baseline and 6 and 12 months for each patient. A Representative immunoblots of DMBT1 in saliva samples normalized to sample volume. B, C Log-transformed values. P values were determined using linear mixed models with compound symmetric variance structure assumed and baseline as a reference category. B Densitometric quantification of immunoblot data normalized to sample volume. C DMBT1 levels in saliva samples as determined by ELISA. D, E Each DMBT1 measure from immunoblot and ELISA quantification, respectively, was log-transformed
Fig. 7
Fig. 7
Salivary DMBT1 is reduced in mice after tumor development. A Schematic showing the timing of saliva collection. UM-SCC-1 cells or matrigel (control) were injected subcutaneously into athymic nude mice and whole stimulated saliva was collected. B Tumor volume was measured for 60 days. C Representative tumor section stained with hematoxylin–eosin and cytokeratin antibody. Scale bar = 500 µm in the left panel and 200 µm in the right panel. D Densitometric quantification of immunoblot data normalized to saliva volume collected at two time points (S1 and S2) in each adult mouse and differences tested by paired t test. E Each DMBT1 measure from immunoblot quantification was log-transformed
Fig. 8
Fig. 8
Downregulation of DMBT1 in saliva is associated with microbiome changes. Linear regression showing OTUs that correlate with DMBT1 expression at pre- (0 months), post-treatment (6 months), and difference in expression between post- to pre-treatment (Δ). Orange and green indicate negative and positive correlation directions, respectively. Circle size represents the correlation magnitude

References

    1. Goodman B, Gardner H. The microbiome and cancer. J Pathol. 2018;244(5):667–676. doi: 10.1002/path.5047. - DOI - PubMed
    1. Irfan M, Delgado RZR, Frias-Lopez J. The oral microbiome and cancer. Front Immunol. 2020;11:591088. doi: 10.3389/fimmu.2020.591088. - DOI - PMC - PubMed
    1. Bhatt AP, Redinbo MR, Bultman SJ. The role of the microbiome in cancer development and therapy. CA Cancer J Clin. 2017;67(4):326–344. doi: 10.3322/caac.21398. - DOI - PMC - PubMed
    1. Gopalakrishnan V, Helmink BA, Spencer CN, Reuben A, Wargo JA. The influence of the gut microbiome on cancer, immunity, and cancer immunotherapy. Cancer Cell. 2018;33(4):570–580. doi: 10.1016/j.ccell.2018.03.015. - DOI - PMC - PubMed
    1. Rebersek M. Gut microbiome and its role in colorectal cancer. BMC Cancer. 2021;21(1):1325. doi: 10.1186/s12885-021-09054-2. - DOI - PMC - PubMed

Publication types