

Patient- and xenograft-derived organoids recapitulate pediatric brain tumor features and patient treatments
- PMID: 38037472
- PMCID: PMC10701620
- DOI: 10.15252/emmm.202318199
Patient- and xenograft-derived organoids recapitulate pediatric brain tumor features and patient treatments
Abstract
Brain tumors are the leading cause of cancer-related death in children. Experimental in vitro models that faithfully capture the hallmarks and tumor heterogeneity of pediatric brain cancers are limited and hard to establish. We present a protocol that enables efficient generation, expansion, and biobanking of pediatric brain cancer organoids. Utilizing our protocol, we have established patient-derived organoids (PDOs) from ependymomas, medulloblastomas, low-grade glial tumors, and patient-derived xenograft organoids (PDXOs) from medulloblastoma xenografts. PDOs and PDXOs recapitulate histological features, DNA methylation profiles, and intratumor heterogeneity of the tumors from which they were derived. We also showed that PDOs can be xenografted. Most interestingly, when subjected to the same routinely applied therapeutic regimens, PDOs respond similarly to the patients. Taken together, our study highlights the potential of PDOs and PDXOs for research and translational applications for personalized medicine.
Keywords: brain tumors; organoids; patient-derived; pediatric cancer; translational applications.
© 2023 The Authors. Published under the terms of the CC BY 4.0 license.
Conflict of interest statement
The authors declare that they have no conflict of interest.
Figures
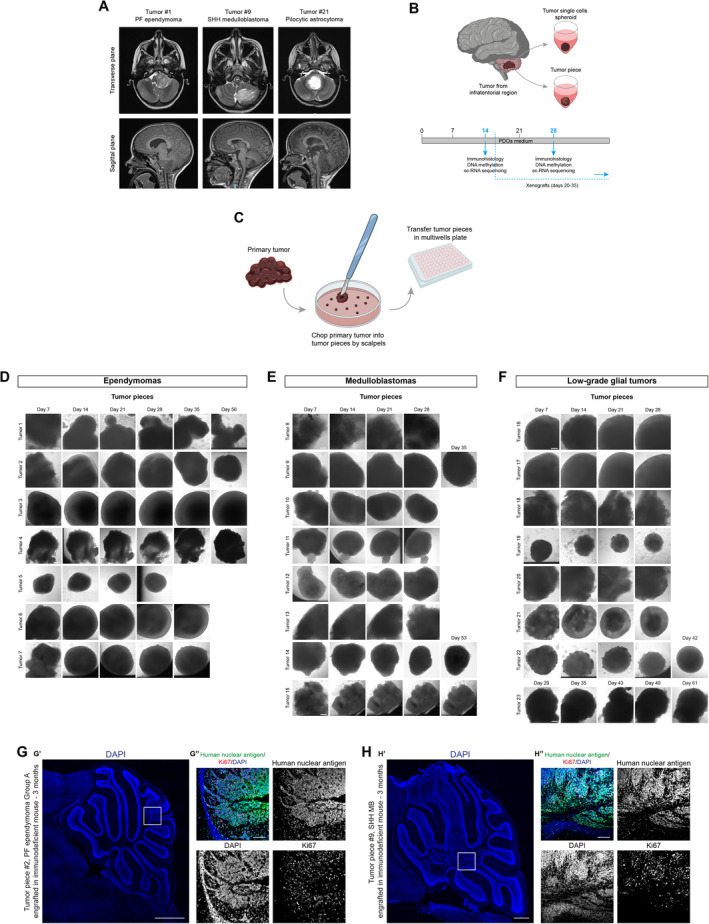
- A
Axial T2‐weighted (upper panels) and sagittal T1‐weighted MPRAGE (lower panels) MRI images relative to the indicated cases.
- B
Schematic representation of primary tumor samples management workflow.
- C
Schematic representation of primary tumor samples management for generation of PDOs as tumor piece.
- D–F
Brightfield images of EPN‐ (D), MB‐ (E), and LGG‐ (F) derived PDOs as tumor pieces at different timepoints.
- G, H
Confocal images of DAPI staining and immunofluorescence of human nuclear antigen and Ki67 of sagittal brain sections of immunodeficient mice engrafted with EPN‐ (G) and MB‐derived PDOs (H).
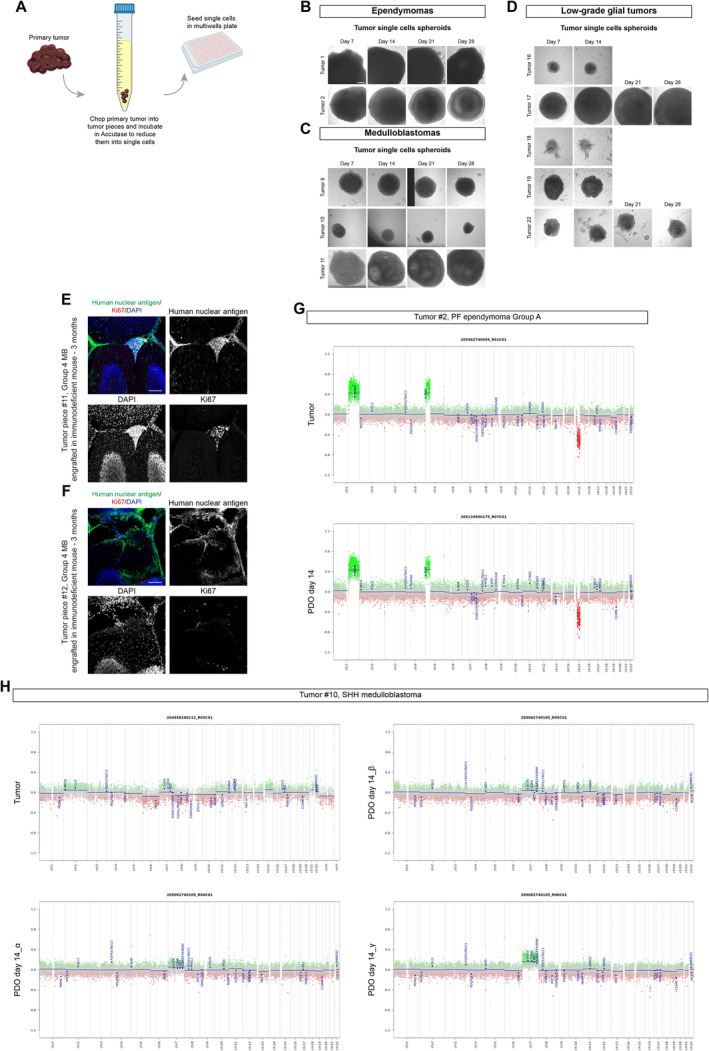
- A
Schematic representation of primary tumor samples management for generation of PDOs as tumor single cells spheroid.
- B–D
Brightfield images of tumor single cells spheroids EPN‐ (B), MB‐ (C), and LGG‐ (D) derived PDOs at different timepoints.
- E, F
Confocal images of DAPI staining and immunofluorescence of human nuclear antigen and Ki67 of sagittal brain sections of immunodeficient mice engrafted with MB‐derived PDOs.
- G, H
Copy number variation profiles comparison between primary parental tumor and 3 different MB‐PDOs (H) and EPN‐PDOs (G).
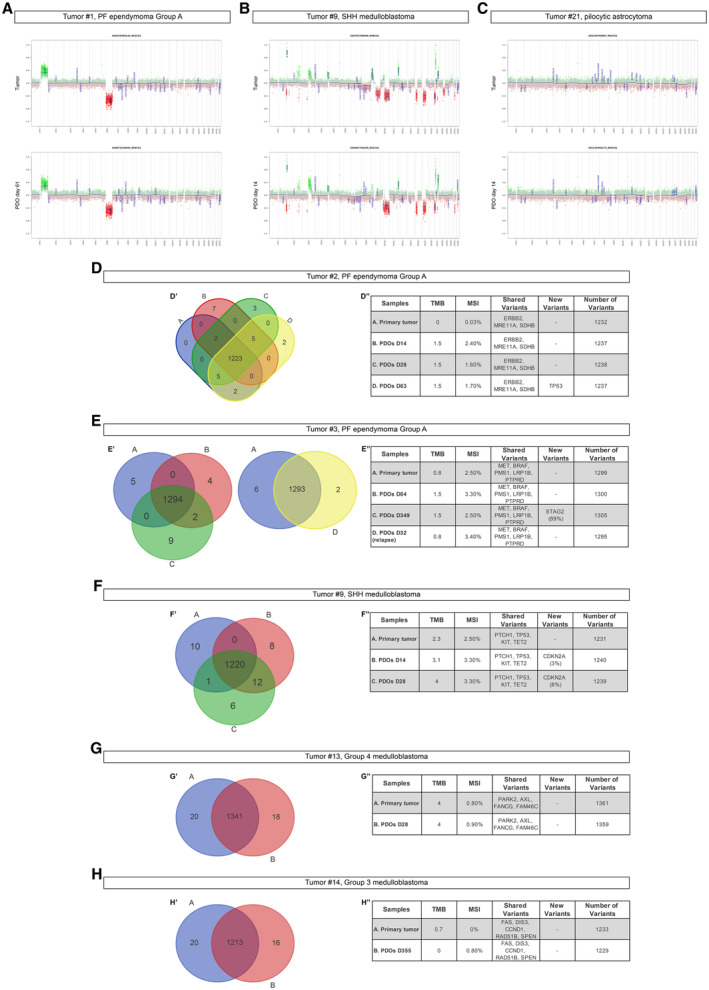
- A–C
Copy number variation profiles comparison between primary parental tumor and EPN‐ (A), MB‐ (B), and LGG‐ (C) derived PDOs.
- D–H
Venn diagram of primary tumor/PDOs at different timepoints (D'–H') and relevant shared or new variants (D''–H'') for EPN‐ (D, E) and MB‐ (F–H) derived PDOs.
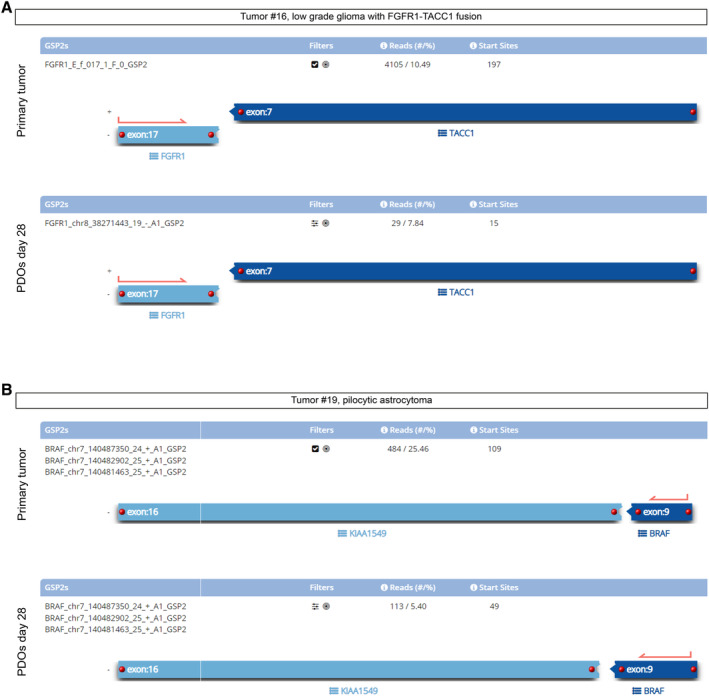
Tumor #16, LGG with FGFR1‐TACC1 fusion compared to derived PDOs at day 28: the assay detects the same fusion.
Tumor #19, KIAA1549‐BRAF fusion was detected in pilocytic astrocytoma and in derived PDOs at day 28. Both PDOs shared the same breakpoints compared to primary parental tumors.
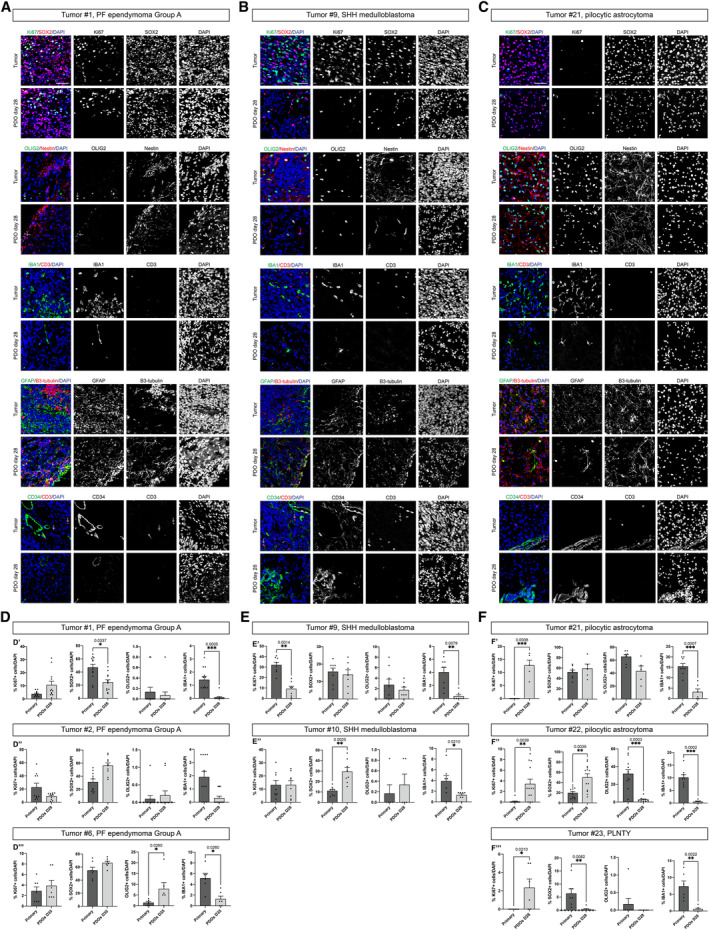
- A–C
Confocal images of immunofluorescence of Ki67, SOX2, OLIG2, Nestin, IBA1, CD3, GFAP, B3‐tubulin, CD34 of EPN‐ (A), MB‐ (B) and LGG‐ (C) derived PDOs.
- D–F
Quantification in EPN‐ (D), MB‐ (E), and LGG‐ (F) derived PDOs of Ki67+, SOX2+, OLIG2+, and IBA1+. Cells are shown as percentage of specific marker+ cells/DAPI.
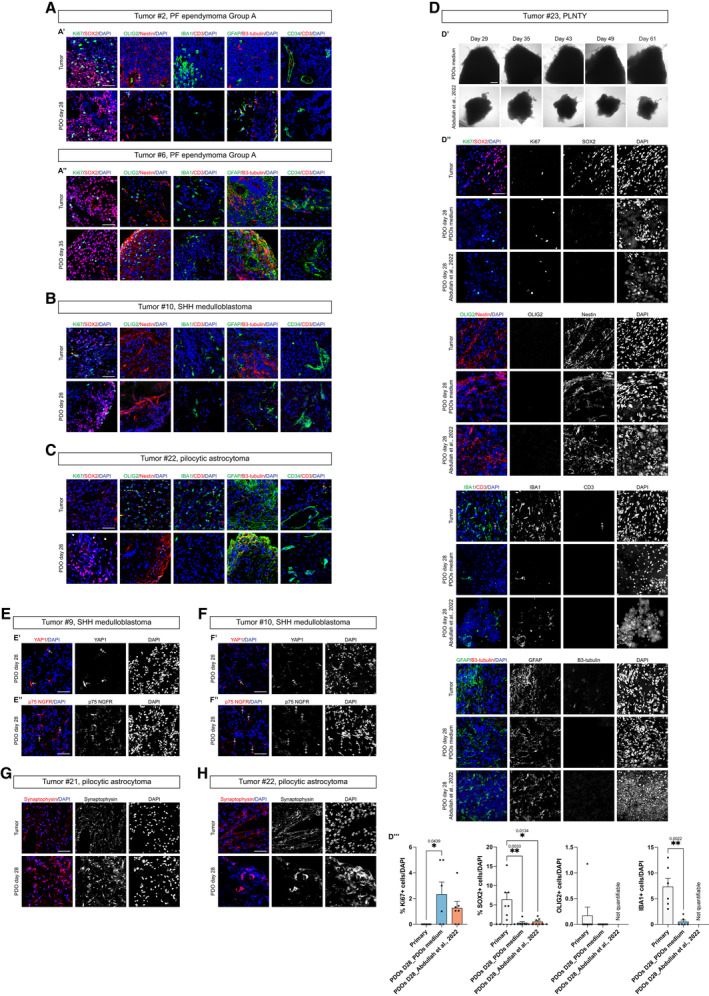
- A–C
Confocal images of immunofluorescence of Ki67, SOX2, OLIG2, Nestin, IBA1, CD3, GFAP, B3‐tubulin, CD34 of EPN‐ (A′–A″), MB‐ (B) and LGG‐ (C) derived PDOs.
- D
Brightfield images of LGG‐derived PDOs as tumor pieces at different timepoints in PDOs medium and cultured according to (Abdullah et al, 2022) (D′), confocal images of immunofluorescence of Ki67, SOX2, OLIG2, Nestin, IBA1, CD3, GFAP, B3‐tubulin (D″) and quantification in PDOs of Ki67+, SOX2+, OLIG2+ and IBA1+ cells (D″′).
- E, F
Confocal images of immunofluorescence of YAP1 (E′, F′) and p75 NGFR (E″, F″) of MB‐derived PDOs.
- G, H
Confocal images of immunofluorescence of synaptophysin of LGG‐derived PDOs. Quantifications are shown as percentage of specific marker+ cells/DAPI (D″′).
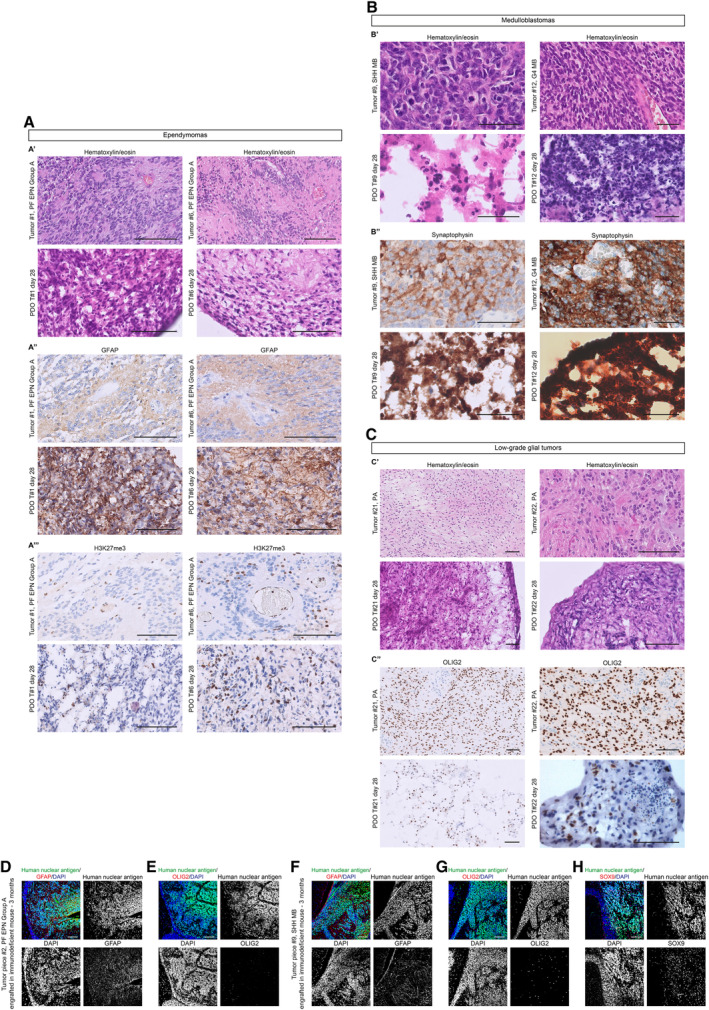
- A–C
Morphological features (A′, B′, C′) and immunohistochemical expression of lineage markers GFAP (A″), H3K27me3 (A″′), synaptophysin (B″), and OLIG2 (C″) of 2 EPN, 2 MB and 2 LGG paired parental tumors/PDOs samples.
- D, F
Confocal images of immunofluorescence of human nuclear antigen and GFAP of sagittal brain sections of immunodeficient mice engrafted with EPN‐ (D) and MB‐ (F) derived PDOs.
- E, G
Confocal images of immunofluorescence of human nuclear antigen and OLIG2 of sagittal brain sections of immunodeficient mice engrafted with EPN‐ (E) and MB‐ (G) derived PDOs.
- H
Confocal images of immunofluorescence of human nuclear antigen and SOX9 of sagittal brain sections of immunodeficient mice engrafted with MB‐derived PDOs.
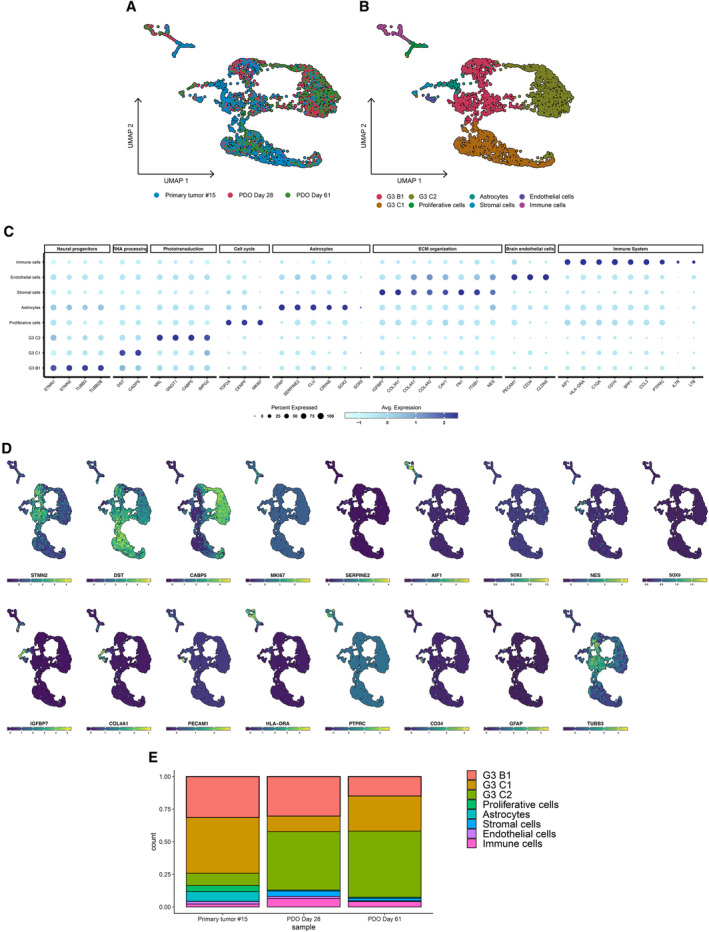
UMAP dimensionality reduction plot showing the cluster distribution of cells obtained from tumor and PDOs samples.
UMAP plot showing the different independent clusters obtained by integrating the malignant cells from “Primary tumor #15,” “PDO Day 28,” and “PDO Day 61” datasets.
Expression dotplot representing the key markers identified for each cluster and belonging to cellular and/or functional categories.
FeaturePlot showing the expression levels of key markers in each cell.
Stacked barplot representing the relative proportion (expressed in %) of the tumor and PDO cells across the different subclusters.
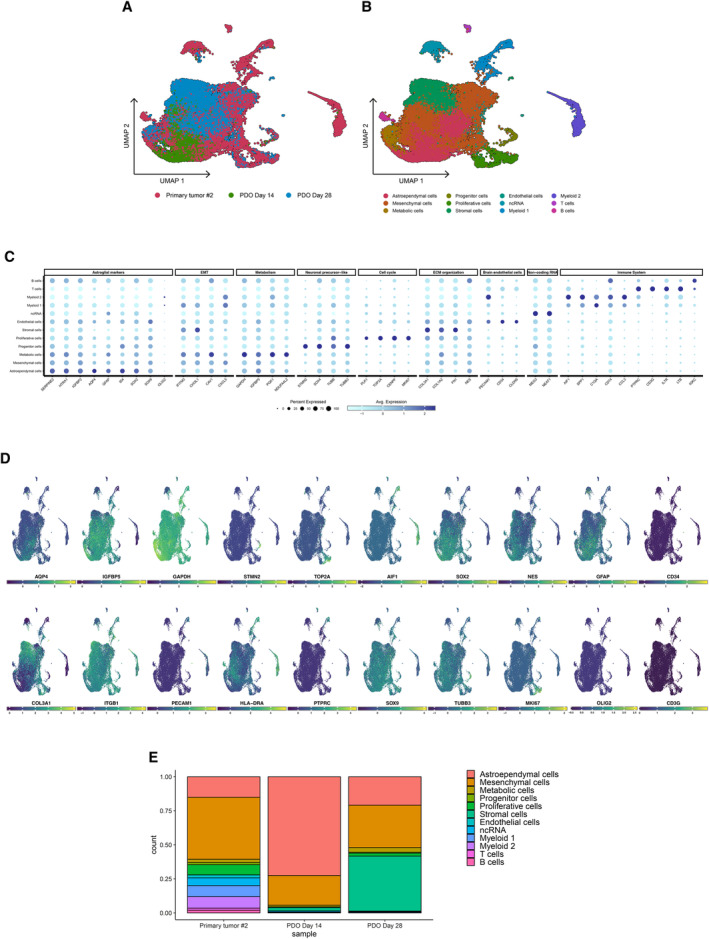
UMAP dimensionality reduction plot showing the cluster distribution of cells obtained from tumor and PDO samples.
UMAP plot showing the different independent clusters obtained by integrating the malignant cells from “Primary tumor #2,” “PDO Day 14,” and “PDO Day 28” datasets.
Expression dotplot representing the key markers identified for each cluster and belonging to cellular and/or functional categories.
FeaturePlot showing the expression levels of key markers in each cell.
Stacked barplot representing the relative proportion (expressed in %) of the tumor and PDO cells across the different subclusters.
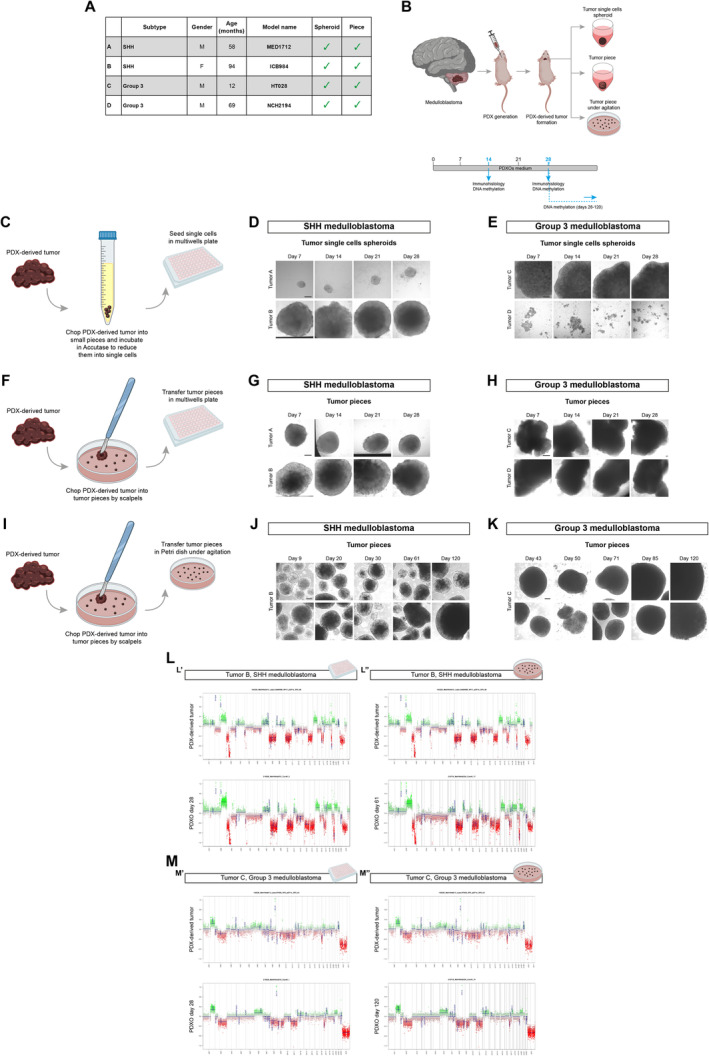
- A
List of MB PDX‐derived tumor samples with information about MB subtypes, patients (gender M: male, F: female; age in months), model name, and methods of processing (spheroid, piece).
- B
Schematic representation of PDX‐derived tumor samples management workflow.
- C
Schematic representation of PDX‐derived tumor samples management for generation of PDXOs as tumor single cells spheroid.
- D, E
Brightfield images of tumor single cells spheroid PDXOs from SHH and G3 MB‐derived PDXs at different timepoints.
- F
Schematic representation of PDX‐derived tumor samples management for generation of PDXOs as tumor piece.
- G, H
Brightfield images of tumor piece PDXOs from SHH and G3 MB‐derived PDXs at different timepoints.
- I
Schematic representation of PDX‐derived tumor samples management for generation of PDXOs as tumor piece in suspension.
- J, K
Brightfield images of tumor piece PDXOs in suspension from SHH and G3 MB‐derived PDXs at different timepoints.
- L, M
Copy number variation profiles comparison between PDX‐derived tumor and PDXOs from SHH (L) and G3 MB‐derived PDXs (M). CNVs profiles of PDXOs as tumor piece kept in multiwell are shown in (L′–M′), kept in suspension are shown in (L″–M″).
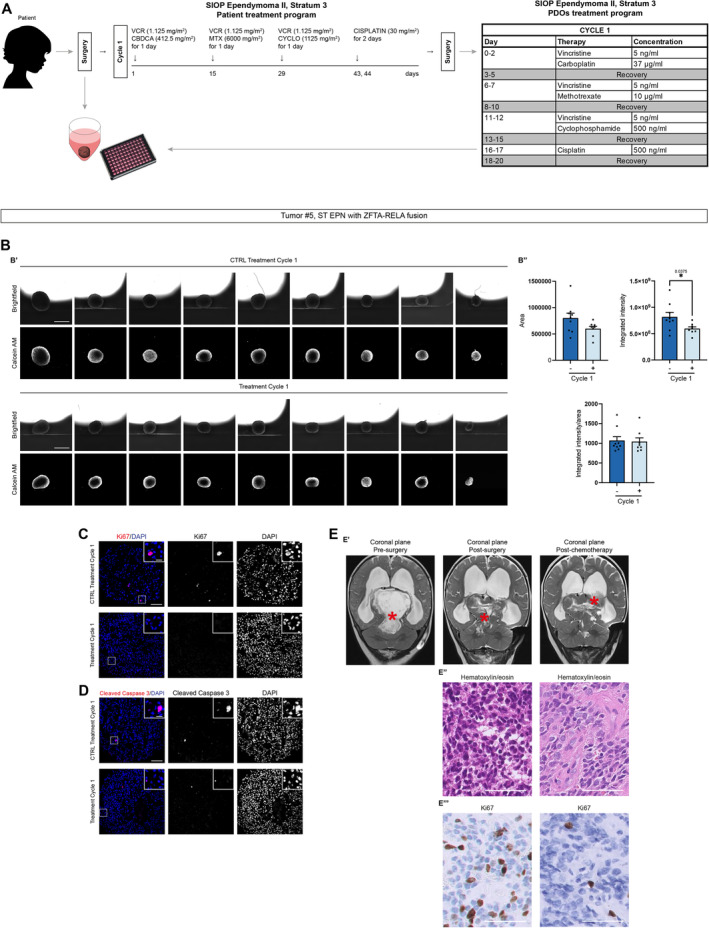
Summary of PDOs generation and treatment according to SIOP Ependymoma II, Stratum 3 protocol (Massimino et al, ; Leblond et al, 2022) for both patient and in vitro adaptation.
PDOs live cells analysis with brightfield and fluorescence images (B′) and quantification of area, integrated intensity, and integrated intensity/area after the treatment (B″).
Confocal images of immunofluorescence of Ki67 of treated ST EPN‐PDOs.
Confocal images of immunofluorescence of cleaved caspase‐3 of treated ST EPN‐PDOs.
T2‐weighted MRI coronal images of the patient pre‐surgery, post‐surgery and post‐chemotherapy. Morphological features (E′, E″) and immunohistochemical expression of Ki67 (E″′) of post‐initial surgery and post‐chemotherapy residual tumor. The red asterisk marks the tumor mass.
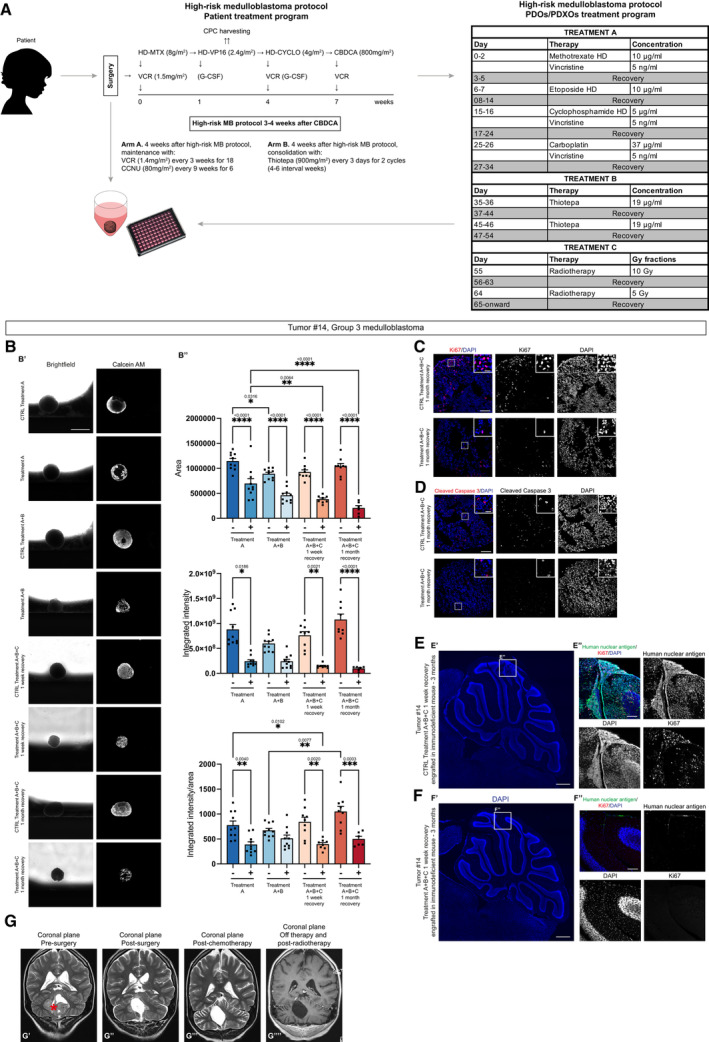
- A
Summary of PDOs generation and treatment according to high‐risk medulloblastoma protocol (Gandola et al, ; Massimino et al, 2013) for both patient and in vitro adaptation.
- B
PDOs live cells analysis with brightfield and fluorescence images (B′) and quantification of area, integrated intensity, and integrated intensity/area after the treatment (B″).
- C
Confocal images of immunofluorescence of Ki67 of treated G3 MB‐PDOs.
- D
Confocal images of immunofluorescence of cleaved caspase‐3 of treated G3 MB‐PDOs.
- E, F
Confocal images of DAPI staining and immunofluorescence of human nuclear antigen and Ki67 of sagittal brain sections of immunodeficient mice engrafted with treatment control G3 MB‐PDOs (E) and treated G3 MB‐PDOs (F). The white square marks the region shown at higher magnification in (E″, F″).
- G
T2‐weighted MRI coronal images of the patient pre‐surgery (G′), post‐surgery (G″), post‐chemotherapy (G″′) and post‐radiotherapy (G″″). The red asterisk marks the tumor mass.
References
-
- 10X Genomics.com (2021) Fresh frozen human‐mouse cell line mixtures for single cell RNA sequencing overview. [PREPRINT]
-
- Ackland SP, Choi KE, Ratain MJ, Egorin MJ, Williams SF, Sinkule JA, Bitran JD (2016) Human plasma pharmacokinetics of thiotepa following administration of high‐dose thiotepa and cyclophosphamide. J Clin Oncol 6: 1192–1196 - PubMed
-
- Adolph JE, Fleischhack G, Mikasch R, Zeller J, Warmuth‐Metz M, Bison B, Mynarek M, Rutkowski S, Schüller U, von Hoff K et al (2021) Local and systemic therapy of recurrent ependymoma in children and adolescents: short‐ and long‐term results of the E‐HIT‐REZ 2005 study. Neuro Oncol 23: 1012–1023 - PMC - PubMed
Publication types
MeSH terms
Associated data
- Actions
- Actions
- Actions
Grants and funding
- Accelerator Award - Cancer Research UK/AIRC - INCAR project
- 9962/AIRC-Special Project 5×1000
- 2018/Fondazione Cassa Di Risparmio Di Trento E Rovereto
- YIP2021/European Molecular Biology Organization (EMBO)
- 27034/Fondazione AIRC per la ricerca sul cancro ETS (AIRC)
- 28277/Fondazione AIRC per la ricerca sul cancro ETS (AIRC)
- 21724/Fondazione AIRC per la ricerca sul cancro ETS (AIRC)
- Fondazione Heal
- Fondazione Pezcoller
- 2016/Giovanni Armenise-Harvard Foundation (GAHF)
- GR-2018-12367328/Ministero della Salute, Italy, Ricerca Finalizzata
- 202205_ONCO_MIELE/Ministero della Salute, Italy, 5 x 1000
- 19921/My First AIRC
- Fondazione Umberto Veronesi
LinkOut - more resources
Full Text Sources
Medical
Molecular Biology Databases
