. 2023 Nov 8;6(22):11560-11572.
doi: 10.1021/acsaem.3c01966. eCollection 2023 Nov 27.

Toward Sustainable Li-S Battery Using Scalable Cathode and Safe Glyme-Based Electrolyte

Affiliations

Toward Sustainable Li-S Battery Using Scalable Cathode and Safe Glyme-Based Electrolyte

Vittorio Marangon et al. ACS Appl Energy Mater. .

Abstract

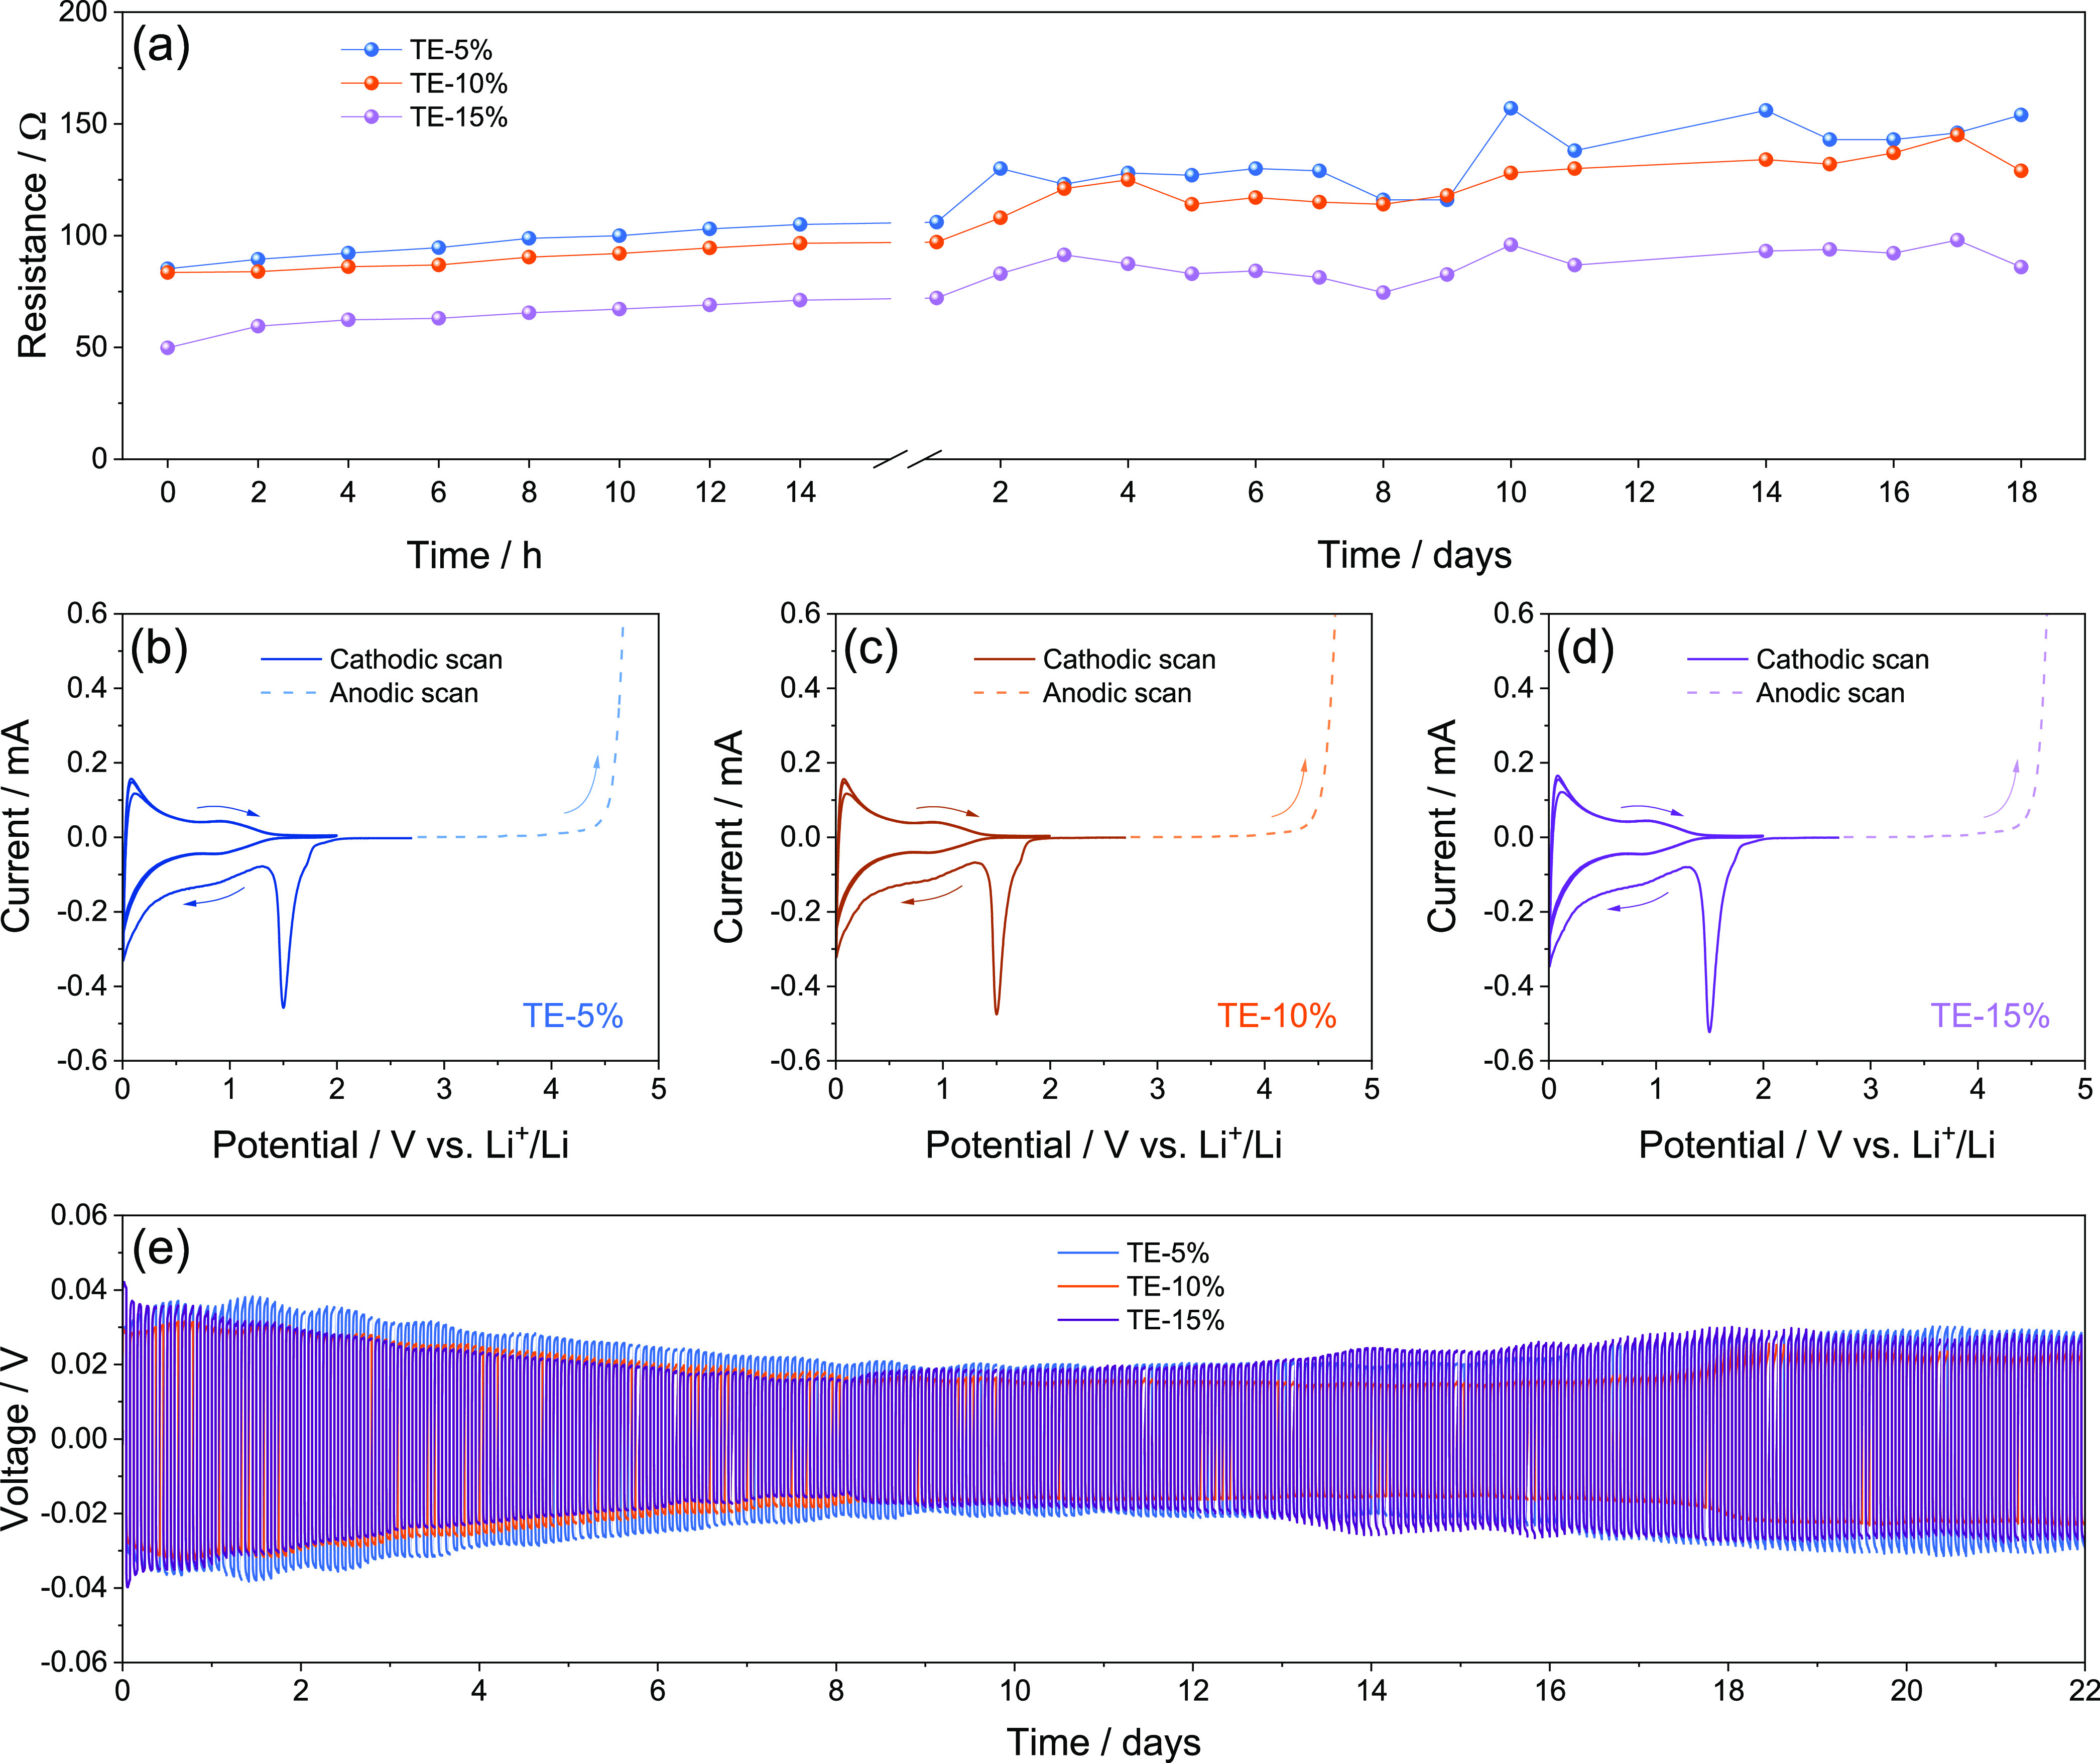
The search for safe electrolytes to promote the application of lithium-sulfur (Li-S) batteries may be supported by the investigation of viscous glyme solvents. Hence, electrolytes using nonflammable tetraethylene glycol dimethyl ether added by lowly viscous 1,3-dioxolane (DOL) are herein thoroughly investigated for sustainable Li-S cells. The electrolytes are characterized by low flammability, a thermal stability of ∼200 °C, ionic conductivity exceeding 10-3 S cm-1 at 25 °C, a Li+ transference number of ∼0.5, electrochemical stability window from 0 to ∼4.4 V vs Li+/Li, and a Li stripping-deposition overpotential of ∼0.02 V. The progressive increase of the DOL content from 5 to 15 wt % raises the activation energy for Li+ motion, lowers the transference number, slightly limits the anodic stability, and decreases the Li/electrolyte resistance. The electrolytes are used in Li-S cells with a composite consisting of sulfur and multiwalled carbon nanotubes mixed in the 90:10 weight ratio, exploiting an optimized current collector. The cathode is preliminarily studied in terms of structure, thermal behavior, and morphology and exploited in a cell using standard electrolyte. This cell performs over 200 cycles, with sulfur loading increased to 5.2 mg cm-2 and the electrolyte/sulfur (E/S) ratio decreased to 6 μL mg-1. The above sulfur cathode and the glyme-based electrolytes are subsequently combined in safe Li-S batteries, which exhibit cycle life and delivered capacity relevantly influenced by the DOL content within the studied concentration range.


Conflict of interest statement

The authors declare no competing financial interest.

Figures

Figure 1
Figure 1
(a) TGA and (b) the corresponding DTG curves of the electrolytes acquired under N2 flow between 25 and 800 °C at the 5 °C min–1 rate; (c) ionic conductivity trends of the electrolytes reporting, in addition, the linear fit for each electrolyte; see Nyquist plots in Figure S1a–c in the Supporting Information; (d) histogram representation of the activation energy values calculated using the Arrhenius equation (eq 1) on the ionic conductivity trends in (c); (e) histogram representation of the weighted average dielectric constants (εw) calculated considering the electrolyte solvents ratio and the ε values of pure DOL (7.1) and TEGDME (7.8); (f) histogram representation of the Li+ transference number (t+) of the electrolytes determined through the Bruce–Vincent–Evans method (eq 2); see chronoamperometric curves and related Nyquist plots in Figure S1d–f in the Supporting Information; (g) FT-IR spectra of the TE-5%, TE-10%, and TE-15% solutions. See Table 1 for electrolyte acronyms.
Figure 2
Figure 2
(a) Interphase resistance trends related to Li|Li cells using either TE-5%, TE-10%, or TE-15% aged for 18 days; see the corresponding Nyquist plots in Figure S2 and NLLS analyses in Tables S1–S3 in the Supporting Information; (b–d) ESW evaluation of the (b) TE-5%, (c) TE-10%, and (d) TE-15% electrolytes performed via CV in the cathodic region (0.01–2.0 V vs Li+/Li) and LSV in the anodic one (from OCV to 5.0 V vs Li+/Li) at a scan rate of 0.1 mV s–1; (e) lithium stripping-deposition tests performed on Li|Li cells using either TE-5%, TE-10%, or TE-15%. Figure S3 in the Supporting Information reports magnifications of the anodic stability curves and lithium stripping-deposition tests. See Table 1 for electrolyte acronyms.
Figure 3
Figure 3
Physical–chemical characterization of the S:MWCNTs 90:10 w/w composite. In detail: (a) XRD of the composite and bare MWCNTs; reference data for sulfur (ICSD #27840) and graphite (ICSD #76767) are reported for comparison; (b) TGA and the corresponding DTG (right y-axis) performed under N2 flow between 25 and 1000 °C at the 5 °C min–1 rate; (c,d) SEM images at various magnification recorded in secondary electron mode; (e) SEM picture acquired in backscattered electrons mode and (f,g) corresponding elemental maps of (f) sulfur and (g) carbon; (h,i) TEM images at various magnifications.
Figure 4
Figure 4
Galvanostatic cycling of Li cells using the S:MWCNTs 90:10 w/w electrode and the DOL:DME-control electrolyte with sulfur loading of 2.2–2.3 mg cm–2 and E/S ratio of 10 μL mg–1. In particular: (a) voltage profiles and the (b) corresponding capacity trend related to the rate capability test carried out at increasing scan rates from C/10 to C/2 between 1.8 and 2.8 V from C/10 to C/3 and in the 1.7–2.8 V voltage range for C/2; current rate was lowered back to C/10 after 25 cycles; (c,d) capacity trends (right y-axis reports Coulombic efficiency) recorded at constant current rates of either (c) C/5 or (d) C/3 between 1.7 and 2.8 V (see voltage profiles in Figure S4 of the Supporting Information); (e) voltage profiles and the (f) corresponding capacity trends (right y-axis reports Coulombic efficiency) acquired at C/10 between 1.7 and 2.8 V using sulfur loading increased to 5.2 mg cm–2 and E/S ratio limited to 6 μL mg–1.
Figure 5
Figure 5
(a–c) Voltage profiles and (d) cycling trends (right y-axis shows Coulombic efficiency) of Li–S cells galvanostatically cycled at C/5 constant rate using either the (a) TE-5%, (b) TE-10%, or (c) TE-15% electrolyte and the S:MWCNTs 90:10 w/w electrode. Sulfur loading: 1.7–2.1 mg cm–2; E/S ratio: 15 μL mg–1; voltage range: 1.7–2.8 V.

References

    1. Schipper F.; Erickson E. M.; Erk C.; Shin J.-Y.; Chesneau F. F.; Aurbach D. Review—Recent Advances and Remaining Challenges for Lithium Ion Battery Cathodes. J. Electrochem. Soc. 2017, 164 (1), A6220–A6228. 10.1149/2.0351701jes. - DOI
    1. Choi J. W.; Aurbach D. Promise and Reality of Post-Lithium-Ion Batteries with High Energy Densities. Nat. Rev. Mater. 2016, 1, 16013.10.1038/natrevmats.2016.13. - DOI
    1. Fotouhi A.; Auger D. J.; Propp K.; Longo S.; Wild M. A Review on Electric Vehicle Battery Modelling: From Lithium-Ion toward Lithium-Sulphur. Renewable Sustainable Energy Rev. 2016, 56, 1008–1021. 10.1016/j.rser.2015.12.009. - DOI
    1. Scrosati B.; Hassoun J.; Sun Y.-K. Lithium-Ion Batteries. A Look into the Future. Energy Environ. Sci. 2011, 4 (9), 3287–3295. 10.1039/c1ee01388b. - DOI
    1. Wang W.; Wang Y.; Huang Y.; Huang C.; Yu Z.; Zhang H.; Wang A.; Yuan K. The Electrochemical Performance of Lithium-Sulfur Batteries with LiClO4 DOL/DME Electrolyte. J. Appl. Electrochem. 2010, 40 (2), 321–325. 10.1007/s10800-009-9978-z. - DOI

LinkOut - more resources