. 2024 Feb 9;52(3):1136-1155.
doi: 10.1093/nar/gkad1141.

DAXX promotes centromeric stability independently of ATRX by preventing the accumulation of R-loop-induced DNA double-stranded breaks

Affiliations

DAXX promotes centromeric stability independently of ATRX by preventing the accumulation of R-loop-induced DNA double-stranded breaks

Lia M Pinto et al. Nucleic Acids Res. .

Abstract

Maintaining chromatin integrity at the repetitive non-coding DNA sequences underlying centromeres is crucial to prevent replicative stress, DNA breaks and genomic instability. The concerted action of transcriptional repressors, chromatin remodelling complexes and epigenetic factors controls transcription and chromatin structure in these regions. The histone chaperone complex ATRX/DAXX is involved in the establishment and maintenance of centromeric chromatin through the deposition of the histone variant H3.3. ATRX and DAXX have also evolved mutually-independent functions in transcription and chromatin dynamics. Here, using paediatric glioma and pancreatic neuroendocrine tumor cell lines, we identify a novel ATRX-independent function for DAXX in promoting genome stability by preventing transcription-associated R-loop accumulation and DNA double-strand break formation at centromeres. This function of DAXX required its interaction with histone H3.3 but was independent of H3.3 deposition and did not reflect a role in the repression of centromeric transcription. DAXX depletion mobilized BRCA1 at centromeres, in line with BRCA1 role in counteracting centromeric R-loop accumulation. Our results provide novel insights into the mechanisms protecting the human genome from chromosomal instability, as well as potential perspectives in the treatment of cancers with DAXX alterations.


Figures

Graphical Abstract
Graphical Abstract
Figure 1.
Figure 1.
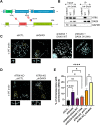
An ATRX-independent function for DAXX in maintaining centromeric stability. (A) Scheme representing the important functional domains of the DAXX and ATRX proteins (after references (33,37,38)), as well as the position of the Y124A mutation within the DAXX helical bundle (DHB), which disrupts DAXX-ATRX interaction (33). Also shown is the position of the R371W mutation within the histone binding domain of DAXX, also characterized in this study. (B) The DAXX (Y124A) mutation disrupts the interaction with ATRX. Representative western blot analysis of DAXX and ATRX in immunoprecipitates obtained from SF188 cells expressing an empty vector (control) or the indicated HA-tagged DAXX constructs, using an anti-HA antibody. See Supplementary Figure S1C for quantification. (C, D) FISH on metaphase spread of the indicated SF188 cell lines with Cy5-CEN (α-SAT) PNA probe (cyan). (E) Quantification of centromere defects per metaphase spread in the indicated cell lines. All experiments account for three biological replicates. At least 15 spreads (per biological replicate) for each sample and condition were used for the quantification. Statistical significance is reported as: P-value < 0.05 *, P-value < 0.0001 ****, P-value > 0.05 ns. The error bars represent the standard error of mean (s.e.m.).
Figure 2.
Figure 2.
DAXX depletion increases spontaneous DNA damage at centromeres. (A) Representative IF images of CREST foci (centromeres, magenta), γH2AX foci (green) and 53BP1 (red) in the indicated SF188 cell derivatives. White arrows in the rightmost panels point to representative CREST-γH2AX and CREST-53BP1 colocalized foci. (B–E) Related quantification of the centromeric 53BP1 foci (B and D) or centromeric γH2AX (C and E), reported as fraction of total CREST foci. The experiments account for five biological replicates. At least 80 nuclei for each sample and condition were used for every biological replicate for quantification. Scale bar = 5 μm. Statistical significance is reported as: P-value < 0.01 **, P-value < 0.001 ***, P-value < 0.001 **** P-value > 0.05 ns. The error bars represent the s.e.m. (F–G) Representative IF images of CREST foci (magenta) and DAXX foci (green) in WT and ATRX-KO cells (F), and related quantification of centromeric DAXX foci (G). Arrows in (F) point to representative colocalized DAXX-CREST foci. The experiment account for three biological replicates. At least 50 nuclei for each sample and condition were used for every biological replicate for quantification. Scale bar = 5 μm. Statistical significance is reported as: P-value > 0.05 ns.
Figure 3.
Figure 3.
DAXX knockdown elicits centromeric R-loop accumulation. (A) Indirect IF analysis with the R-loop-specific antibody S9.6 (red) in the indicated SF188 cell derivatives treated or not with RNase H. The nuclear contour in the upper left panel shows an example of the area that was used for quantification. (B) Related quantification of S9.6 mean intensity per cell (with or without RNase H). Error bars represent the s.e.m. (C) DRIP-qPCR analysis at α-SAT repeats in DAXX-depleted cells expressing the indicated DAXX constructs. RNase H treatment was performed on half of each sample prior to IP with the S9.6 antibody. Displayed is the mean R-loop enrichment (as percent input) ± s.e.m. The data correspond to five independent experiments. (D–F) Inhibition of transcription by α-amanitin suppresses the accumulation of centromeric R-loops and DSBs elicited by DAXX depletion. (D) DRIP-qPCR analysis at α-SAT repeats in WT and DAXX-depleted cells left untreated or treated with α-amanitin as described in Materials and Methods. The data correspond to four independent experiments. (E) Representative IF images of 53BP1 foci (green) and CREST foci (magenta) in the indicated ATRX-WT derivative cell lines left untreated or treated with α-amanitin. White arrows point to representative co-localizing 53BP1 and CREST foci. Scale bar: 5 μm. See Supplementary Figure S3B for images of ATRX-KO derivative cell lines. (F) Related quantification of centromeric 53BP1 foci in the indicated cell lines left untreated or treated with α-amanitin. Also see Supplementary Figure S3B for representative IF images of ATRX-KO cell derivatives. All IF experiments account for three biological replicates. At least 50 nuclei for each sample and condition were used for every biological replicate for quantification. Scale bar = 5 μm. Statistical significance is reported as: P-value < 0.05 *, P-value < 0.01 **, P-value < 0.0001 ****. The error bars represent the s.e.m.
Figure 4.
Figure 4.
Overexpression of hRNaseH1 suppresses R-loop formation and DSB accumulation at the centromeres of DAXX-depleted cells. (A). Immunoblot analysis of GFP-hRNH1 and GFP-nuc expression in whole cell extracts of shCTL and shDAXX SF188 cells. (B). DRIP-qPCR analysis at α-SAT repeats in control and DAXX-depleted cells expressing either GFP-hRNH1 or GFP-nuc. RNase H treatment was performed on half of each sample prior to IP with the S9.6 antibody. The graph shows the mean R-loop enrichment (as percent of input) +/- s.e.m., n ≥ 3 independent experiments. (C). Immunoblot analysis of hRNAseH1 in whole cell extracts of the indicated cell lines stably transduced with an empty lentiviral vector or a vector expressing hRNAseH1. (D-E). Quantification of centromeric 53BP1 foci (D) and centromeric γH2AX foci (E) in the indicated cell lines expressing or not hRNAseH1. See Supplementary Figure S4A for representative IF images. (F, G). Representative IF images of mitotic defects scored in control and DAXX-depleted cells stably expressing or not hRNAseH1 (F). Mitotically arrested cells were stained with DAPI, CREST (magenta) and a-tubulin (green). Shown from upper to lower panel are examples of anaphase bridges, misaligned chromosomes, centromeres not associated with chromatin and lagging chromosomes. (G) Related quantification showing the mean percentage of cells with mitotic defects from n ≥ 60 anaphase/telophase cells analysed for each condition in two biological replicates. The experiments in (D-E) account for three biological replicates. At least 50 nuclei for each sample and condition were used for every biological replicate for quantification. Scale bar = 5 μm. Statistical significance is reported as: P-value < 0.01 **, P-value < 0.001 ***, P-value < 0.0001 ****, P-value > 0.05 ns. The error bars represent the s.e.m.
Figure 5.
Figure 5.
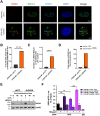
BRCA1 accumulates at centromeres in the absence of DAXX. (A–D) IF images of γH2AX foci (red), BRCA1 foci (green) and CREST foci (cyan) in control and DAXX-depleted SF188 cells. Green circles indicate representative examples of CREST-BRCA1 colocalized foci while yellow circles indicate foci where all 3 markers colocalize or are in close juxtaposition (A). (B–D) Related quantification of the number of cells displaying BRCA1 association with undamaged centromeres (B), as well as the number of colocalized CREST-BRCA1 foci per nucleus in these cells (C). (D) Graph showing the number of CREST-γH2AX and CREST-γH2AX-BRCA1 colocalized foci in control and DAXX-depleted cells. At least 50 nuclei for each sample and condition were used for every biological replicate for quantification. Scale bar = 5 μm. Statistical significance is reported as: P-value < 0.05 *, P-value < 0.01 **, P-value < 0.0001 ****. (E) Immunoblot of whole-cell lysates showing the efficiency of the siRNA-mediated depletion of BRCA1 in SF188 shCTL and shDAXX cells. HSP60 was used as a loading control. (F) DRIP-qPCR analysis at α-SAT repeats in control and DAXX-depleted cells following RNAi against BRCA1. RNase H treatment was performed on half of each sample prior to IP with the S9.6 antibody. The graph shows the mean R-loop enrichment (as percent of input) ± s.e.m., n = 4 independent experiments.
Figure 6.
Figure 6.
Interplay between DAXX and H3.3 in centromere protection. (A). Representative western blot analysis of DAXX, H3.3 and H4 in anti-HA immunoprecipitates from SF188 cells expressing an empty vector (EV) or the indicated HA-tagged DAXX constructs, using an anti-HA antibody. (B) Quantification of the CREST foci co-localising with 53BP1 foci in DAXX-depleted cells expressing the indicated DAXX constructs (see Supplementary Figure S6C and Figure 2A for representative IF images). (C) Immunoblot analysis verifying the loss of DAXX and ATRX proteins in the BON-1 DAXX-KO and ATRX-KO derivatives, respectively, generated by CRISPR-cas9, as well as the expression of the indicated DAXX constructs. (D) Quantification of the CREST foci co-localising with 53BP1 foci in the indicated BON-1 cell derivatives. See Supplementary Figure S6E for representative IF images. N = 3. At least 50 nuclei for each sample and condition were used for every biological replicate for quantification. (E) ChIP-qPCR analyses showing the relative levels of H3.3 at centromeres (cen1-like primers) in the indicated cell lines, as percent of input. n ≥ 3 independent experiments. Scale bar = 5 μm. Statistical significance is reported as: P-value < 0.01 **, P-value < 0.001 ***, P-value < 0,0001 ****, P-value > 0.05 ns. The error bars represent the s.e.m.
Figure 7.
Figure 7.
DAXX exerts an ATRX-independent function in the prevention of R-loop-associated centromeric instability - model integrating the present findings. Upper panel: Depicted are pericentromeric regions surrounding a centromeric region characterized by CENP-A containing nucleosomes (orange). In addition to promoting H3.3 deposition at centromeres as part of the ATRX-DAXX complex, DAXX also prevents unscheduled R-loop accumulation. This activity is independent of ATRX, stabilized by DAXX interaction with H3.3-H4 and involves SETDB1 and possibly other chromatin modifiers. Loss of DAXX results in the uncontrolled accumulation of transcription-associated R-loops at centromeres. Although such R-loops favor the recruitment of BRCA1, shown to counteract R-loop accumulation at centromeres (10), our data indicate that the action of BRCA1 is not sufficient in the absence of DAXX, resulting in DSB accumulation and centromeric instability. DSBs associated with unscheduled R-loops occurring at repetitive centromeric DNA sequences could result from transcription-replication conflicts and/or the action of nucleases on the displaced ssDNA, including at harmful structures such as hairpins. We propose that, upon loss of DAXX, the centromeric R-loops produced during transcription inhibit subsequent rounds of transcription (represented by the inhibitory feedback arrow), leading to the observed decrease in centromeric transcripts levels in DAXX-depleted cells.

References

    1. Sansregret L., Vanhaesebroeck B., Swanton C.. Determinants and clinical implications of chromosomal instability in cancer. Nat. Rev. Clin. Oncol. 2018; 15:139–150. - PubMed
    1. Sharma A.B., Dimitrov S., Hamiche A., Van Dyck E.. Centromeric and ectopic assembly of CENP-A chromatin in health and cancer: old marks and new tracks. Nucleic Acids Res. 2019; 47:1051–1069. - PMC - PubMed
    1. Aldrup-Macdonald M.E., Sullivan B.A.. The past, present, and future of human centromere genomics. Genes (Basel). 2014; 5:33–50. - PMC - PubMed
    1. Thakur J., Packiaraj J., Henikoff S.. Sequence, chromatin and evolution of satellite DNA. Int. J. Mol. Sci. 2021; 22:4309. - PMC - PubMed
    1. Barra V., Fachinetti D. The dark side of centromeres: types, causes and consequences of structural abnormalities implicating centromeric DNA. Nat. Commun. 2018; 9:4340. - PMC - PubMed