. 2023 Dec 21;97(12):e0136923.
doi: 10.1128/jvi.01369-23. Epub 2023 Dec 1.

Amino acid substitution L232F in non-structural protein 6 identified as a possible human-adaptive mutation in clade B MERS coronaviruses

Affiliations

Amino acid substitution L232F in non-structural protein 6 identified as a possible human-adaptive mutation in clade B MERS coronaviruses

Ray T Y So et al. J Virol. .

Abstract

Viral host adaptation plays an important role in inter-species transmission of coronaviruses and influenza viruses. Multiple human-adaptive mutations have been identified in influenza viruses but not so far in MERS-CoV that circulates widely in dromedary camels in the Arabian Peninsula leading to zoonotic transmission. Here, we analyzed clade B MERS-CoV sequences and identified an amino acid substitution L232F in nsp6 that repeatedly occurs in human MERS-CoV. Using a loss-of-function reverse genetics approach, we found the nsp6 L232F conferred increased viral replication competence in vitro, in cultures of the upper human respiratory tract ex vivo, and in lungs of mice infected in vivo. Our results showed that nsp6 L232F may be an adaptive mutation associated with zoonotic transmission of MERS-CoV. This study highlighted the capacity of MERS-CoV to adapt to transmission to humans and also the need for continued surveillance of MERS-CoV in camels.

Keywords: MERS-CoV; coronavirus; nsp6; virus evolution.


Conflict of interest statement

The authors declare no conflict of interest.

Figures

Fig 1
Fig 1
Data set preparation for identification of human-adaptive mutations in MERS-CoV. (A) Scheme of data set adjustment for sequence analysis to avoid bias in the sequence sources. A total of 738 MERS-CoV complete and partial (>10 kb) genomes from camel and human were downloaded from GenBank. To avoid bias or oversampling of case clusters, sequences derived from cell culture and multiple sequences from the same individual were removed. Clade A (no camel sequences) and C (no human sequences) virus sequences were also removed. Finally, a threshold was applied to exclude highly similar sequences that potentially may arise from a single zoonotic event. Thus, 121 human and 160 camel MERS-CoV were included for mutation analysis. (B) Diversity of MERS-CoV genomes in the South Korea outbreak. A violin plot showing the maximum pairwise p-distances for each sequence (refer to Materials and Methods) within the outbreak. p-Distance is calculated using SSE (v1.4). Maximum pairwise p-distance of 0.0003 was used for data set trimming.
Fig 2
Fig 2
The occurrence of MERS-CoV nsp6 L232F in human and dromedary camel clade B MERS-CoV. A maximum likelihood tree of 281 clade B MERS-CoV nucleotide sequences labeled with the host and the presence of the mutation. Insets labeled with only camel or human sequences were shown on the right. The tree was built with IQ-Tree v1.6.12 using GTR + I + R substitution model selected by model testing. Yellow circles represent camel sequences; blue diamonds represent human sequences. A taxon with larger filled color shape indicates the presence of the nsp6 L232F substitution. Three sequences (human nsp6 232 undefined) without the nsp6 codon 232 information are indicated as filled gray diamonds in the taxon. Scale bar, 0.001 nucleotide change per genomic position. Deep internal nodes with bootstraps >80 are indicated.
Fig 3
Fig 3
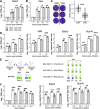
Comparison of virus replication kinetics of rGD01-nsp6-232F and rGD01-nsp6-232L isogenic MERS-CoV. (A) Calu-3 cell cultures and (B) Vero cell cultures were infected at an MOI of 0.01, and virus titers in culture supernatants were determined by TCID50 assay. Assays were performed in three independent experiments with triplicates in each. Dots represent mean  ±  s.d. for each experiment. (C) Relative plaque sizes of rGD01-nsp6-232F and rGD01-nsp6-232L virus were determined in Vero cells. A total of n = 46 plaques were analyzed for each virus. The box plot displays median and interquartile range. Performed in three independent experiments. (D) Early cycles replication kinetics in Vero cells (n = 3) at MOI = 2 measured for live virus production and RNA synthesis. Assays were performed in triplicates. Data are mean  ±  s.d. (E) Schematic setup of virus growth competition assay in Vero cells. Vero cells were infected with different ratios (9:1, 1:1, and 1:9) (n = 1) of rGD01-nsp6-232F and rGD01-nsp6-232L virus and serially passaged three times. Genotype of the nsp6 amino acid 232 position was determined by Sanger sequencing. (F) Viral titers in the lungs of human DPP4-knockin mice infected intranasally with 1 × 10⁴ plaque-forming units of each virus (n = 4 for each group). Lung homogenates (n = 4) were measured for viral titers by TCID50 assay, and total RNA was extracted to measure subgenomic viral RNA templates by RT-qPCR targeting the envelope (subgenomic E) and nucleocapsid (subgenomic N) gene. Statistical tests were done using two-tailed Student’s t test: P ≥ 0.05 (ns); P < 0.05 (*); P < 0.01 (**); P < 0.001 (***).
Fig 4
Fig 4
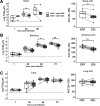
Comparison of virus replication kinetics in ex vivo cultures of nasal, bronchial, and lung tissues. Ex vivo cultures of nasal (A), bronchus (B), and lung (C) tissues were infected with a dose of 106 TCID50 of rGD01-nsp6-232F and rGD01-nsp6-232L viruses. Virus titers in culture supernatants at the indicated timepoints were determined by TCID50 assay. Data were generated from three individual tissue donors for nasal and five donors for bronchus and lung. Data from different timepoints of the same tissue donor were connected with horizontal lines. The horizontal dotted line denotes the limit of detection in the TCID50 assay. Statistical tests were done using paired t test: P < 0.05 (*), P < 0.01(**).
Fig 5
Fig 5
Innate immune gene expression in Calu-3 cells infected with rGD01-nsp6-232F and rGD01-nsp6-232L viruses (MOI = 2). (A) mRNA expression of immune genes (TNF-α, IL6, IP10, IFN-β, RANTES, and ISG15) was determined using qPCR from cells infected with rGD01-nsp6-232F or rGD01-nsp6-232L virus. Mock control was cells mock infected without virus infection. Assays were performed in triplicates. Data are mean  ±  s.d. (B) Quantification of MERS-CoV RNA copies using RT-qPCR targeting the upstream region of E gene (UpE). Assays were performed in biological triplicates. Data are mean  ±  s.d. Statistical tests were done using the Student’s t test: P ≥ 0.05, not significant (ns).
Fig 6
Fig 6
Nsp6 L232F substitution showed minimal modulation in autophagy and ER zippering. (A) Illustration of the topology of MERS-CoV based on a previous study of murine coronavirus nsp6 from Baliji et al. (24) and the topology of nsp6 in multiple coronaviruses from Feng et al. (25). The conserved domain is shaded orange as from the original illustration. The position of the L232F mutation is indicated as the star icon. (B) Vero cells transfected with mCherry- and EGFP-tagged LC3 were infected with each of the recombinant viruses at MOI = 0.01 and processed for immunofluorescence at 24 hpi. Hanks’ balanced salt solution (HBSS) induced cell starvation and was used as a high autophagic flux control. Dulbecco’s modified Eagle medium (DMEM) supplemented with 2% fetal bovine serum (FBS) acts as the basal autophagic flux control. Chloroquine (CQ, 100 mM) inhibits AP fusion with AL as low autophagic flux control. Images are representative of three biological replicates. (B) Summary statistics of the number of AP and AL puncta counted. Number of cells analyzed: HBSS (n = 7); DMEM 2% FBS (n = 11); WT (n = 20); nsp6 232L (n = 14). (C) Analysis of ER-zippering formation in Hela cells expression GFP-nsp6 WT or GFP-nsp6 232L induced by doxycycline. GFP puncta per cell and area of puncta were measured at 1, 3, 6, and 8 hours post induction. Images were analyzed using ImageJ. Each setup was analyzed with a cell number ranged of n = 35–59. Images are representatives of three biological replicates. Statistical tests were done using two-tailed Student’s t test: P ≥ 0.05 (ns); P < 0.05 (*); P < 0.01 (**); P < 0.001 (***).
Fig 7
Fig 7
Nsp6 L232F substitution associated with higher virus egress through vesicles under electron microscopy. Electron microscopy of infected Vero cells at 12 hpi (MOI = 1) and at 24 hpi (MOI = 0.01). Diameters of virus vesicles and virion numbers per vesicle were measured from 24 hpi images using ImageJ. Number of cells analyzed: WT at MOI 0.1 (n = 13), at MOI 0.01 (n = 16); nsp6 232L at MOI 0.1 (n = 8), at MOI 0.01 (n = 8). Statistical tests were done using two-tailed Student’s t test: P < 0.05 (*); P < 0.01 (**); P < 0.001 (***). Scale bars = 500 nm.

Update of

References

    1. Zaki AM, van Boheemen S, Bestebroer TM, Osterhaus A, Fouchier RAM. 2012. Isolation of a novel coronavirus from a man with pneumonia in Saudi Arabia. N Engl J Med 367:1814–1820. doi:10.1056/NEJMoa1211721 - DOI - PubMed
    1. WHO . 2016. Prioritizing diseases for research and development in emergency contexts. Available from: https://www.who.int/activities/prioritizing-diseases-for-research-and-de...
    1. Mehand MS, Al-Shorbaji F, Millett P, Murgue B. 2018. The WHO R&D blueprint: 2018 review of emerging infectious diseases requiring urgent research and development efforts. Antiviral Res 159:63–67. doi:10.1016/j.antiviral.2018.09.009 - DOI - PMC - PubMed
    1. Peiris M, Perlman S. 2022. Unresolved questions in the zoonotic transmission of MERS. Curr Opin Virol 52:258–264. doi:10.1016/j.coviro.2021.12.013 - DOI - PMC - PubMed
    1. WHO . 2022. MERS situation update. Available from: https://www.emro.who.int/health-topics/mers-cov/mers-outbreaks.html

Publication types

Substances

LinkOut - more resources