. 2024 Mar 4;84(5):703-724.
doi: 10.1158/0008-5472.CAN-23-0555.

Adipose Triglyceride Lipase Is a Therapeutic Target in Advanced Prostate Cancer That Promotes Metabolic Plasticity

Affiliations

Adipose Triglyceride Lipase Is a Therapeutic Target in Advanced Prostate Cancer That Promotes Metabolic Plasticity

Dominik Awad et al. Cancer Res. .

Abstract

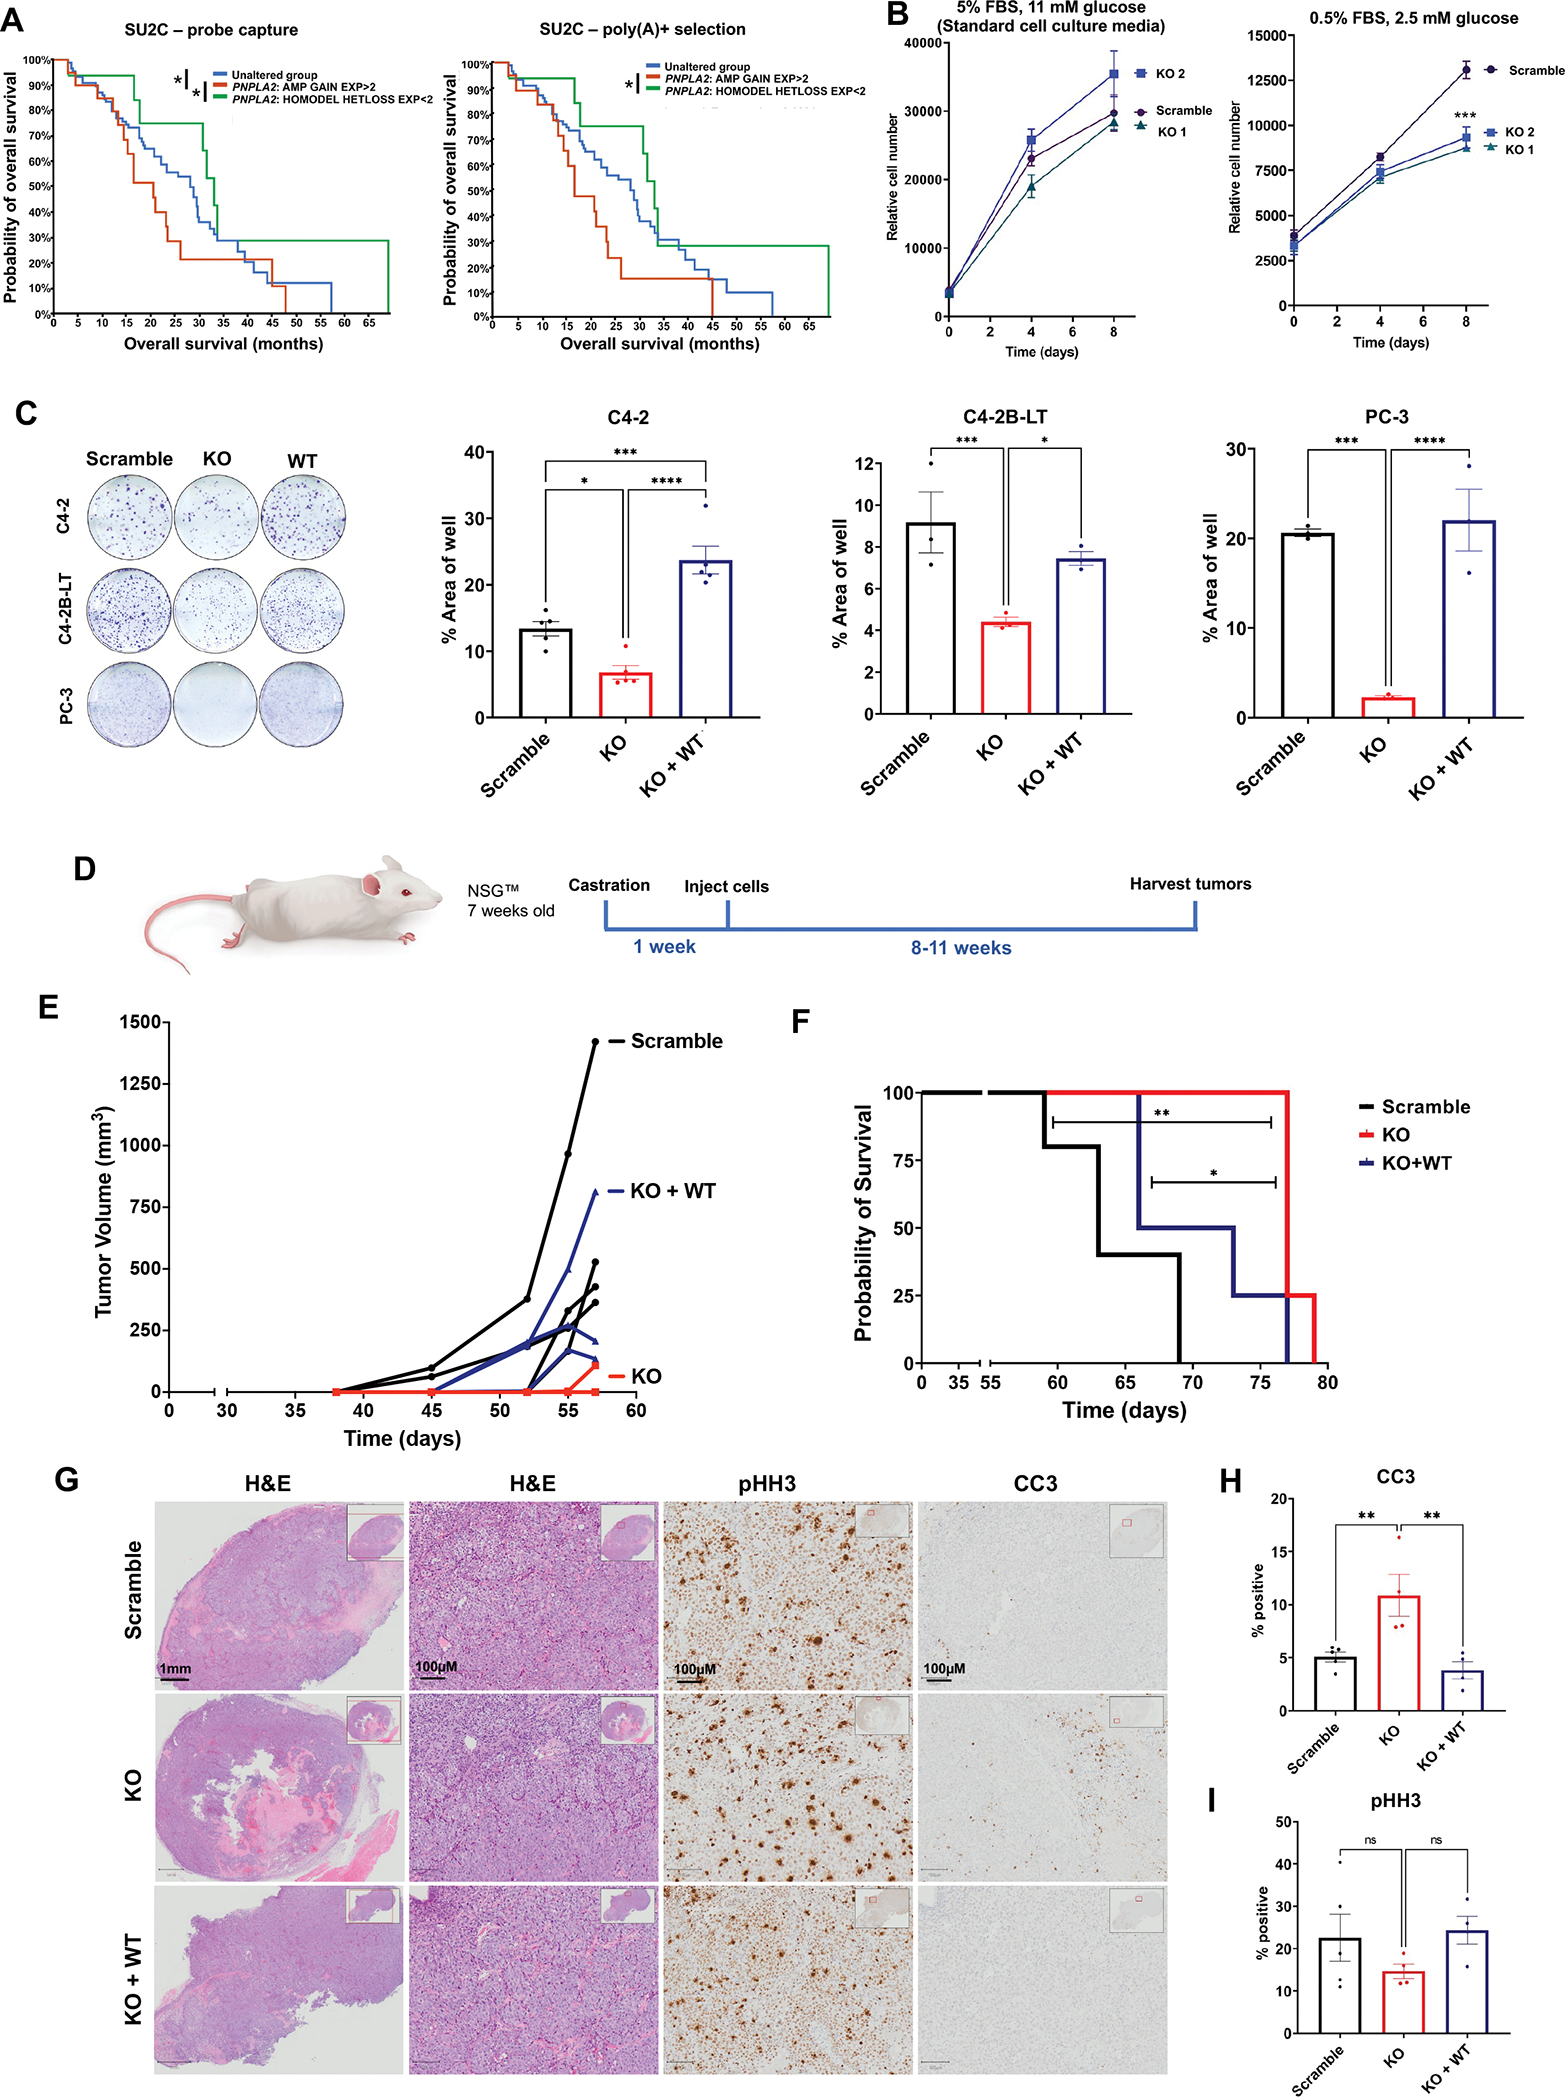
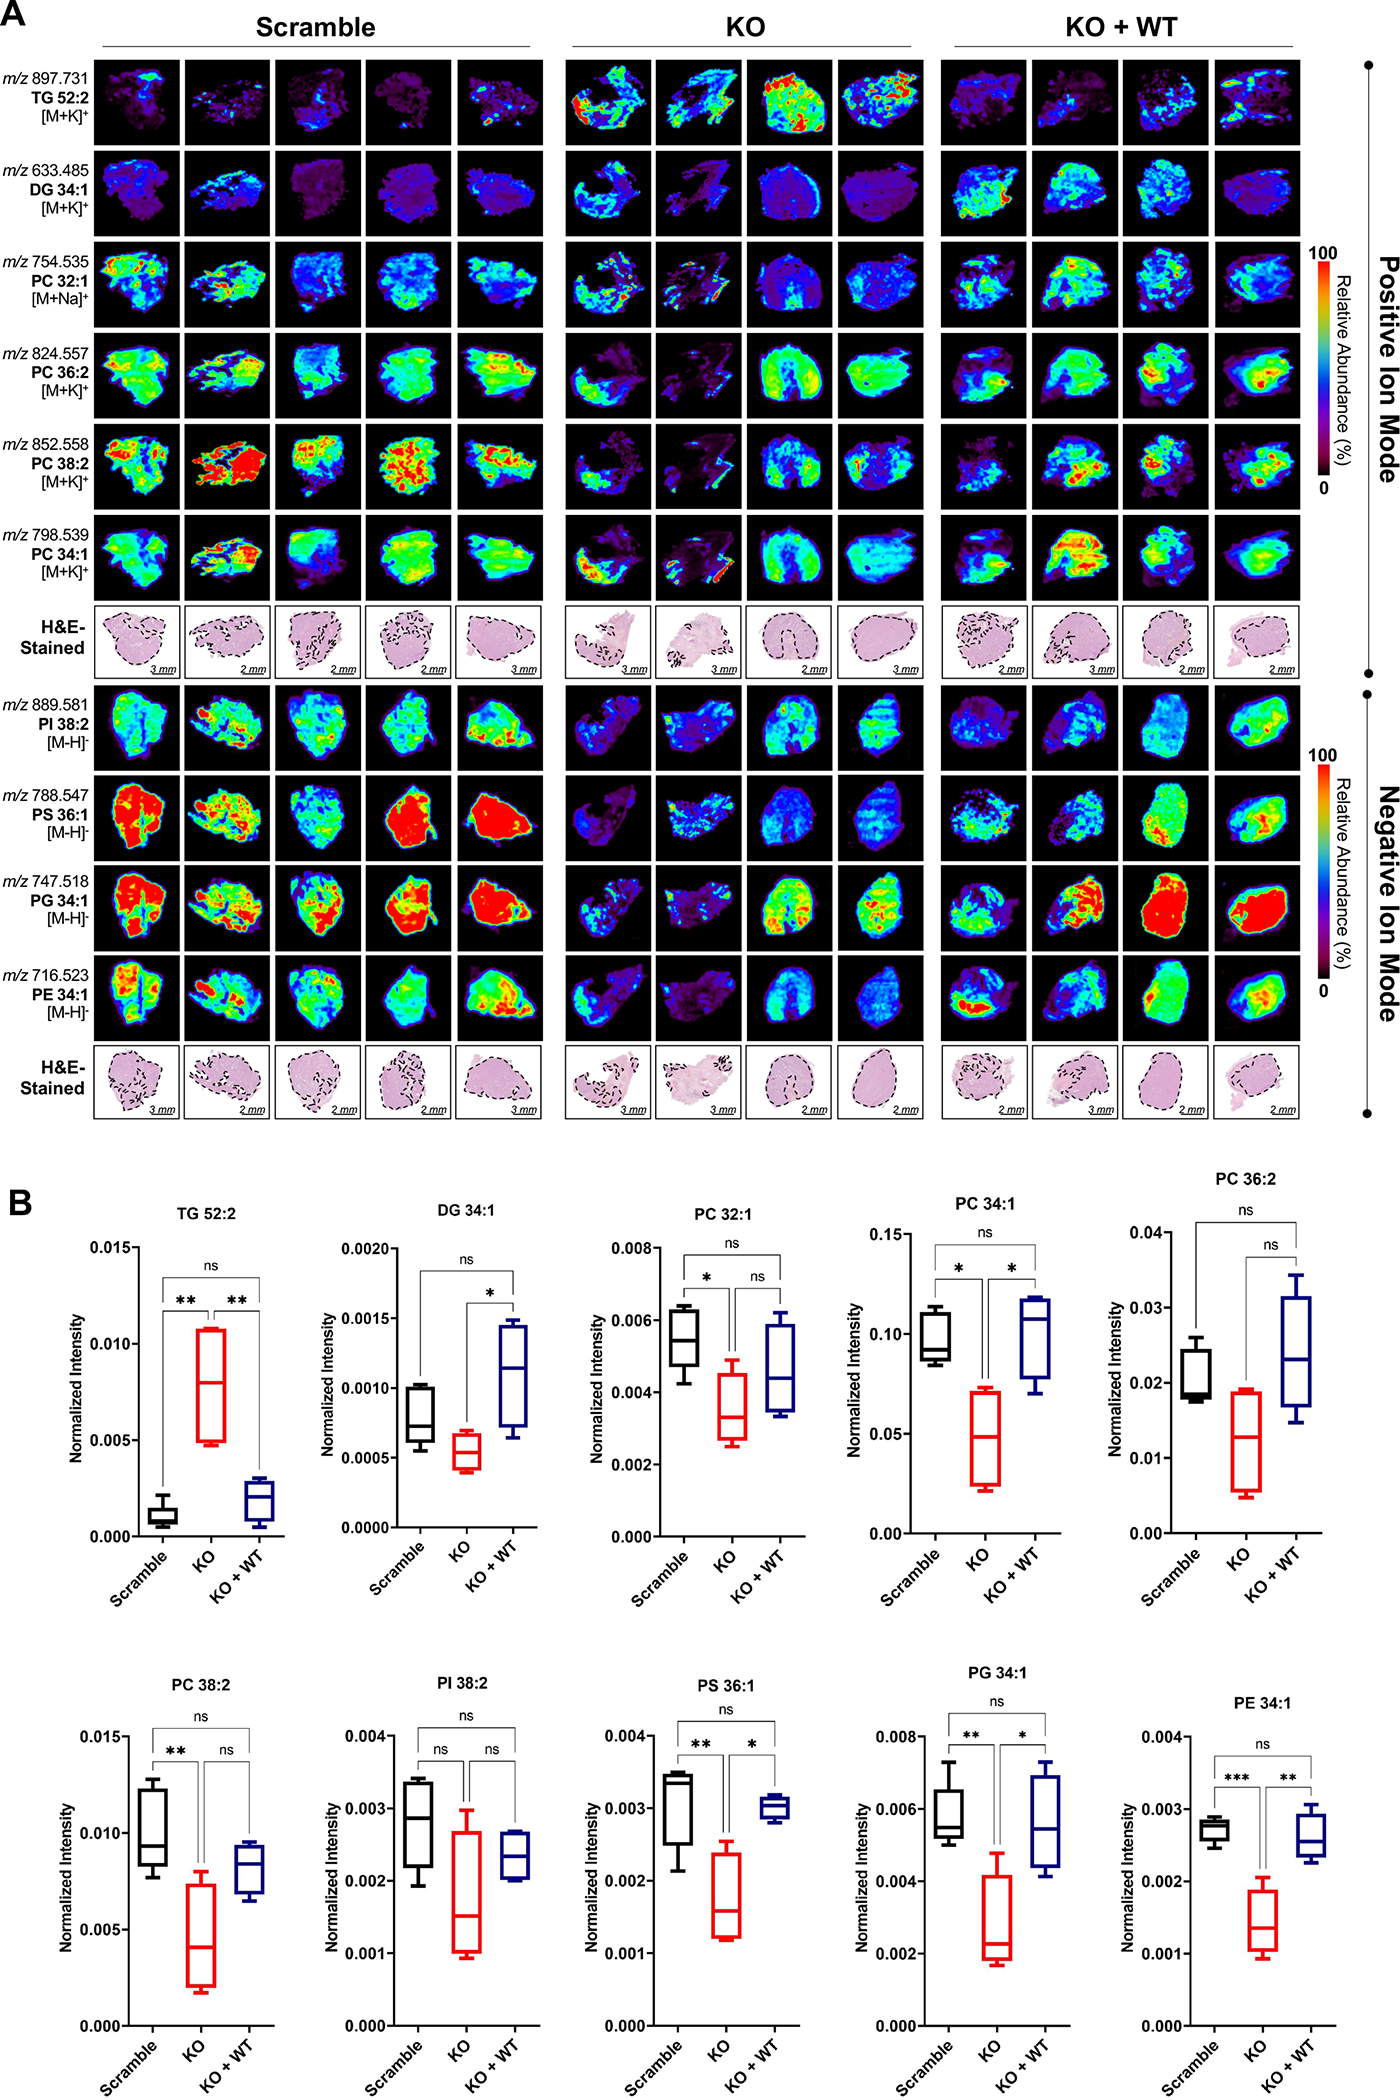
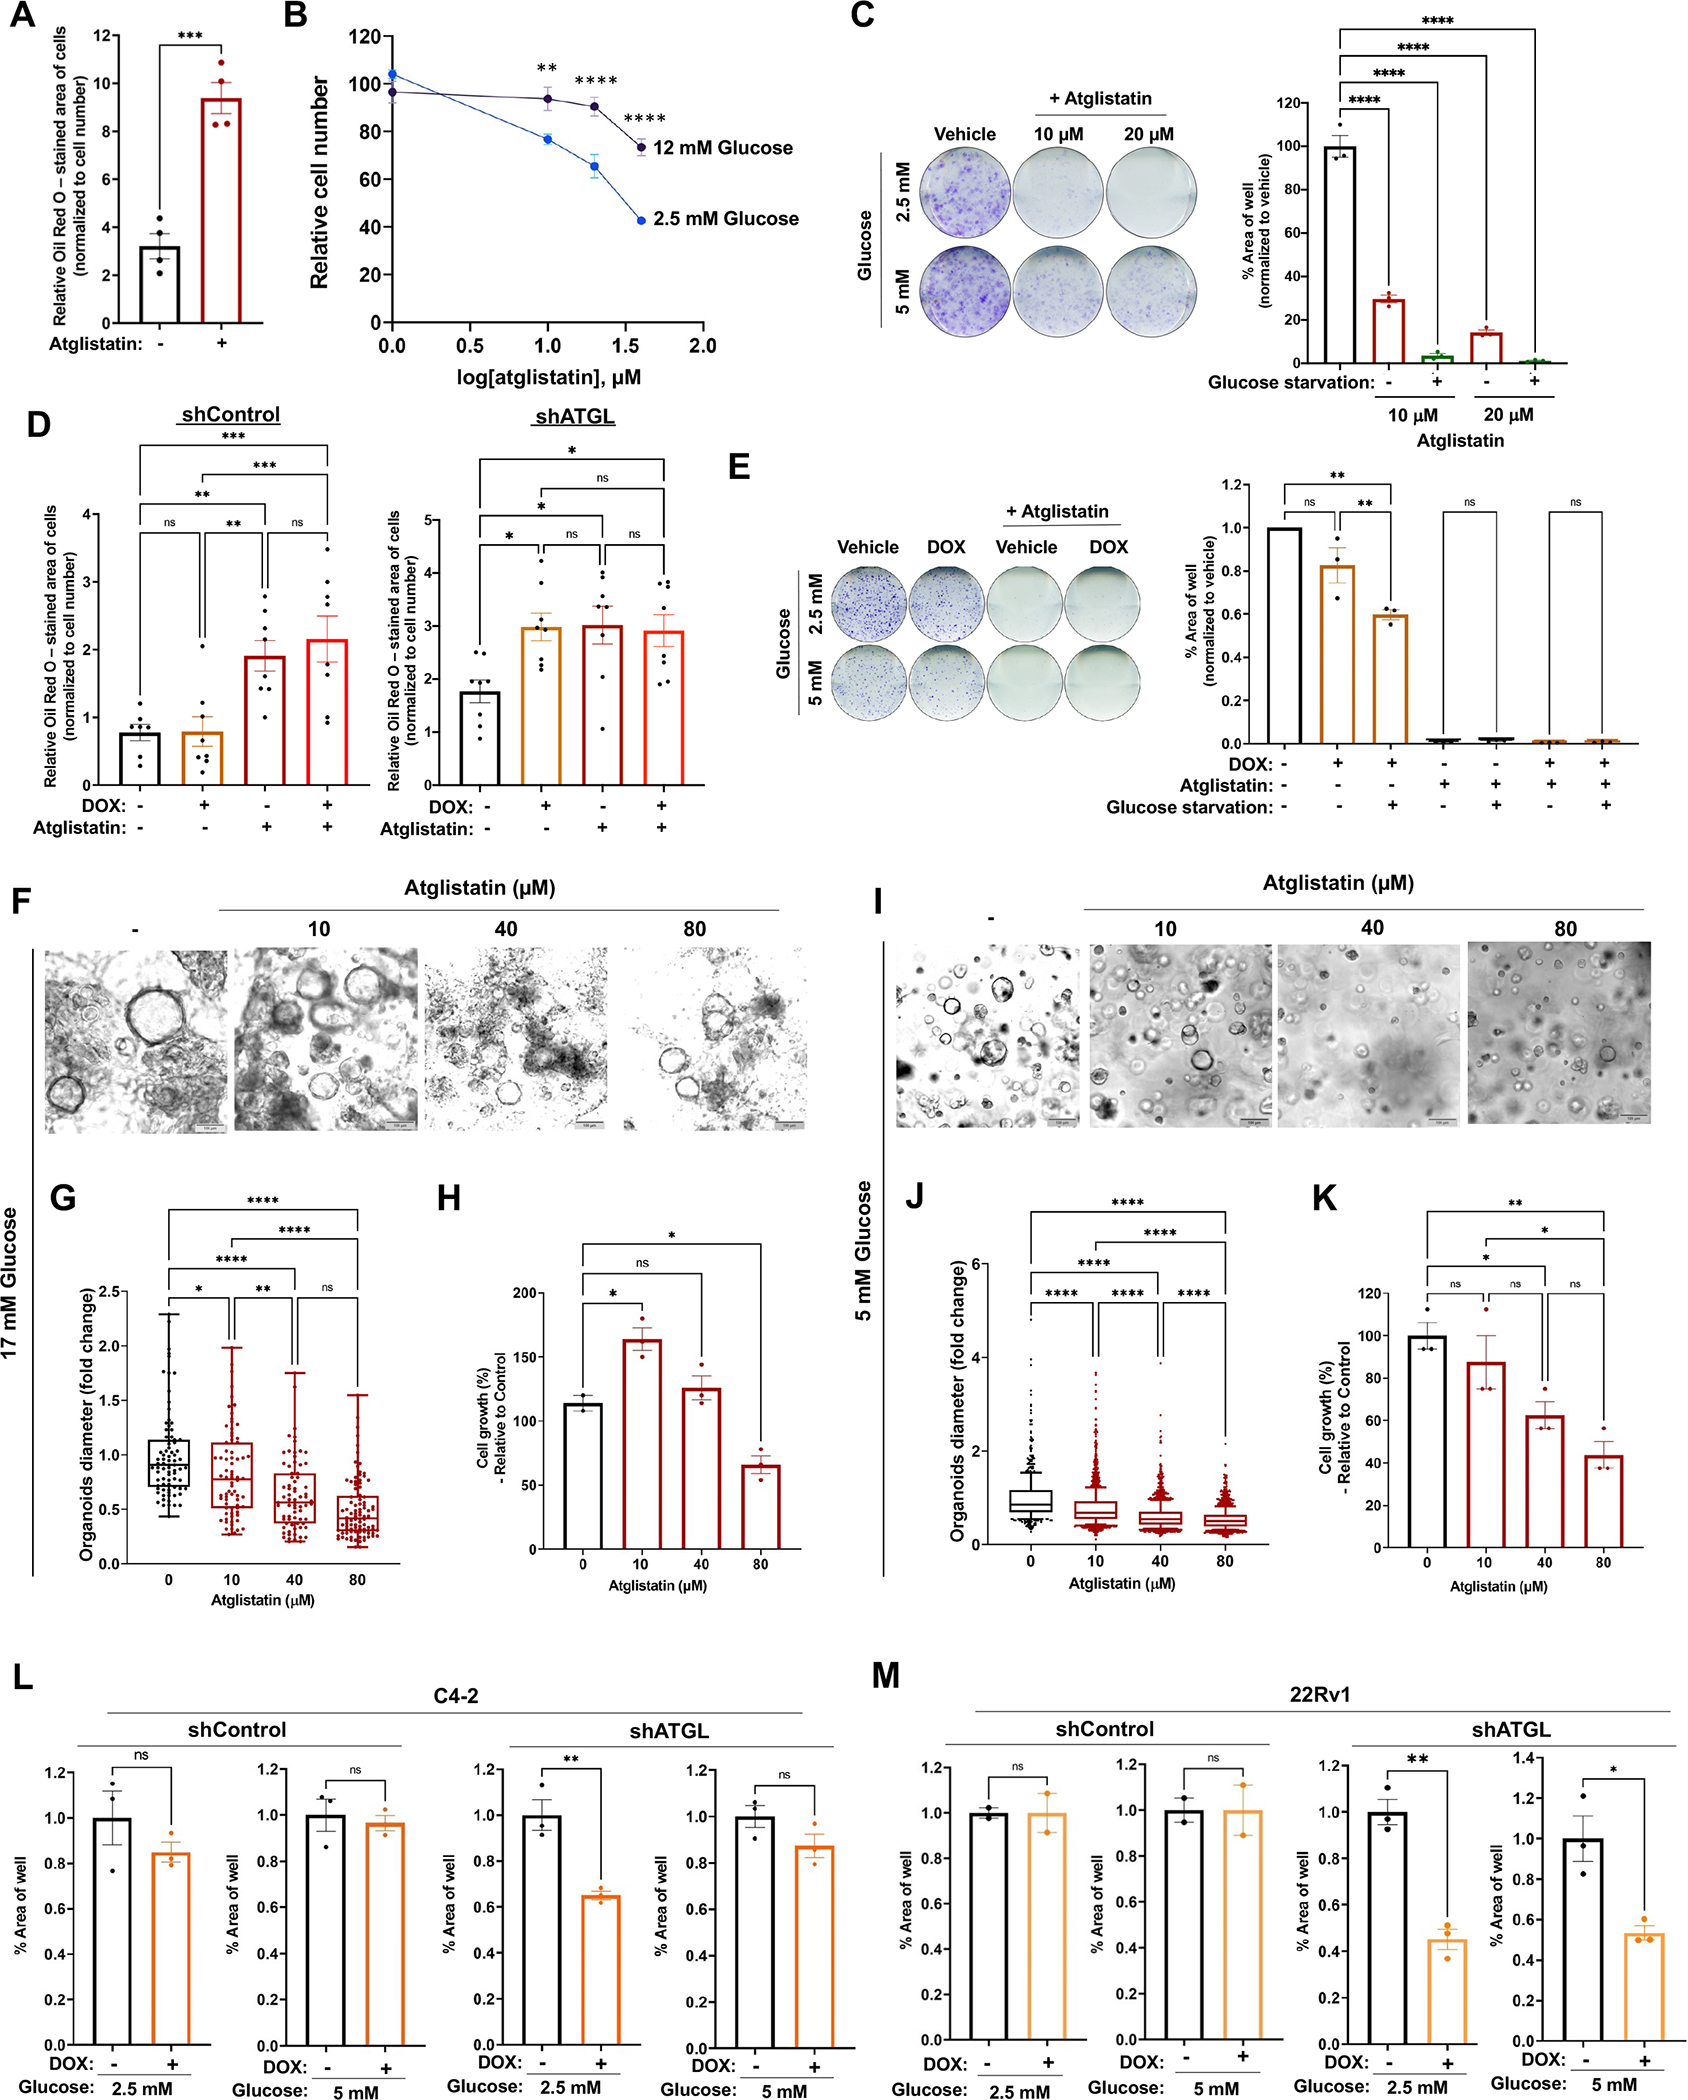
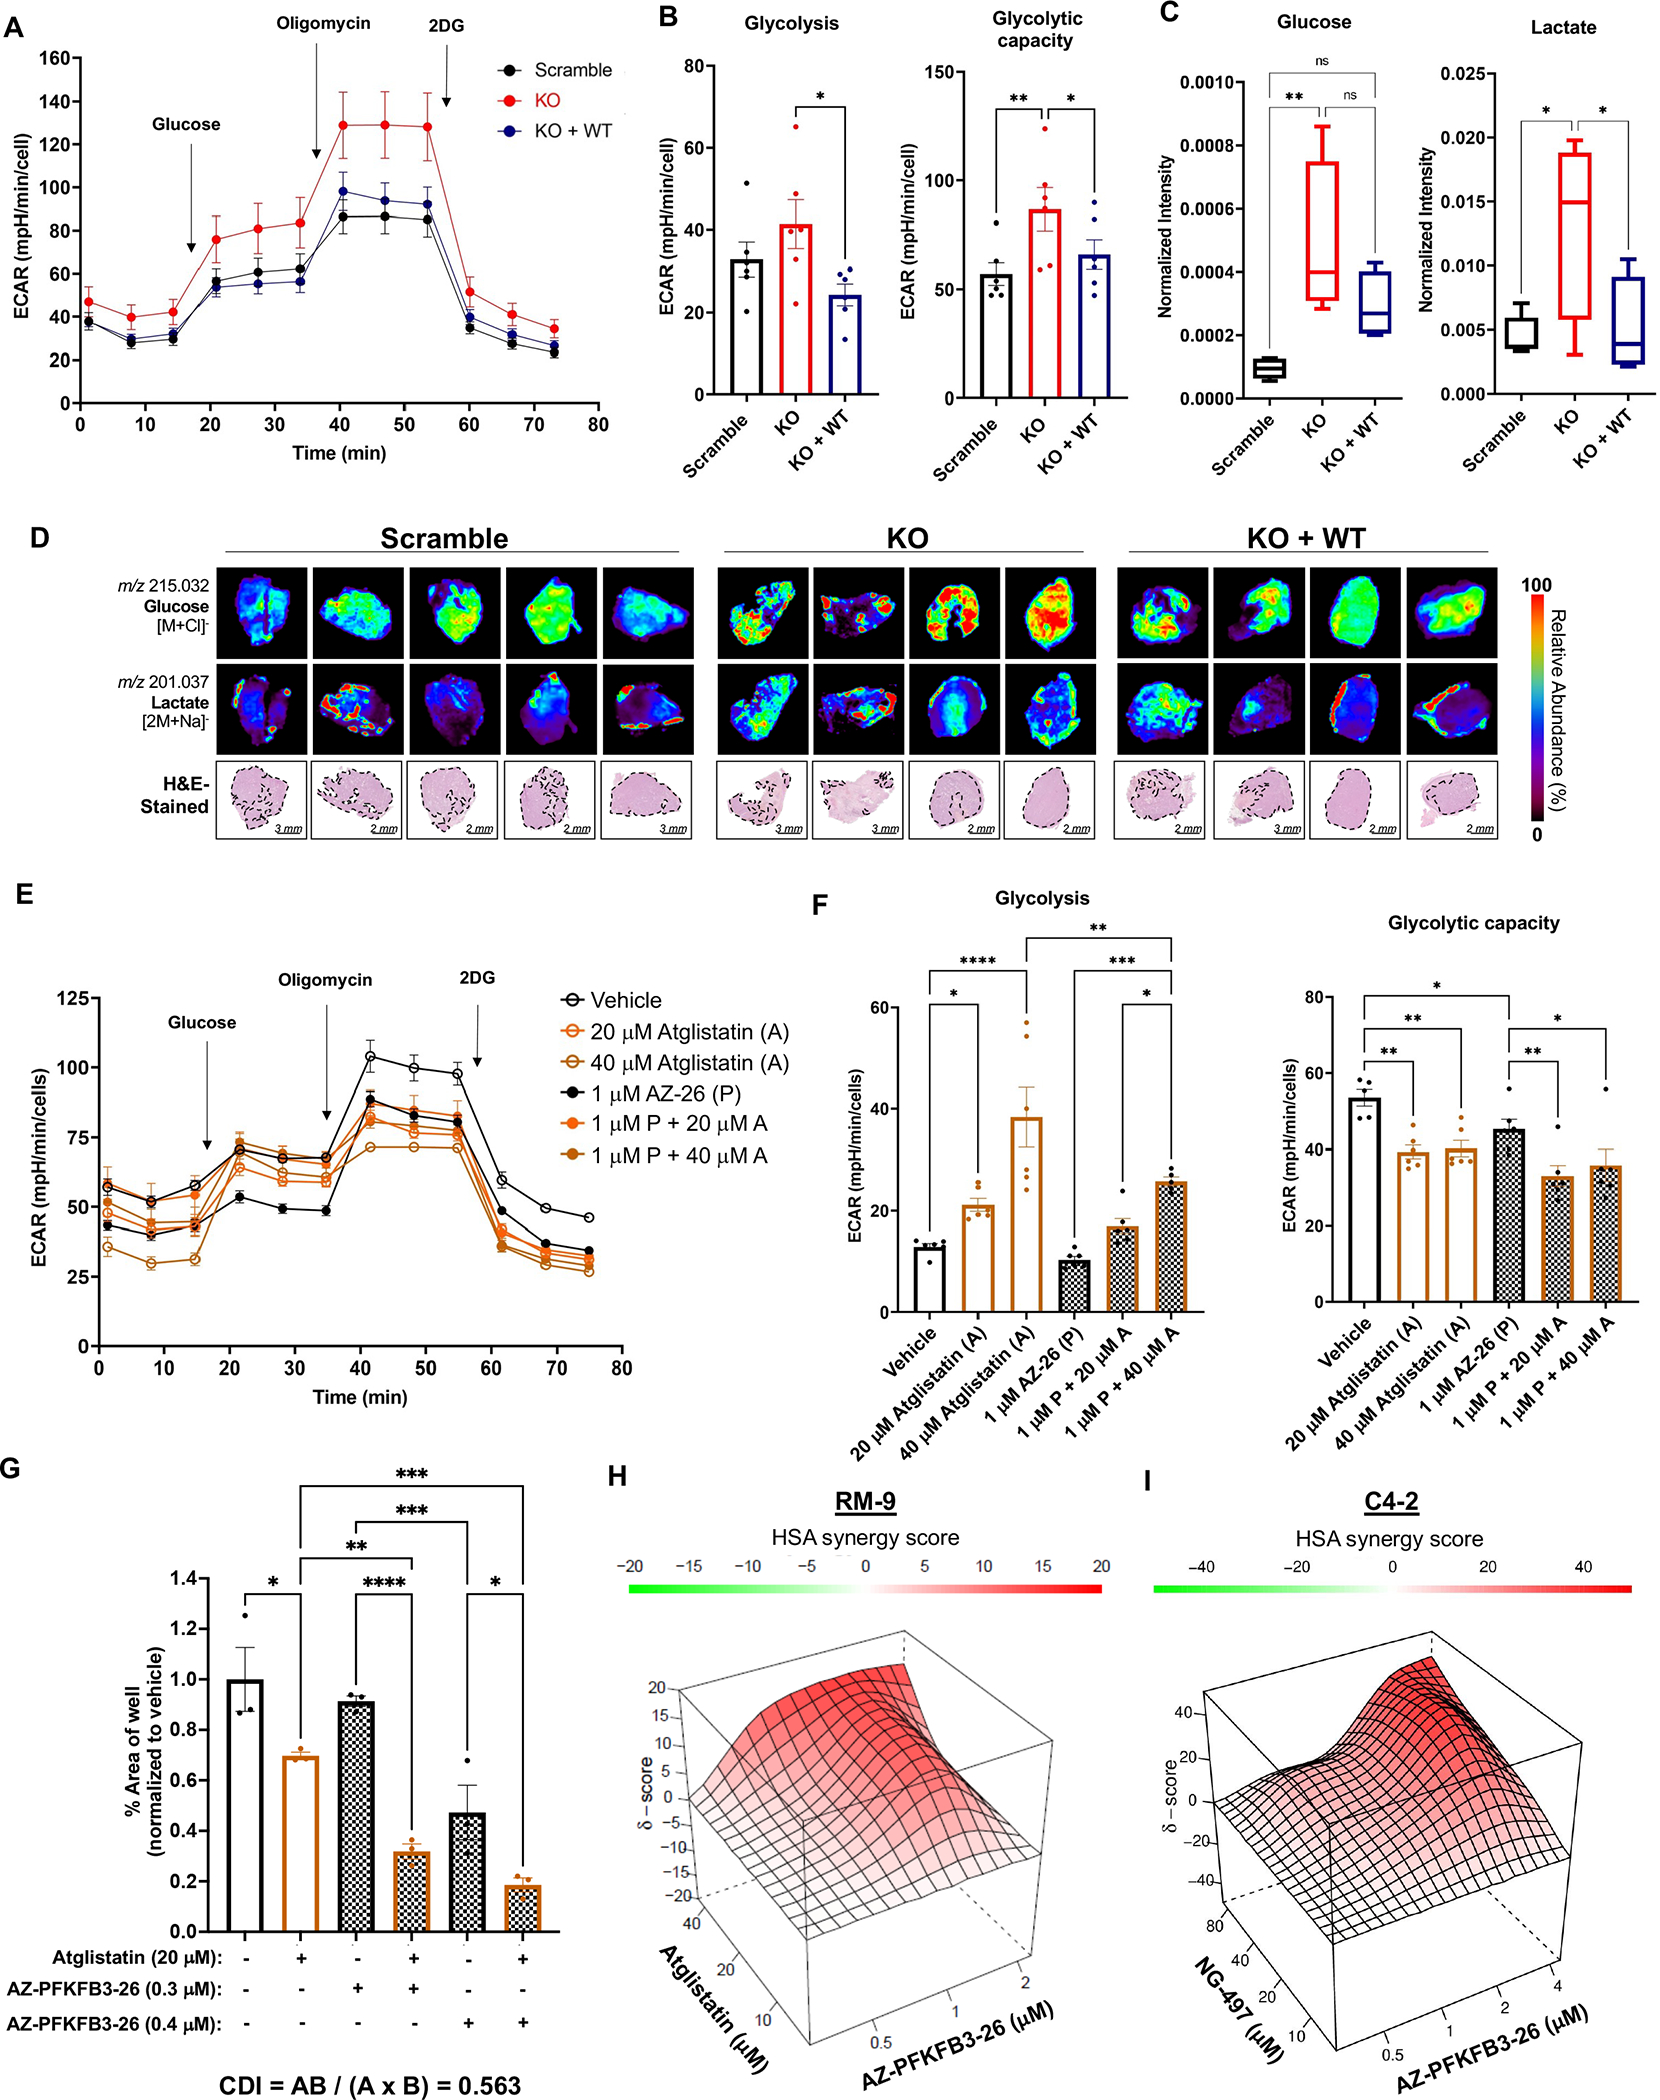
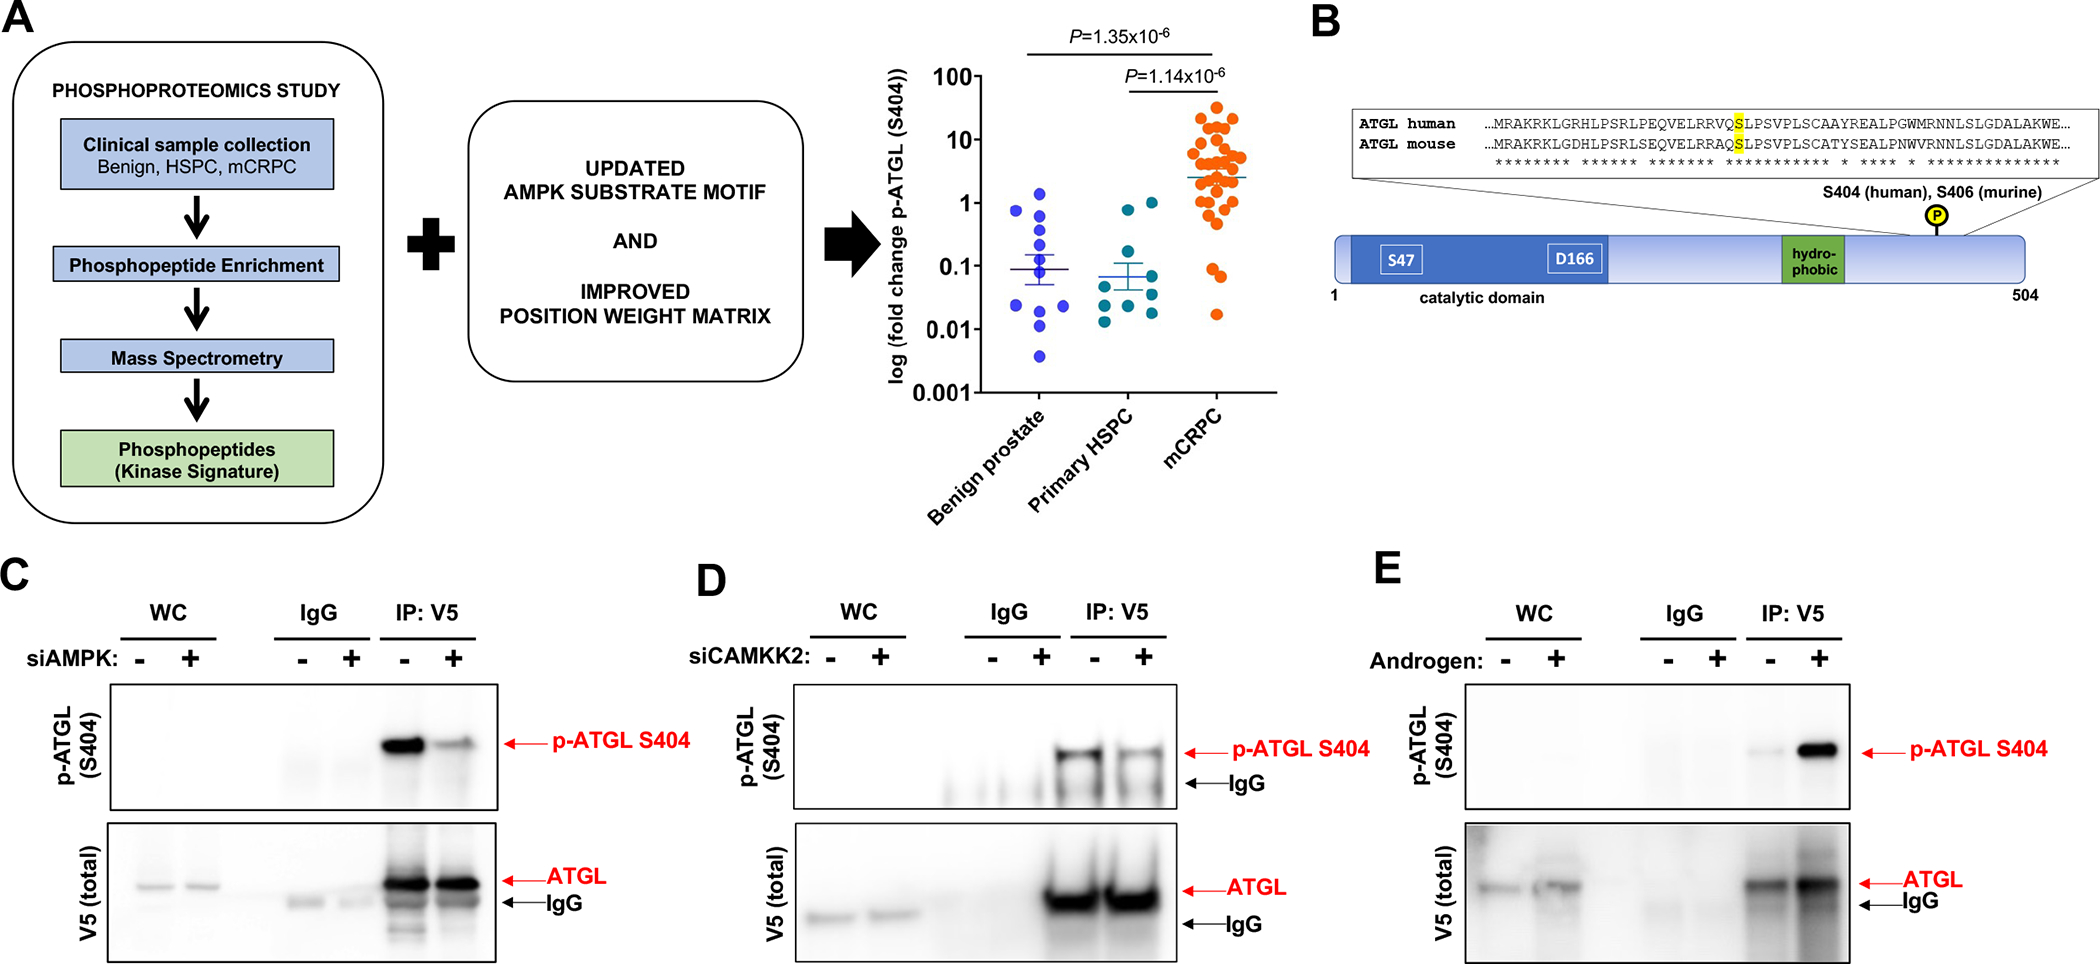
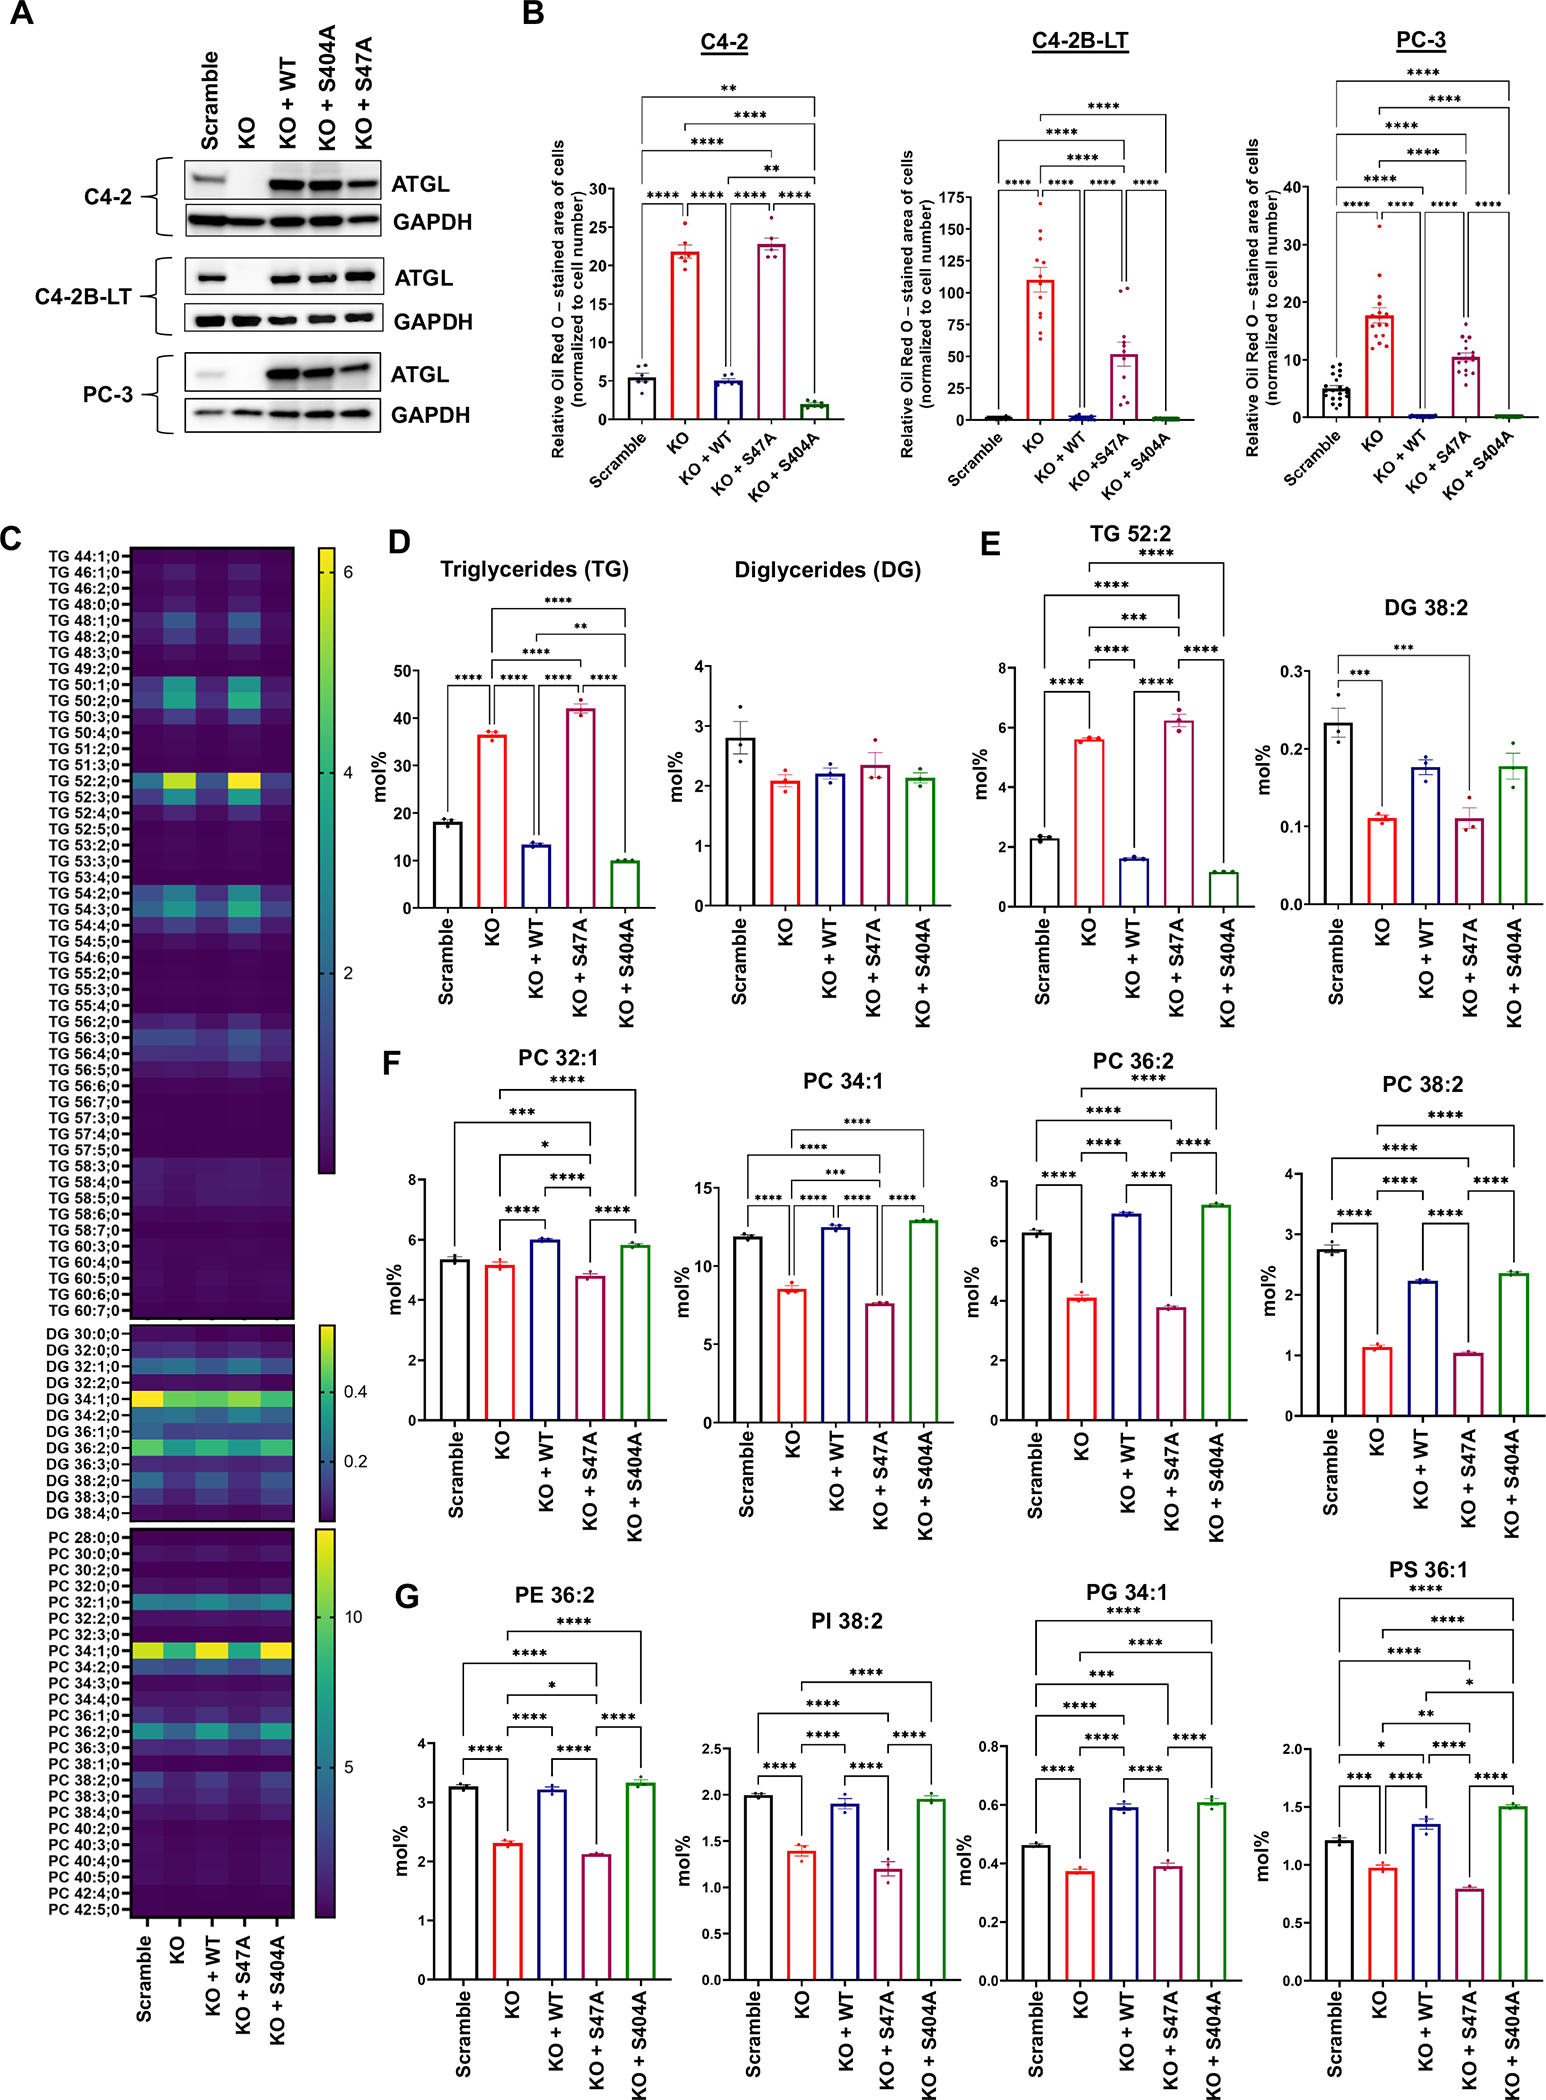
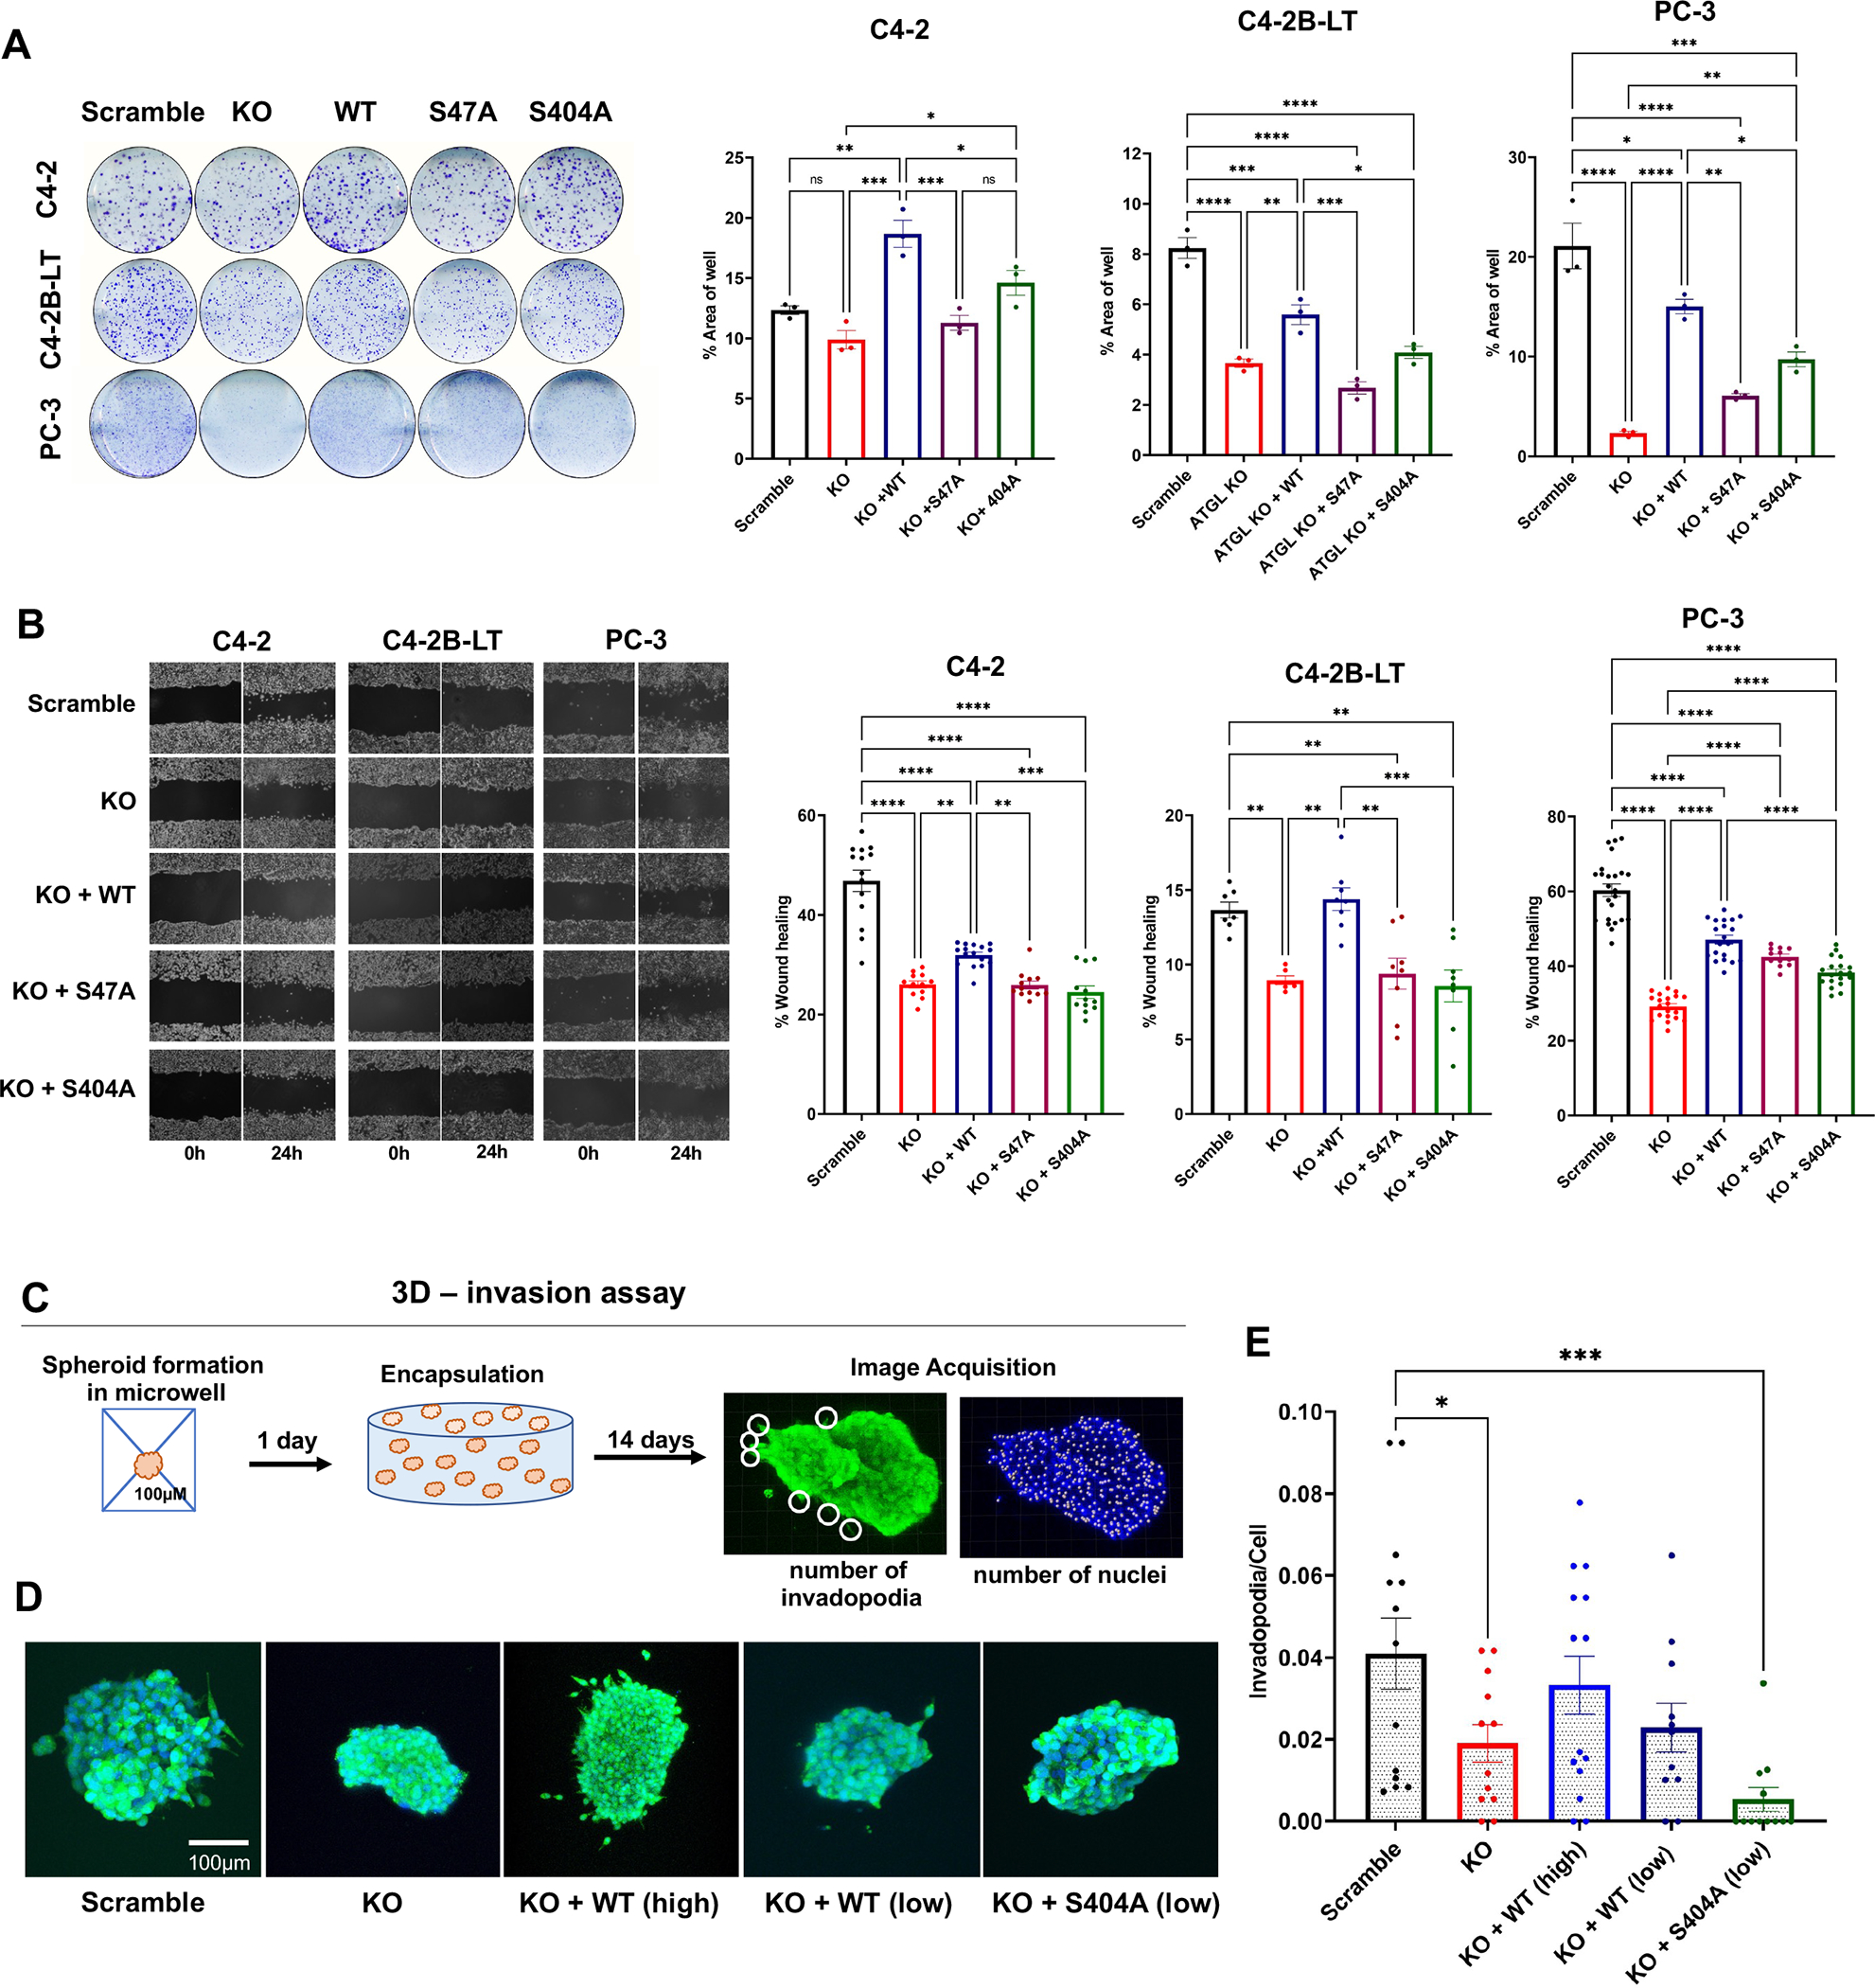
Lipid metabolism plays a central role in prostate cancer. To date, the major focus has centered on de novo lipogenesis and lipid uptake in prostate cancer, but inhibitors of these processes have not benefited patients. A better understanding of how cancer cells access lipids once they are created or taken up and stored could uncover more effective strategies to perturb lipid metabolism and treat patients. Here, we identified that expression of adipose triglyceride lipase (ATGL), an enzyme that controls lipid droplet homeostasis and a previously suspected tumor suppressor, correlates with worse overall survival in men with advanced, castration-resistant prostate cancer (CRPC). Molecular, genetic, or pharmacologic inhibition of ATGL impaired human and murine prostate cancer growth in vivo and in cell culture or organoids under conditions mimicking the tumor microenvironment. Mass spectrometry imaging demonstrated that ATGL profoundly regulates lipid metabolism in vivo, remodeling membrane composition. ATGL inhibition induced metabolic plasticity, causing a glycolytic shift that could be exploited therapeutically by cotargeting both metabolic pathways. Patient-derived phosphoproteomics identified ATGL serine 404 as a target of CAMKK2-AMPK signaling in CRPC cells. Mutation of serine 404 did not alter the lipolytic activity of ATGL but did decrease CRPC growth, migration, and invasion, indicating that noncanonical ATGL activity also contributes to disease progression. Unbiased immunoprecipitation/mass spectrometry suggested that mutation of serine 404 not only disrupts existing ATGL protein interactions but also leads to new protein-protein interactions. Together, these data nominate ATGL as a therapeutic target for CRPC and provide insights for future drug development and combination therapies.

Significance: ATGL promotes prostate cancer metabolic plasticity and progression through both lipase-dependent and lipase-independent activity, informing strategies to target ATGL and lipid metabolism for cancer treatment.


Conflict of interest statement

Conflict of interest statement: D.E.F. has received research funding from GTx, Inc and has familial relationships with Biocity Biopharmaceuticals, Hummingbird Bioscience, Maia Biotechnology, Alms Therapeutics, Hinova Pharmaceuticals, and Barricade Therapeutics. J.M.D. has no conflicts relevant to this work. However, he holds equity in and serves as Chief Scientific Officer of Astrin Biosciences. This interest has been reviewed and managed by the University of Minnesota in accordance with its Conflict-of-Interest policies. L.S.E. is an inventor in patents related to DESI-MS imaging technology, licensed to Waters corporation. The other authors report no potential conflicts of interest. The funders had no role in the conceptualization of the study or writing of the manuscript, or in the decision to publish this article.

Figures

Figure 1:
Figure 1:. ATGL mediates prostate cancer growth in vitro and in vivo.
(A) SU2C patient data demonstrates that the increased expression of PNPLA2, genetic amplification, or copy number gain correlates with decreased overall survival compared to unaltered or decreased expression, homozygous deletion, or copy number loss of PNPLA2 (<2). n = 444; results are shown using tumor samples that were subjected to probe capture or poly(A)+ selection RNA analysis. Logrank test. *P < 0.05. (B) Knockout of PNPLA2 (ATGL KO) in C4–2 affected proliferation under physiological conditions (2.5 mM glucose, 0.5% FBS). (C) Colony formation (CFA) of AR+ (C4–2, C4–2B-LT) and AR− (PC-3) CRPC models. Scramble, ATGL KO and addbacks of ATGL wildtype (WT) were grown in the presence of 2.5 mM glucose and quantified for % area of well occupied by formed colonies at endpoint. Images (left) and quantification (right) are representative results (n≥3). (D) Mice were castrated and subcutaneously injected with scramble control (n=5), ATGL KO (n=4), or ATGL KO + WT C4–2 addback cell line derivates (n=4). (E) Individual tumor volumes until day 57 of experiment (when first mouse was sacrificed due to tumor size) and (F) survival curve. (G-I) Representative images of tumor tissue. (G) H&E stain (H&E), (H) cleaved caspase 3 (CC3), (I) p-Histone H3 (pHH3). Kaplan-Meier curves analyzed by Logrank. Other data analyzed using one-way ANOVAs. *P < 0.05, **P < 0.01, ***P < 0.001, ****P < 0.0001, ns = no significance. Data are mean ± SEM (n=3 or as indicated).
Figure 2:
Figure 2:. ATGL regulates glycerophospholipid levels in human CRPC xenografts.
(A) Representative DESI-MS images from human CRPC xenografts described in Figure 1. (B) Normalized ion intensities for malignancy-associated phosphatidylcholine (PC), phosphatidylinositol (PI), phosphatidylserine (PS), phosphatidylglycerol (PG), and phosphatidylethanolamine (PE) lipid subclasses detected in the human CRPC xenografts. Scramble (n = 5), KO (n = 4), KO + WT (n=4). One-way ANOVA and Tukey. *P < 0.05, **P < 0.01, ***P < 0.001, ****P < 0.0001, ns = no significance.
Figure 3:
Figure 3:. ATGL can be molecularly or pharmacologically targeted in diverse prostate cancer models.
(A) Murine prostate cancer cells (RM-9) stained with Oil Red O to determine the TG content upon overnight treatment with atglistatin (40 μM). (B) 7-day cell growth curve of RM-9 cells treated with atglistatin in high or low glucose. (C) CFA of RM-9 cells stably expressing doxycycline (DOX)-inducible shRNAs targeting scramble control (shControl) or Pnpla2 (shATGL) grown in variable glucose concentrations. (D) Oil Red O staining and (E) CFA, upon knockdown and/or treatment with 10 μM atglistatin. (F-K) Hi-MYC model-derived organoids grown in (F-H) typical organoid media containing high or (I-K) physiological glucose concentrations. (L) Knockdown of ATGL decreases C4–2 colony formation in a glucose-dependent manner. (M) Knockdown of ATGL in 22Rv1 cells decreases colony formation. One-way ANOVA. *P < 0.05, **P < 0.01, ***P < 0.001, ****P < 0.0001, ns = no significance.
Figure 4:
Figure 4:. ATGL KO or inhibition creates a metabolic shift towards glycolysis that can be therapeutically exploited.
(A) ECAR of glycolytic stress assay (2DG, 2-deoxyglucose). (B) Glycolysis (ECAR measurement after glucose injection), and glycolytic capacity (maximum ECAR after oligomycin injection). (C-D) DESI-MS quantification of CRPC xenografts first shown in Figure 2A, and the same H&E images are presented. (E-F) Metabolic flux analysis of RM-9 cells treated for 24h with atglistatin (A) and the glycolytic inhibitor AZ-PFKFB3–26 (AZ-26; P). (E) ECAR of glycolytic stress assay which was used to quantify (F) glycolysis and glycolytic capacity. (G) CFA of RM-9 cells co-treated with atglistatin and AZ-PFKFB3–26. CDI, Coefficient of drug interaction. (H-I) Short term co-treatment of atglistatin (H) or NG-497 (I) in combination with AZ-PFKFB3–26 was used to calculate synergy in RM-9 (H) and C4–2 (I) cells. One-way ANOVA. *P < 0.05, **P < 0.01, ***P < 0.001, ****P < 0.0001, ns = no significance.
Figure 5:
Figure 5:. ATGL is highly phosphorylated at S404 in human mCRPC and targeted by AR-CAMKK2-AMPK signaling.
(A) ATGL is highly phosphorylated at S404 in tumor samples from men with mCRPC (n=31) compared to benign (n=12) or primary, treatment-naïve hormone-sensitive prostate cancer (HSPC) (n=10). (B) Murine S406/human S404 ATGL site homology. (C-E) ATGL-V5 was overexpressed in C4–2 cells and then cells were treated with siRNAs targeting scramble control, the AMPK α catalytic subunits (PRKAA1/2) or CAMKK2 (siAMPK and siCAMKK2) or synthetic androgen (R1881) for 72h (validation of siRNA efficacy and androgen-mediated effects on CAMKK2-AMPK signaling are shown in Supplemental Fig. S9). Immunoprecipitated ATGL was tested for phosphorylation status using a developed p-ATGL S404 antibody (validation in Supplemental Fig. S17). Images are representative results of n≥3.
Figure 6:
Figure 6:. Phosphorylation of S404 does not impact ATGL’s lipolytic activity.
(A) Immunoblot of ATGL KO and add-back cell models. (B) Quantified Oil Red O staining. Data are representative results of n≥3. (C-G) Shotgun lipidomics of C4–2 ATGL KO and addback cell models. (C) Heatmaps of triglycerides (TG), diglycerides (DG) or phosphatidylcholine (PC) of detected lipid species in mol%. (D) Sum of TG and DG detected. (E) TG and DG lipid species with high abundance in samples detected. (F) Phosphatidylcholine lipids associated with prostate cancer in patient samples (Butler et al. 2021). (G) Additional lipid subclasses associated with prostate cancer (Butler et al. 2021): Phosphatidylethanolamine (PE), Phosphatidylinositol (PI), Phosphatidylglycerol (PG), Phosphatidylserine (PS). n = 3. One-way ANOVA. *P < 0.05, **P < 0.01, ***P < 0.001, ****P < 0.0001, ns = no significance.
Figure 7:
Figure 7:. Inhibition of ATGL S404 phosphorylation impairs CRPC cell proliferation, migration, and invasion.
(A) CFA of CRPC models grown in 5 mM glucose. Images (left) and quantification (right) are representative results of n≥3. (B) Migration (wound healing) analyzed over 24h. Data are expressed as mean % scratch wound closure ± SEM. Images (left) and quantification (right) are representative results of n≥3. (C) Schematic of 3D invasion assay with a matrix metalloproteinase (MMP)-sensitive crosslinker embedded in hydrogel. (D) Representative images of clusters analyzed for invasion. High indicates overexpression, low indicates close to basal expression. (E) Quantification of invasion as invadopodia/cell (n=5). One-way ANOVA. *P < 0.05, **P < 0.01, ***P < 0.001, ****P < 0.0001, ns = no significance.

References

    1. Hanahan D, Weinberg RA. Hallmarks of cancer: the next generation. Cell 2011;144:646–74 - PubMed
    1. Falchook G, Infante J, Arkenau HT, Patel MR, Dean E, Borazanci E, et al. First-in-human study of the safety, pharmacokinetics, and pharmacodynamics of first-in-class fatty acid synthase inhibitor TVB-2640 alone and with a taxane in advanced tumors. EClinicalMedicine 2021;34:100797. - PMC - PubMed
    1. Watt MJ, Clark AK, Selth LA, Haynes VR, Lister N, Rebello R, et al. Suppressing fatty acid uptake has therapeutic effects in preclinical models of prostate cancer. Sci Transl Med 2019;11 - PubMed
    1. Rae C, Fragkoulis GI, Chalmers AJ. Cytotoxicity and Radiosensitizing Activity of the Fatty Acid Synthase Inhibitor C75 Is Enhanced by Blocking Fatty Acid Uptake in Prostate Cancer Cells. Adv Radiat Oncol 2020;5:994–1005 - PMC - PubMed
    1. Zimmermann R, Strauss JG, Haemmerle G, Schoiswohl G, Birner-Gruenberger R, Riederer M, et al. Fat mobilization in adipose tissue is promoted by adipose triglyceride lipase. Science 2004;306:1383–6 - PubMed

Publication types