. 2023 Dec 26;42(12):113466.
doi: 10.1016/j.celrep.2023.113466. Epub 2023 Nov 30.

NGLY1 mutations cause protein aggregation in human neurons

Affiliations

NGLY1 mutations cause protein aggregation in human neurons

Andreea Manole et al. Cell Rep. .

Abstract

Biallelic mutations in the gene that encodes the enzyme N-glycanase 1 (NGLY1) cause a rare disease with multi-symptomatic features including developmental delay, intellectual disability, neuropathy, and seizures. NGLY1's activity in human neural cells is currently not well understood. To understand how NGLY1 gene loss leads to the specific phenotypes of NGLY1 deficiency, we employed direct conversion of NGLY1 patient-derived induced pluripotent stem cells (iPSCs) to functional cortical neurons. Transcriptomic, proteomic, and functional studies of iPSC-derived neurons lacking NGLY1 function revealed several major cellular processes that were altered, including protein aggregate-clearing functionality, mitochondrial homeostasis, and synaptic dysfunctions. These phenotypes were rescued by introduction of a functional NGLY1 gene and were observed in iPSC-derived mature neurons but not astrocytes. Finally, laser capture microscopy followed by mass spectrometry provided detailed characterization of the composition of protein aggregates specific to NGLY1-deficient neurons. Future studies will harness this knowledge for therapeutic development.

Keywords: CP: Neuroscience; NGLY1 deficiency; chaperones; fragmented mitochondria; neural cells; organoids; protein aggregates.


Conflict of interest statement

Declaration of interests The authors declare no competing interests.

Figures

Figure 1.
Figure 1.. Gene and protein network analysis of RNA and proteomic sequencing identifies several phenotypes associated with NGLY1 mutations
(A) Schematic of neuronal protocol showing subpopulations of GFP+ neurons over the time course of in vitro differentiation. (B) Sample immunostaining images showing the expression of TuJ1/MAP2/NeuN in the NGLY1 neurons. Scale bar, 20 μm. (C) Summary of NGLY1 variants. (D) Unsupervised hierarchical clustering of top expressed genes from whole-transcriptome analysis (increased, red; decreased, blue) segregates NGLY1-deficient patients vs. controls and clusters patients and controls together. (E) List of significantly enriched GO terms for uniquely upregulated genes (top) and downregulated genes (bottom). n = 3 independent experiments. (F) Volcano plot illustrating differentially expressed proteins at 4 weeks post-differentiation. The –log10 (p value) is plotted against the log2 fold change of NGLY1-deficient patients vs. controls with significant threshold t test with false discovery rate (FDR) <0.001. (G) List of significantly enriched KEGG terms for uniquely upregulated proteins (top) and downregulated proteins (bottom). n = 3 independent experiments.
Figure 2.
Figure 2.. Neuronal phenotypes associated with NGLY1 mutations
(A) Representative phase-contrast image of control and NGLY1-deficient neurons at 4 weeks of differentiation. Scale bar, 30 μm. The percentage of neuronal processes containing neuritic beads was quantified by counting approximately 60 neuronal processes per line. Individual values are presented as a mean ± SEM. n = 3 experiments. ***p < 0.0005, one-way ANOVA with Dunnett’s post hoc test. (B) Representative immunofluorescence images of MTCO2 (mitochondrial marker) in WT1 and Mut2, with the proportion of mitochondria in each category is shown in (C), for all WT and NGLY1 mutant neurons at 4 weeks post-differentiation. Scale bar, 10 μm. ≥100 cells were enumerated for quantitation. (D) Schematic rationale of JC-1. (E) Quantification showing reduced MMP in NGLY1 neurons compared with controls. Individual measurements were performed in duplicate from 3 different experiments. **p < 0.005, ***p < 0.0005, one-way ANOVA with Dunnett’s post hoc test. (F) Abnormal excitability in 4-week-old neurons derived from NGLY1-deficient patients. The points represent the mean of each cell line (patient), n = 47 control neurons (all WT), n = 20 Mut1 neurons, n = 23 Mut2 neurons; n = 20 Mut3 neurons. *p < 0.05, t test. (G) Representative recordings in current-clamp mode of evoked potentials for a control (blue), Mut1 (green), Mut2 (red), and Mut3 (pink). (H and I) Excitatory postsynaptic currents (EPSCs) recordings from 4-week-old NGLY1 neurons showing differences in amplitude and rate, respectively (as-terisks). n = 47 control neurons (all WT), n = 20 Mut1 neurons, n = 23 Mut2 neurons, n = 20 Mut3 neurons. **p < 0.005, ****p < 0.00005, t test. (J) Representative EPSC traces for control (blue), Mut1 (green), Mut2 (red), and Mut3 (pink). WT1: CP1-E8C, WT2: CP1-E11C, WT3: CP1-E8–11C, Mut1: CP1, Mut2: CP2, and Mut3: CP7.
Figure 3.
Figure 3.. PSPA detection in NGLY1 neurons
(A) Representative images following staining with ProteoStat aggresome dye (red) on neurons derived from the iPSCs of NGLY1-deficient patients and isogenic control neurons. Neurons were stained 4 weeks after differentiation. GFP (green; NGN2 transduced neuron); DAPI (blue; nuclear stain). Yellow is due to overlap between GFP and the ProteoStat aggresome dye. The red staining in the background represents non-specific binding due to debris in the culture. Scale bar, 10 μm. The percentage of neurons positive for the Aggresome dye was quantified by counting approximately 120 neurons for WT and Mut. Individual values are presented as a mean ± SEM. *p < 0.05, ***p < 0.0005, one-way ANOVA with Dunnett’s post hoc test. (B) Representative electron micrographs showing cellular localization of electron-dense PSPAs (white arrows) in the soma (top) and neurites (bottom) of NGLY1 mutant neurons. Scale bars, (top) 1 μm and (bottom) 0.5 μm. (C) Left: correlative light and electron microscopy showing that the fluorescent signal seen by confocal microscopy corresponds to intracellular electron-dense amorphous round structures in electron micrographs of the same region (CT, cytoplasm; NC, nucleus). Top right: GFP (green) is localized in the cytoplasm, and ProteoStat aggresome dye (red) stains the intracellular PSPAs of Mut1 neurons. Bottom right: magnified view of the aggregate depicted in the white square above. (D) Schematic of rescue with NGLY1 lentivirus in Mut over the time course of in vitro differentiation. (E) Representative images following staining with ProteoStat aggresome dye (red) on neurons derived from the iPSCs of NGLY1-deficient patients, isogenic control neurons, and NGLY1-deficient patients that have been transduced with lentivirus. Neurons were stained 4 weeks after differentiation. GFP (green; NGN2 transduced neuron); DAPI (blue; nuclear stain). Scale bar, 10 μm. (F) The percentage of neurons positive for the aggresome dye was quantified by counting approximately 120 patient-derived (Mut) and NGLY1 lentivirus-transduced patient-derived (Mut+NGLY1) neurons. Individual values are presented as a mean ± SEM. **p < 0.005, ***p < 0.0005, Mann-Whitney U test.
Figure 4.
Figure 4.. Differentiation of NGLY1 astrocytes via glial progenitor cells
(A) Schematic representation of the experimental paradigm used for differentiation of human astrocytes over a total time of 6–8 weeks. Human iPSCs were used to generate floating embryoid bodies, followed by dissociated glial progenitor cells (GPCs), and were differentiated to astrocytes in monolayers. (B) Representative fluorescent images of immunostainings for control and NGLY1-deficient patient astrocytes (4-week differentiation post-GPCs; 6-week differentiation for GFAP) expressing S100β (green) and CD44 (green). All cells were counterstained for DAPI (blue). Scale bars, 20 μm. Quantifications for percentage of astrocytes; positive for the listed markers over DAPI. Results are expressed as means ± SEM, n = 3 experiments for iPSC-derived lines. (C) Representative immunofluorescence images of MTCO2 (mitochondrial marker), with the proportion of mitochondria in each category is shown in (D), for WT and NGLY1 mutant astrocytes at 6 weeks post-differentiation. Scale bar, 10 μm. (E) Quantification of MMP in NGLY1 astrocytes compared with controls. Individual measurements were performed in duplicate from 3 different experiments. Individual values are presented as a mean ± SEM. Not significant (ns) = p > 0.05, one-way ANOVA with Dunnett’s post hoc test. (F) Representative images following staining with ProteoStat aggresome dye (red) on astrocytes derived from the iPSCs of NGLY1-deficient patients and isogenic control neurons. Astrocytes were stained 6 weeks after differentiation. S100β (green); DAPI (blue; nuclear stain). Treatment with the proteasome inhibitor MG-132 serves a positive control demonstrating the induction of PSPA formation in control cells. Scale bar, 10 μm.
Figure 5.
Figure 5.. Phenotypes of NGLY1 organoids
(A) Schematic diagram of forebrain organoid protocol and sample phase images at different stages. Scale bars, 200 μm. (B) Size of control (WT1, WT2) and NGLY1-deficient (Mut1 and Mut2) patient-derived forebrain-type organoids at two time points. n = 30 organoids for each clone. Data are presented as boxplots illustrating 80% of the data distribution. 10th, 25th, median, 75th, and 90th percentiles are shown for these and all subsequent boxplots. ns = p > 0.05, Mann-Whitney U test. (C) Schematic illustration of how loop diameter and length of apical membrane were quantified. (D) Representative images of immunocytochemical characterization of organoids at day 40 ± 5. Organoids organize in multiple neuroepithelial loops. Organoids are stained with neural progenitor marker SOX2 (pink), neuronal marker MAP2 (green), and DAPI (blue). Scale bar, 50 μm. (E and F) Quantification of the (E) loop diameter and (F) length of apical membrane in controls (n = 58) and patients (n = 57). Results are expressed as means ± SEM, n = 3 experiments. *p < 0.05, **p < 0.005, Mann-Whitney U test. (G) Representative images of immunocytochemical staining of organoids at day 40 ± 5. Organoids are stained with caspase-3, CAS3 (red), and DAPI (blue). Scale bar, 40 μm. (H) Quantification of the caspase-3-positive cells in the ventricular zone (VZ)-like and subventricular zone (SVZ)-like regions in day-40 organoid sections (of WT1, WT2, Mut1, and Mut2). Results are expressed as means ± SEM, n = 3 experiments. ****p < 0.00005, Mann-Whitney U test. (I) Representative images following use of ProteoStat aggresome dye (red) on organoids at 100 days of differentiation in vitro. MAP2, neuronal marker (green); DAPI, nuclei marker (blue). Scale bar, 20 μm. (J) The percentage of organoids positive for the aggresome dye was quantified by counting approximately 100 organoids. Individual values are presented as a mean ± SEM. ****p < 0.00005, Mann-Whitney U test.
Figure 6.
Figure 6.. Functional characterization of NGLY1 PSPAs
(A) Schematic of laser capture microscopy rationale. (B) Venn diagram of unique and shared proteins in NGLY1 neurons identified by mass spectroscopy. Results are from 2 experiments, n = 7 for each group. (C) Protein ontology over-representation analysis of NGLY1 neurites, performed using WebGestaltR v.0.3.1 and the KEGG pathway database. Terms were considered over-represented using a false discovery threshold of 0.05. (D) Representative images following use of DNAJA2 (green) and ProteoStat aggresome dye (red) on neurites at 4 weeks of neural differentiation. GFP (blue). Scale bar, 5 μm. Arrow indicates co-localization of the DNAJA2 and ProteoStat aggresome dye. (E–G) Immunoblotting with anti-HSPA8 (G), HSP70B (F), and DNAJA2 (E) antibodies (70, 70, and 50 kDa, respectively); loading control (bottom, 37 kDa). Right: quantification for each stain. Specific immunoreactive signals for DNAJA2 subunits from iPSC-derived neurons in each lane (integral band intensity) were normalized to the corresponding GAPDH band intensity. Results are expressed as means ± SEM, n = 3 or 4 experiments. *p < 0.05, **p < 0.005, one-way ANOVA with Dunnett’s post hoc test.
Figure 7.
Figure 7.. Structural characterizations of NGLY1 PSPAs
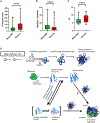
(A–C) Structural characterizations of proteins that are uniquely found in mutant neurites or are common between mutant and control neurites. ns = p > 0.05, ****p < 0.00005, Mann-Whitney U test. (D) Proposed mechanism of aggresome formation in NGLY1-deficient neurons. In NGLY1-deficient cells, endo-beta-N-acetylglucosaminadase (ENGase) acts stochastically to cleave glycans on misfolded glycoproteins. Reaction of ENGase with misfolded glycoproteins results in the formation of N-GlcNAc proteins that may in turn cause the formation of toxic protein aggregates. After synthesis from the ribosome, a protein folds through different intermediates to its native structure. Several factors can cause protein misfolding. Once present, misfolded intermediates can be refolded to the native state or be degraded by different cellular proteolysis systems that prevent the accumulation of misfolded proteins. If the quality-control network is overwhelmed, for example with N-GlcNAc proteins and/or through persisting stress conditions, increased amounts of aberrant proteins can form. Their further aggregation can be influenced by the presence of N-GlcNAc proteins. Forming aggregates will mostly be an apparently unordered aggregation of proteins, with each individual protein not generally associated with disease. Molecular chaperones will be a significant presence in these aggregates to provide folding assistance.

References

    1. Suzuki T, Huang C, and Fujihira H. (2016). The cytoplasmic peptide:N-glycanase (NGLY1) - Structure, expression and cellular functions. Gene 577, 1–7. - PMC - PubMed
    1. Huang C, Harada Y, Hosomi A, Masahara-Negishi Y, Seino J, Fujihira H, Funakoshi Y, Suzuki T, Dohmae N, and Suzuki T. (2015). Endo-β-N-acetylglucosaminidase forms N-GlcNAc protein aggregates during ER-associated degradation in Ngly1-defective cells. Proc. Natl. Acad. Sci. USA 112, 1398–1403. - PMC - PubMed
    1. Enns GM, Shashi V, Bainbridge M, Gambello MJ, Zahir FR, Bast T, Crimian R, Schoch K, Platt J, Cox R, et al. (2014). Mutations in NGLY1 cause an inherited disorder of the endoplasmic reticulum-associated degradation pathway. Genet. Med 16, 751–758. - PMC - PubMed
    1. Lam C, Ferreira C, Krasnewich D, Toro C, Latham L, Zein WM, Lehky T, Brewer C, Baker EH, Thurm A, et al. (2017). Prospective phenotyping of NGLY1-CDDG, the first congenital disorder of deglycosylation. Genet. Med 19, 160–168. - PMC - PubMed
    1. Freeze HH (2013). Understanding human glycosylation disorders: biochemistry leads the charge. J. Biol. Chem 288, 6936–6945. - PMC - PubMed

Publication types

Substances