. 2023 Dec;9(48):eadj2801.
doi: 10.1126/sciadv.adj2801. Epub 2023 Dec 1.

Highly sensitive single-molecule detection of macromolecule ion beams

Affiliations

Highly sensitive single-molecule detection of macromolecule ion beams

Marcel Strauß et al. Sci Adv. 2023 Dec.

Abstract

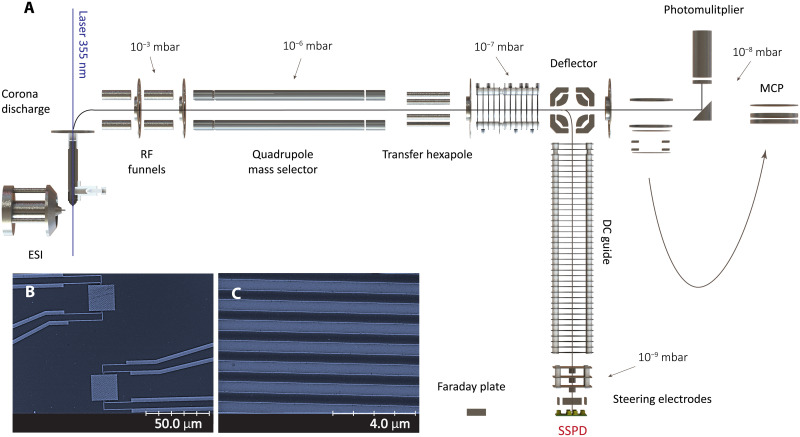
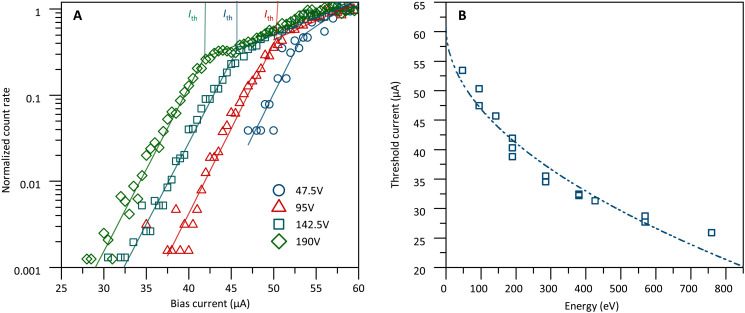
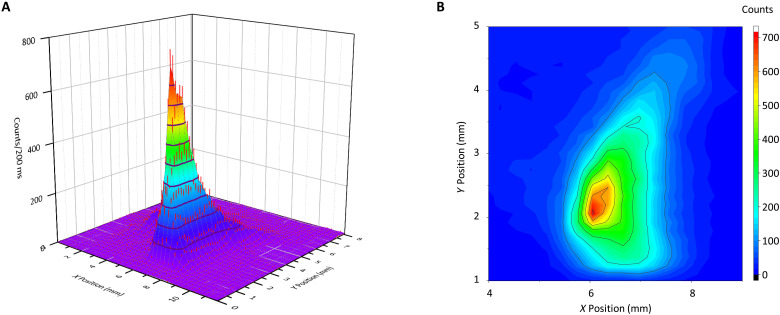
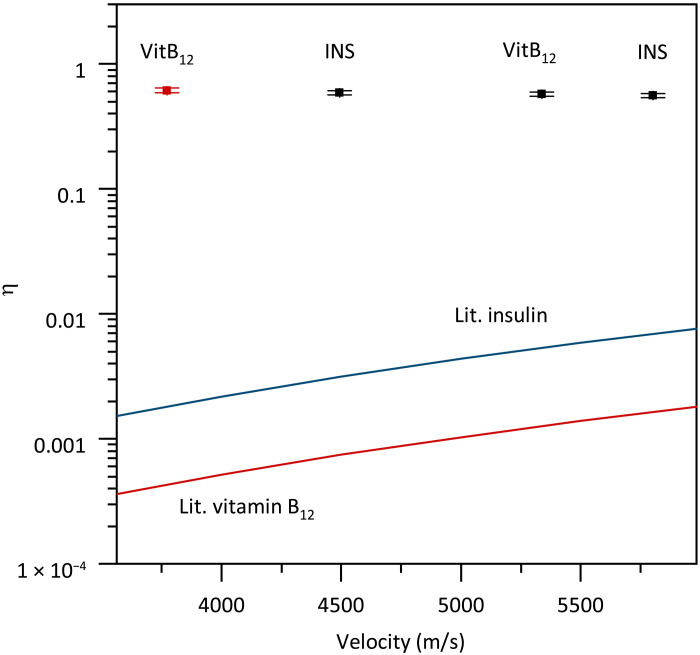
The analysis of proteins in the gas phase benefits from detectors that exhibit high efficiency and precise spatial resolution. Although modern secondary electron multipliers already address numerous analytical requirements, additional methods are desired for macromolecules at energies lower than currently used in post-acceleration detection. Previous studies have proven the sensitivity of superconducting detectors to high-energy particles in time-of-flight mass spectrometry. Here, we demonstrate that superconducting nanowire detectors are exceptionally well suited for quadrupole mass spectrometry and exhibit an outstanding quantum yield at low-impact energies. At energies as low as 100 eV, the sensitivity of these detectors surpasses conventional ion detectors by three orders of magnitude, and they offer the possibility to discriminate molecules by their impact energy and charge. We demonstrate three developments with these compact and sensitive devices, the recording of 2D ion beam profiles, photochemistry experiments in the gas phase, and advanced cryogenic electronics to pave the way toward highly integrated detectors.


Figures

Fig. 1.
Fig. 1.. Quadrupole mass spectrometry with superconducting single particle detection.
(A) Proteins are volatilized using electrospray ionization charge-reduced in bipolar air by a corona discharge. Further charge reduction by photochemistry is enabled by a high-power ultrafast ultraviolet laser interacting with the molecules in the entrance chamber. The ions are filtered in a quadrupole mass selector and pass through a radio frequency hexapole guide toward a quadrupole deflector. The ions are then steered to either a TOF-MS with multichannel plate (MCP), a phosphor screen with photo-multilpier (PhS), or the SSPD array. A Faraday plate can be shifted into the position of the SSPD to calibrate the incident ion current at high flux. Panel (B) shows an electron micrograph of two pixels (SSPDs), each with a size of 20 × 20 μm2 (D1), while (C) shows a close-up image of a detector pixel (D2) that has a 100 times larger area and a 500-nm line width, as also described in the text.
Fig. 2.
Fig. 2.. Impact energy in QMS-SSPD versus QMS-PhS mass spectra.
(A) Charge-reduced concanavalin A recorded by the SSPD (D2) at 190 V and (B) a phosphor screen detector at 10 kV. Panels (A) and (B) show solid lines representing data smoothed using 15-point and 25-point moving averages, respectively.
Fig. 3.
Fig. 3.. Signal background and complexity in QMS-SSPD versus TOF-MCP spectra.
The sample is a mixture of insulin, cytochrome C, and myoglobin. The signal background of QMS-SSPD with detector D2 (A) is lower than that of TOF-MS (C). Charge reduction facilitates the peak assignment and QMS-SSPD detection shows higher counts at higher mass to charge states (B) than the TOF-MS MCP detector (D). The solid lines represent a five-point moving average of the data. Note that while the spectra in both detector modes resemble each other, as they should, the QMS-SSPD data were recorded at 50 times lower kinetic energy of the ions.
Fig. 4.
Fig. 4.. Influence of energy/mass/momentum/structure on the detection mechanism.
(A) Energy dependence of the normalized count rate. The normalized protein count rate is shown as a function of the SSPD (D2) bias current Ib, for insulin in the charge states q = +1e, +2e, and +4e and for the acceleration voltages Uacc = 47.5,95 V,142.5,190 V. The observation of three groups of data confirms that the detection efficiency depends not only on the bias current but also on the kinetic energy Ekin = q · Uacc, but not separately on the charge of the molecule. This can enhance standard mass spectrometry, where m/z is the prime quantity. (B) Mass/momentum/structure independence. At equal impact energy of Ekin = 190 eV and equal charge, we find the same normalized detector response curve for molecules of vastly different structure and complexity, specifically rhodamine 6G, insulin, and myoglobin. This suggests that kinetic energy is of prime relevance, while molecular structure, atom number, charge, and mass are not.
Fig. 5.
Fig. 5.. Confirmation of the hot spot model for detector D2.
(A) Threshold currents: From the bias current scans a threshold current Ith can be defined by finding the intersection of the asymptotes (straight lines) of the count rate as a function of the bias current Ib. (B) Hot spot detection model. When we plot Ith for insulin as a function of kinetic energy, the data are well fitted by the hot spot model (dashed line; see text).
Fig. 6.
Fig. 6.. SSPD beam profile of a mass-selected Insulin (Ins5+) ion beam at 1000 eV of impact energy.
To illustrate the signal-to-noise ratio and the beam shape, the same data are shown as a three-dimensional image (A) and as a contour plot (B). The X position represents the mechanical shift of one SSPD pixel (D2). The Y shift quantifies the mechanical shift of the ion beam generated by the deflection in an external field (see the Supplementary Materials). The asymmetry of the ion beam is due to the geometry of the ion bender.
Fig. 7.
Fig. 7.. Total molecule detection quantum yield.
The black squares show the average of the total detection quantum yield of two different pixels of detector D2 as a function of impact velocity for (from left to right) insulin at 600 eV, vitamin B12 at 200 eV, and insulin at 1000 eV of impact energy. The red data point for vitamin B12 at 100 eV (left) was recorded using six individual pixels of the second detector array D2. They all show the same total quantum yield within the error bar. The red and blue lines show expected literature values for MCPs (42). For a detailed discussion of the quantum yield and its uncertainties, see the Supplementary Materials.

References

    1. W. Paul, Electromagnetic traps for charged and neutral particles. Rev. Mod. Phys. 62, 531–540 (1990).
    1. K. Fehre, D. Trojanowskaja, J. Gatzke, M. Kunitski, F. Trinter, S. Zeller, L. P. H. Schmidt, J. Stohner, R. Berger, A. Czasch, O. Jagutzki, T. Jahnke, R. Dorner, M. S. Schoffler, Absolute ion detection efficiencies of microchannel plates and funnel microchannel plates for multi-coincidence detection. Rev. Sci. Instrum. 89, 045112 (2018). - PubMed
    1. A. Brunelle, P. Chaurand, S. Della-Negra, Y. L. Beyec, E. Parilis, Secondary electron emission yields from a csi surface under impacts of large molecules at low velocities (5x10³–7x10⁴ ms–1). Rap. Comm. Mass Spectr. 11, 353–362 (1997).
    1. R. J. Beuhler, L. Friedman, Threshold studies of secondary electron emission induced by macro-ion impact on solid surfaces. Nucl. Instr. Meth. Phys. Res. A 170, 309–315 (1980).
    1. D. Twerenbold, D. Gerber, D. Gritti, Y. Gonin, A. Netuschill, F. Rossel, D. Schenker, J.-L. Vuilleumier, Single molecule detector for mass spectrometry with mass independent detection efficiency. Proteomics 1, 66–69 (2001). - PubMed