. 2023 Dec;9(48):eadg8014.
doi: 10.1126/sciadv.adg8014. Epub 2023 Dec 1.

Harnessing T cell exhaustion and trogocytosis to isolate patient-derived tumor-specific TCR

Affiliations

Harnessing T cell exhaustion and trogocytosis to isolate patient-derived tumor-specific TCR

Francesco Manfredi et al. Sci Adv. 2023 Dec.

Abstract

To study and then harness the tumor-specific T cell dynamics after allogeneic hematopoietic stem cell transplant, we typed the frequency, phenotype, and function of lymphocytes directed against tumor-associated antigens (TAAs) in 39 consecutive transplanted patients, for 1 year after transplant. We showed that TAA-specific T cells circulated in 90% of patients but display a limited effector function associated to an exhaustion phenotype, particularly in the subgroup of patients deemed to relapse, where exhausted stem cell memory T cells accumulated. Accordingly, cancer-specific cytolytic functions were relevant only when the TAA-specific T cell receptors (TCRs) were transferred into healthy, genome-edited T cells. We then exploited trogocytosis and ligandome-on-chip technology to unveil the specificities of tumor-specific TCRs retrieved from the exhausted T cell pool. Overall, we showed that harnessing circulating TAA-specific and exhausted T cells allow to isolate TCRs against TAAs and previously not described acute myeloid leukemia antigens, potentially relevant for T cell-based cancer immunotherapy.


Figures
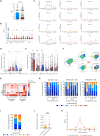
Fig. 1.
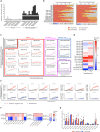
Fig. 1.. TAA-specific T cells accumulate exhausted TSCM cells and contract before relapse.
Total circulating CD8+, TAA-specific and CMV-specific T cells were evaluated in N = 39 transplanted patients at sequential time points. (A to C) Number of circulating CMV- and TAA-specific T cells, in all time points (A), parsed according to antigen specificity (B) and to the time point after allo-HSCT (C); median and interquartile ranges. Mann-Whitney test (A). (D) Memory phenotype on total CD8+, CMV-specific, and TAA-specific T cells after allo-HSCT. Unpaired multiple Student’s t tests. Median and interquartile ranges. (E) Frequency of IRs expression on total CD8+, CMV-specific, and TAA-specific T cells. Unpaired multiple Student’s t tests. Median and interquartile ranges. (F and G) TAA- and CMV-specific events were analyzed with cytoChain. (F) Barnes-Hut Stochastic Neighbor Embedding (BH-SNE) biaxial plot of all events (left), then divided into CMV- and TAA-specific events (mid). Areas significantly enriched with either CMV- or TAA-specific events were highlighted (right). (G) Fold change with respect to dataset baseline, in each cluster significantly enriched for either CMV- or TAA-specific events. (H) Frequency of IRs coexpression on total CD8+, CMV-specific, and TAA-specific T cells. (I) IRs coexpression in TAA-specific T cells, in patients achieving long-term complete remission (CR) or experiencing relapse (REL). (J) Circulating exhausted TSCM, parsed according to long-term disease status. Median and interquartile ranges. Mann-Whitney test. (K) Circulating TAA-specific T cells in patients with CR and REL. Two-way analysis of variance (ANOVA). Mean and SEM. TNa, naïve T cells (CD45RA+CD62L+CD95); TSCM, stem cell memory T cells (CD45RA+CD62L+CD95+); TCM, central memory T cells (CD45RACD62L+); TEM, effector memory T cells (CD45RACD62L); TEMRA, terminal effector T cells (CD45RA+CD62L). Dex CMV, CMV-specific T cells measured with dextramers. Dex tumor, TAA-specific T cells measured with dextramers. *P < 0.05; **P < 0.01; ***P < 0.001; ****P < 0.0001.
Fig. 2.
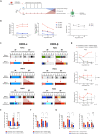
Fig. 2.. Functional TAA-specific TCRs can be isolated from patients’ peripheral blood.
TAA-specific T cells were isolated, expanded, and then tested in vitro. (A) Dextramer+ events ex vivo (gray bars) and after in vitro sorting and expansion (black); N = 16 cell cultures, N = 10 patients. (B) CDR3-α (left) and CDR3-β (right) cell culture sequences. The ex vivo clonality is reported at the bottom. (C to G) The dominant TCRs from (B) were engineered into donor T cells and then tested in vitro. (C) Edited T cells from N = 4 healthy donors were cocultured with peptide-pulsed T cell lines (HLA-A*0201-restricted WT137–45, MAGE-A2212–220 and survivin96–104, HLA-A*0301-restricted hTERT663–672). The normalized Green+Red area representing the amount of target cells undergoing apoptosis (caspase 3/7 activation) overtime upon coculture with T lymphocytes is reported. (D) Edited T cells were cocultured with T cell lines pulsed either with the appropriate peptide or with an unrelated peptide (N = 6 experiments). The elimination index after 3 days coculture is reported [1 − (alive target cells pulsed with the target peptide and cultured with edited T cells/alive target cells pulsed with an unrelated peptide and cultured with edited T cells)]. An elimination index equal to 1 indicates total killing of target cells. (E to G) WT1-, survivin-, and hTERT-redirected engineered T cells were challenged with WT1+, hTERT+, or survivin+ primary AML blasts expressing (target blasts, n = 3 per specificity) or not expressing (control blasts, n = 3) the appropriate HLA-restriction element. The normalized Green+Red area after coculture (E), the elimination index after 1 day of coculture (F) and the percentage of INF-γ and tumor necrosis factor–α–producing CD8+ T cells are reported (G). Two-way ANOVA was used to compare curves. Multiple unpaired Student’s t tests were used to compare groups in (F) and (G). *P < 0.05; **P < 0.01; ****P < 0.0001. The mean and the SEM are shown in (C), (E), and (G).
Fig. 3.
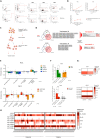
Fig. 3.. The exhaustion signature can be exploited to isolate tumor-specific TCRs.
Bone-marrow infiltrating T cells from Pt#13-14-15 patients at the moment of relapse were sorted into a fraction not expressing (IR) and a fraction expressing (IR+) multiple IRs and then expanded in vitro by means of leukemic-antigen presenting cells (L-APCs). (A) Schematics of the in vitro experimental protocol. (B) After sequential L-APC stimulations, the IR+ (red) and IR (blue) fractions from Pt#14 and Pt#15 were challenged with autologous leukemic blasts. The induction of HLA-DR on CD8+ edited T cells (left), expression of activated caspase 3 on target blasts (mid), and the elimination index (right) are reported. The elimination index was calculated according to the formula [1 − (number of alive blasts cultured with IR+ T cells/number of blasts cultured with IR T cells)]. (C) CDR3 α-(left) and β-chain (right) clonotype frequency in the IR+ and IR fractions, before and after sequential L-APCs stimulation, for all the three patients tested. The expanding dominant IR+ clone is highlighted in red. (D to G) In each patient, the dominant IR+ TCR identified at the end of the stimulation cultures was reconstructed and engineered into T cells derived from n = 1 (Pt#13) and n = 3 (Pt#14-15) different healthy donors. Edited T cells were then challenged with either autologous leukemic blasts or autologous healthy hematopoietic cells. The elimination index (D), the activation (E), degranulation (F), and cytokine production (G) abilities of engineered T cells are reported. The elimination index was calculated using the formula [1 − (number of alive target cells cocultured with engineered T cells/number of alive target cells cocultured alone)]. Two-way ANOVA was used to compare curves in (D), paired multiple Student’s t tests were used to compare groups in (E) to (G). The mean and the SEM are shown in (D) to (G). *P < 0.05; ***P < 0.001.
Fig. 4.
Fig. 4.. PeptiChip and trogocytosis allow to deorphanize tumor-specific T-Cell Receptors.
The trogocytosis effect was quantified in T cells engineered with the orphan TCRs of Fig. 3 and harnessed to perform ligandome analysis (PeptiChip). (A and B) Representative gates (A) and quantification (B) of the trogocytosis effect, defined as the percentage of blasts acquiring the CD3 T cell marker, in blast cultured with T cells engineered with Pt#13 to Pt#15 TCRs, at different effector:target ratios. (C) Experimental layout for the application of trogocytosis and PeptiChip for antigen discovery. (D) Number of 8- to 11-mers retrieved after ligandome analysis of total, CD3+, and CD3 blast fractions cocultured with T cells engineered with either Pt#14 or Pt#15 TCRs, before (left) and after (right) quality control. The relevant epitopes further studied in the following panels are highlighted in red. (E and F) T cells derived from n = 5 different healthy donors and engineered with Pt#13 and Pt#14 TCRs were challenged in vitro with EBV-immortalized B cell lines sharing one or more HLA with the patients and pulsed with the isolated peptides. The elimination index (E) and the number of INF-γ+TFN-α+ CD8+ T cells (F) is reported. The elimination index was calculated using the formula [1 − (number of alive peptide-pulsed target cells cocultured with engineered T cells/number of alive non peptide-pulsed target cells cocultured with engineered T cells)]. (G and H) The expression of fatty acid–binding protein 5 (FAPB5) and histone 2B (H2B) isoforms (HIST1H2BA-B-C-G-H-K-L) were quantified in Pt#14 and Pt#15, respectively (G), and in a cohort of N = 32 matched diagnosis/relapse blast samples pairs (H). The mean and the SEM are shown in (B), (E), and (F). *P < 0.05; **P < 0.01; ***P < 0.001; ****P < 0.0001.

References

    1. M. M. Horowitz, R. P. Gale, P. M. Sondel, J. M. Goldman, J. Kersey, H.-J. Kolb, A. A. Rimm, O. Ringdén, C. Rozman, B. Speck, R. L. Truitt, F. E. Zwaan, M. M. Bortin, Graft-versus-leukemia reactions after bone marrow transplantation. Blood 75, 555–562 (1990). - PubMed
    1. J. Styczyński, G. Tridello, L. Koster, S. Iacobelli, A. van Biezen, S. van der Werf, M. Mikulska, L. Gil, C. Cordonnier, P. Ljungman, D. Averbuch, S. Cesaro, R. de la Camara, H. Baldomero, P. Bader, G. Basak, C. Bonini, R. Duarte, C. Dufour, J. Kuball, A. Lankester, S. Montoto, A. Nagler, J. A. Snowden, N. Kröger, M. Mohty, A. Gratwohl; Infectious Diseases Working Party EBMT , Death after hematopoietic stem cell transplantation: changes over calendar year time, infections and associated factors. Bone Marrow Transplant. 55, 126–136 (2020). - PMC - PubMed
    1. E. J. Wherry, M. Kurachi, Molecular and cellular insights into T cell exhaustion. Nat. Rev. Immunol. 15, 486–499 (2015). - PMC - PubMed
    1. S. P. D’angelo, L. Melchiori, M. S. Merchant, D. Bernstein, J. Glod, R. Kaplan, S. Grupp, W. D. Tap, K. Chagin, G. K. Binder, S. Basu, D. E. Lowther, R. Wang, N. Bath, A. Tipping, G. Betts, I. Ramachandran, J.-M. Navenot, H. Zhang, D. K. Wells, E. Van Winkle, G. Kari, T. Trivedi, T. Holdich, L. Pandite, R. Amado, C. L. Mackall, Antitumor activity associated with prolonged persistence of adoptively transferred NY-ESO-1 c259T cells in synovial sarcoma. Cancer Discov. 8, 944–957 (2018). - PMC - PubMed
    1. A. G. Chapuis, D. N. Egan, M. Bar, T. M. Schmitt, M. S. McAfee, K. G. Paulson, V. Voillet, R. Gottardo, G. B. Ragnarsson, M. Bleakley, C. C. Yeung, P. Muhlhauser, H. N. Nguyen, L. A. Kropp, L. Castelli, F. Wagener, D. Hunter, M. Lindberg, K. Cohen, A. Seese, M. J. McElrath, N. Duerkopp, T. A. Gooley, P. D. Greenberg, T cell receptor gene therapy targeting WT1 prevents acute myeloid leukemia relapse post-transplant. Nat. Med. 25, 1064–1072 (2019). - PMC - PubMed

Substances